
Smart Highway Market Size and Share
Market Overview
| Study Period | 2020 - 2031 |
|---|---|
| Market Size (2026) | USD 79.93 Billion |
| Market Size (2031) | USD 195.04 Billion |
| Growth Rate (2026 - 2031) | 19.53 % |
| Fastest Growing Market | Asia Pacific |
| Largest Market | Asia Pacific |
| Market Concentration | Medium |
Major Players *Disclaimer: Major Players sorted in no particular order Image © Mordor Intelligence. Reuse requires attribution under CC BY 4.0. | |
Smart Highway Market Analysis by Mordor Intelligence
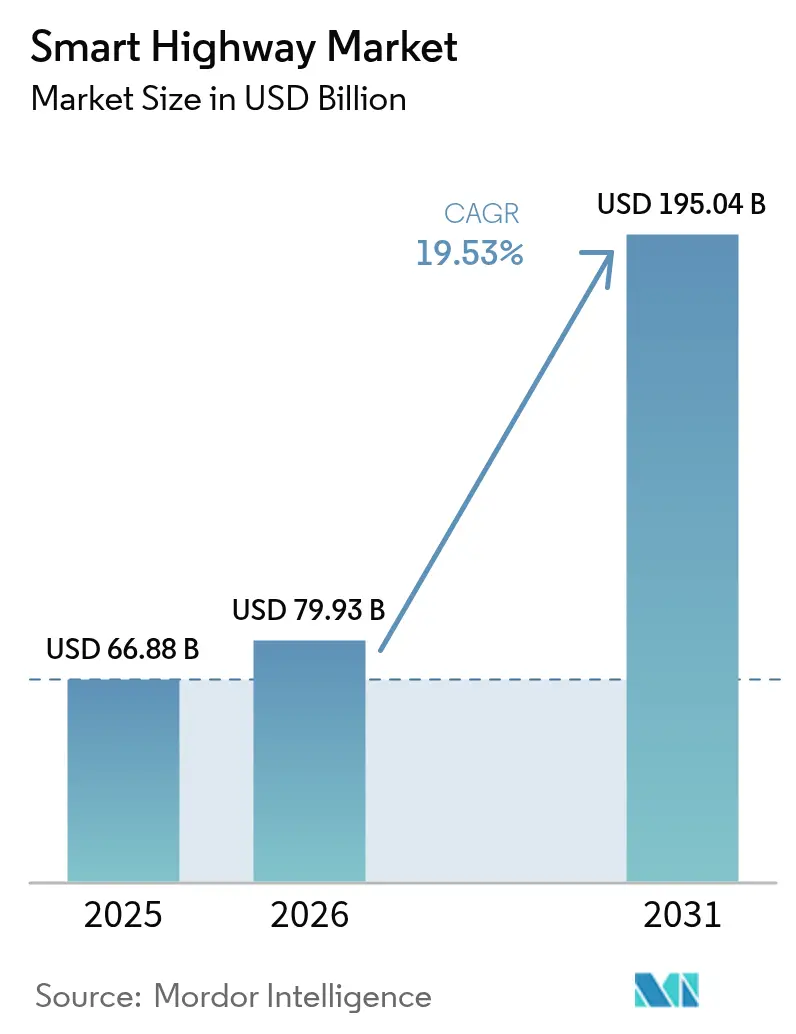
The smart highway market size was valued at USD 66.88 billion in 2025 and estimated to grow from USD 79.93 billion in 2026 to reach USD 195.04 billion by 2031, at a CAGR of 19.53% during the forecast period (2026-2031). Strong public-sector capital programs, rapid advances in connected-vehicle standards, and steep declines in sensor prices anchor this growth trajectory. Asia-Pacific remains pivotal as central and provincial authorities channel funds into multi-lane expressways equipped with IoT nodes, while North America and Europe align regulatory road-safety targets with technology mandates. Large highway owners are shifting from asset-centric procurement to service-level contracting, paving the way for cloud-native traffic platforms that scale nationwide. Private operators view embedded EV-charging strips and solar surface tiles as fresh revenue lanes, and venture-backed software firms are racing to secure edge-analytics footholds before 5G latency advantages normalize.
Key Report Takeaways
- By product technology, smart traffic management systems led with 37.45% revenue share in 2025, while communication systems are forecast to expand at a 20.08% CAGR to 2031.
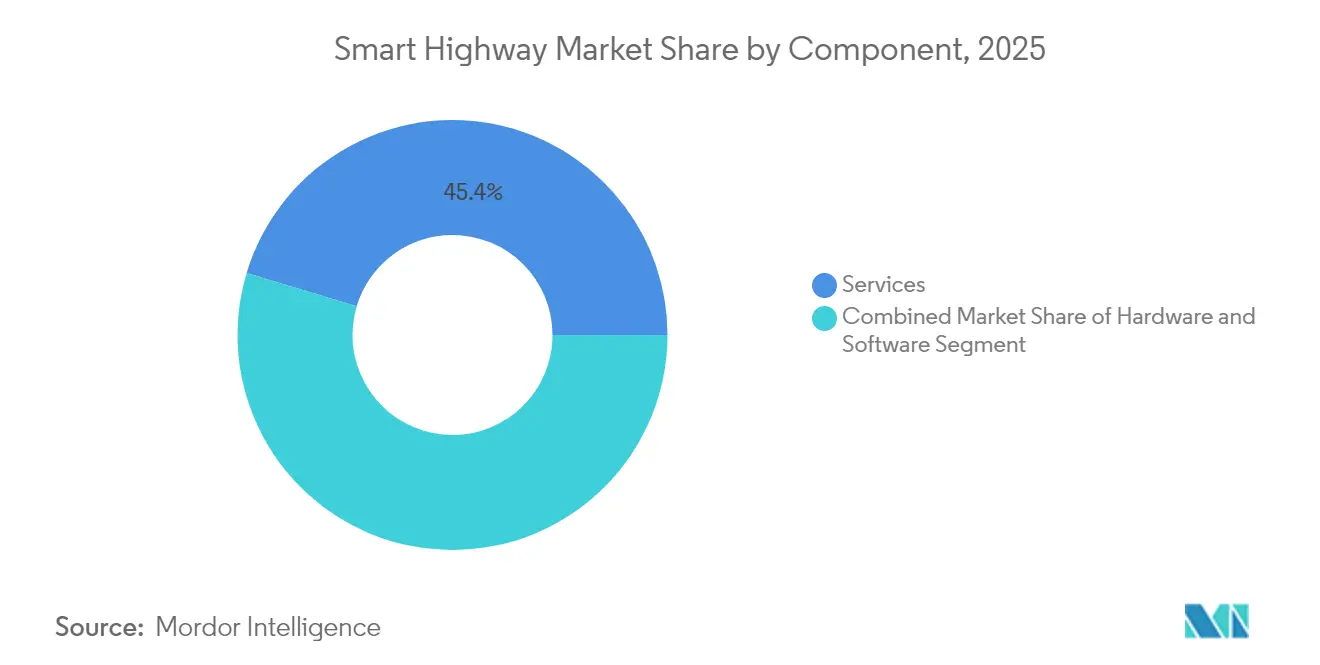
- By component, services captured 45.35% of the smart highway market share in 2025; software is projected to grow at an 18.32% CAGR through 2031.
- By application, traffic congestion management accounted for a 40.22% share of the smart highway market size in 2025 and connected and autonomous vehicle support is advancing at a 21.82% CAGR through 2031.
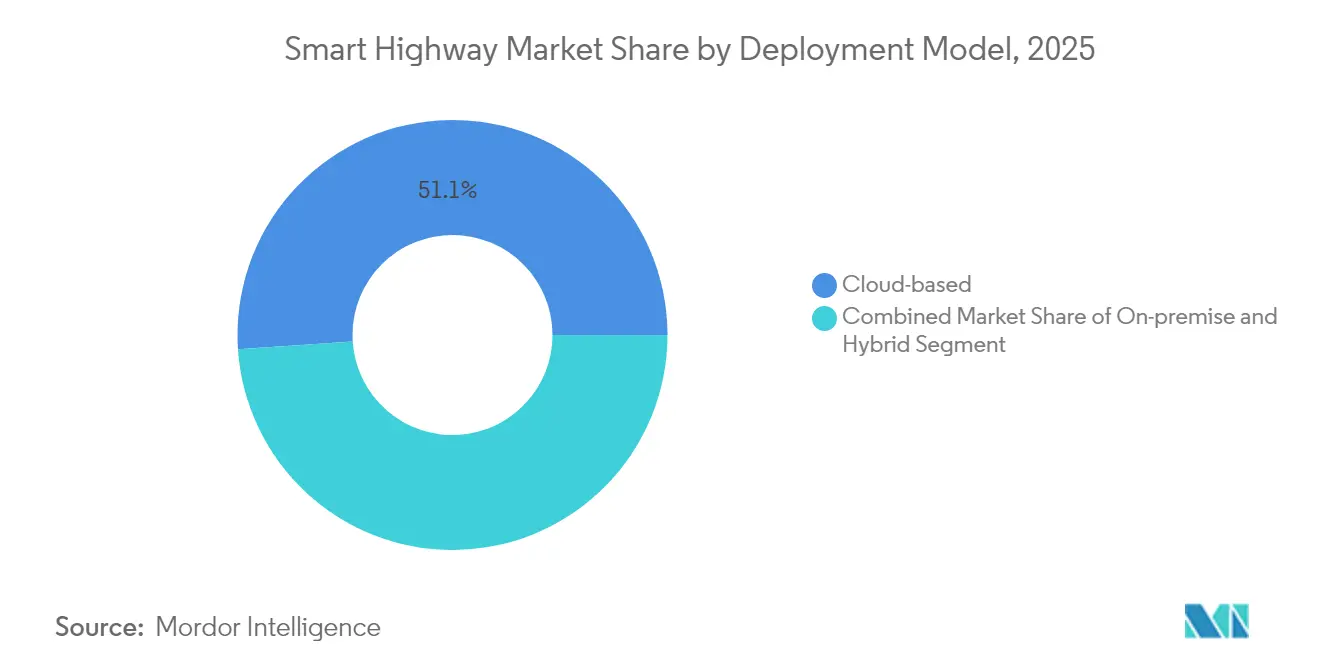
- By deployment model, cloud solutions held 51.05% of the smart highway market share in 2025, while the same model is set to expand at a 19.48% CAGR through 2031.
- By road type, the highway segment commanded 61.10% of the smart highway market share in 2025, while expressway is set to expand at a 18.87% CAGR through 2031.
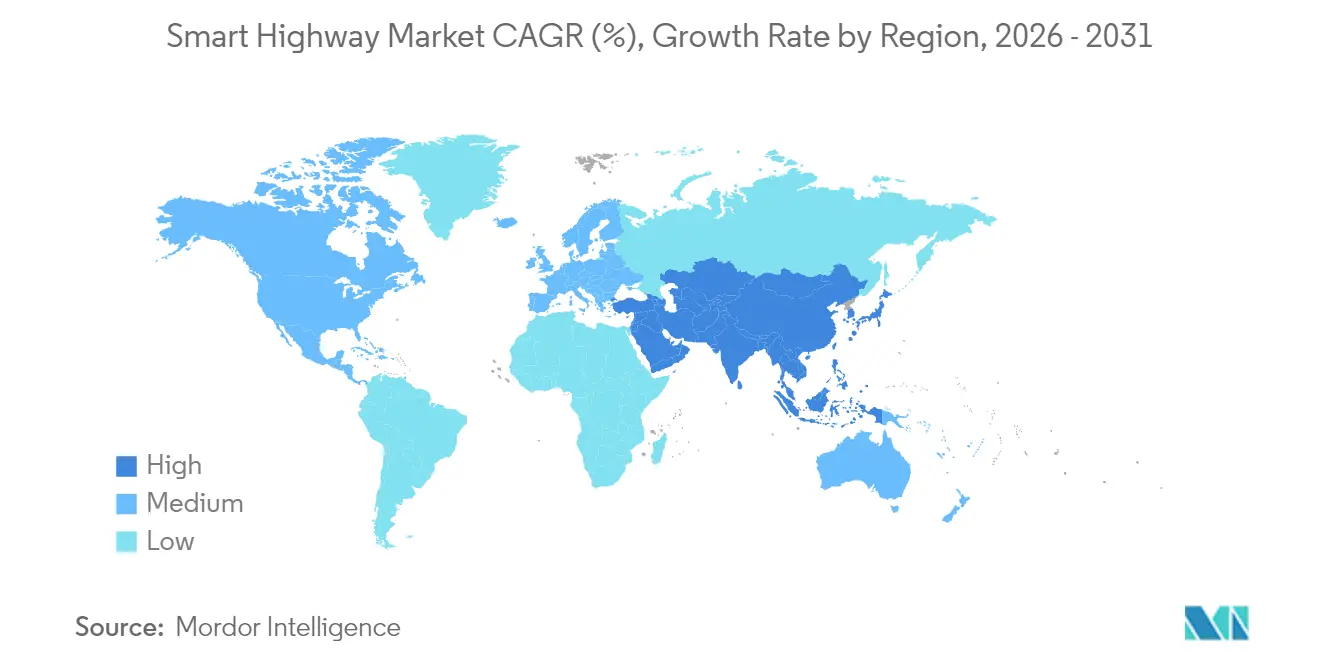
- By geography, Asia-Pacific captured 37.54% of revenue in 2025; the region is projected to grow at an 17.96% CAGR through 2031.
Note: Market size and forecast figures in this report are generated using Mordor Intelligence’s proprietary estimation framework, updated with the latest available data and insights as of 2026.
Market Trends and Insights
Drivers Impact Analysis of Smart Highway Market*
| Driver | (~) % Impact on CAGR Forecast | Geographic Relevance | Impact Timeline |
|---|---|---|---|
| Government smart-infrastructure spending surge | +5.2% | Global; strongest in North America, Europe, Asia-Pacific | Medium term (2–4 years) |
| Growing traffic-congestion costs | +4.1% | Major urban centers worldwide | Short term (≤ 2 years) |
| Mandatory road-safety regulations | +3.7% | Europe, North America, Asia-Pacific rollout | Medium term (2–4 years) |
| Rapid sensor / IoT cost decline | +2.8% | Global | Short term (≤ 2 years) |
| Emerging C-AV ready corridor pilots | +2.3% | North America and Europe; pilot zones in Asia-Pacific | Medium to long term (3–5 years) |
| Dynamic in-road EV-charging pilots | +1.75% | Europe and Asia-Pacific; early-stage trials in North America | Long term (≥ 4 years) |
| Source: Mordor Intelligence | |||
Government smart-infrastructure spending surge
Record-level public appropriations are underwriting multi-year construction pipelines. The Infrastructure Investment and Jobs Act allocates USD 1.2 trillion, including a USD 7.5 billion carve-out for nationwide charging corridors, while India’s 2025 budget channels INR 2,87,333 crore (USD 34.5 billion) toward highway modernisation.[1] Dedicated grant programs tie funds to digital-infrastructure milestones, which effectively guarantee procurement for advanced sensing, analytics, and V2X modules.
Growing traffic-congestion costs
Urban congestion now erodes municipal GDP growth and undermines emissions targets, pressing authorities to deploy AI-directed adaptive signalling. Early deployments in Singapore and London showed measurable travel-time reductions and volatile-organic-compound declines, reinforcing the economic case for city-to-cloud traffic telemetry.
Mandatory road-safety regulations
The 2024 National Roadway Safety Strategy introduced a Safe-System framework that favors automated incident detection and lane-departure alerts. Europe’s General Safety Regulation 2025 revision similarly mandates intelligent speed assistance, ensuring continued momentum for sensor-dense carriageways.
Rapid sensor / IoT cost decline
Unit prices for radar, lidar, and vision modules have fallen faster than Moore’s Law projections, opening secondary corridors and peri-urban arterials to digital upgrades. Low-power cameras with on-board AI inference now ship at price points once reserved for basic CCTV, accelerating total lane-kilometre coverage.
Restraints Impact Analysis of Smart Highway Market*
| Restraint | (~) % Impact on CAGR Forecast | Geographic Relevance | Impact Timeline |
|---|---|---|---|
| High capex and long payback | -3.2% | Developing economies most exposed | Medium term (2-4 years) |
| Data-privacy and cyber-security risks | -2.5% | Notably North America, Europe | Short term (≤ 2 years) |
| Inter-agency interoperability gaps | -1.7% | Multi-jurisdiction corridors | Medium term (2-4 years) |
| PPP procurement delays | -1.3% | Emerging markets | Short term (≤ 2 years) |
| Source: Mordor Intelligence | |||
High capex and long payback
Full-stack smart-corridor retrofits demand roadside units, fibre backbones, and cloud orchestration that rarely deliver fiscal break-even within a single political term. Multilateral lenders require blended-finance structures to mitigate sovereign-risk premiums, slowing bid-to-award cycles.
Data-privacy and cyber-security risks
The March 2025 rule on connected-vehicle ICT supply chains imposes strict vendor-origin checks on roadside equipment.[2]Operators now budget for layered zero-trust architectures, penetration testing, and cyber-insurance premiums, which lift project costs and prolong integration schedules.
*Our forecasts treat driver/restraint impacts as directional, not additive. The impact forecasts reflect baseline growth, mix effects, and variable interactions.
Smart Highway Market Segment Analysis
By Component:
Services Anchor Digital TransformationServices held 45.35% revenue share in 2025 as governments relied on integrators to dovetail legacy assets with edge-native platforms. Advisory teams orchestrate change-management programs, while managed-service contracts guarantee round-the-clock network uptime. Software revenue is smaller today yet grows at an 18.32% CAGR, propelled by subscription-based analytics that monetise traffic metadata. Hardware remains essential but is increasingly commoditised; the arrival of software-defined roadside units enables over-the-air feature releases without civil-works disruption. This architecture boosts lifetime ROI and eases compliance with evolving V2X standards.
Smart highway market operators recognise that labour-intensive design-build-operate contracts transfer performance risk to vendors. Outcome-oriented service-level agreements encourage predictive maintenance driven by digital twins that mirror pavement stress and signal latency, lowering unplanned closures. As procurement offices pivot toward total-cost-of-ownership metrics, service consortia are likely to consolidate, echoing trends seen in cloud-infra outsourcing during the prior decade.

By Product Technology:
Traffic Management Drives AdoptionSmart traffic management systems account for 37.45% of 2025 revenue and remain the entry point for municipal pilots. AI-guided signal phasing, variable-speed advisories, and hard-shoulder running demonstrate visible congestion relief that satisfies commuter watchdogs. Communication systems, projected to expand at 20.08% CAGR, underpin emerging cooperative-driving use cases. The edge-cloud mesh handles sub-ten-millisecond handshakes between connected vehicles and gantry radios, enabling lane-merge orchestration at scale.
A notable shift is the infusion of computer-vision cameras that dynamically adjust resolution grids to cut energy draw while tracking dense traffic scenes. Platform suppliers bundle these sensors with microservices that feed predictive engines, moving the smart highway market beyond reactive control loops to anticipatory optimisation.
By Application:
Congestion Management Dominates PrioritiesTraffic congestion management retains 40.22% share as cities monetise travel-time savings through dynamic tolling and freight priority lanes. Every 1 % drop in delay equates to meaningful GDP lift and emissions cuts, aligning financial and sustainability KPIs. The connected and autonomous vehicle support niche grows the fastest at 21.82% CAGR, driven by automakers’ need for high-definition maps, continuous over-the-air updates, and redundancy lanes for Level-4 vehicles.
Incident detection platforms now blend smartphone inertial-measurement-unit data with roadside radar to triangulate crash sites and dispatch responders in under three minutes.These capabilities strengthen political will for broader sensor coverage, anchoring long-run investment cases.
By Deployment Model:
Cloud Solutions Accelerate ImplementationCloud deployments captured 51.05% revenue share and are poised to widen their lead as operators decommission proprietary data centres. Pay-as-you-use compute allows agencies to start small, scaling analytics clusters when corridor utilisation soars. Hybrid topologies persist where data-sovereignty statutes demand localised storage. Edge nodes execute safety-critical commands such as automated emergency braking within 50 milliseconds, while complex optimisation routines run in regional clouds.
Performance baselines prove compelling, agencies report 30% faster algorithm iterations and 40% lower maintenance outlays after migrating to managed platforms. Consequently, the smart highway market size for cloud-native solutions is projected to hit USD 99.55 billion by 2031, equal to nearly 51.05% of total spending.
By Road Type:
Highways Prioritise Smart InfrastructurePrimary highways represent 61.10% share because national freight corridors carry the heaviest economic load. Ministries prioritise these lanes for embedded weigh-in-motion scales, automated lane-keeping beacons, and in-road charging coils that top up commercial EVs at cruising speed. India targets 10,000 km of new lanes in FY 2025-26, though China plans a 30,000 km extension within the same window. The investment gap underscores divergent execution models, China favours integrated design-build contracts using modular prefabrication, while India’s parcelled approvals stretch timelines.
Urban roads trail due to complex stakeholder coordination and curbside uses that complicate sensor placement. Expressways present a middle ground, adopting corridor-wide V2X while piloting lane-specific dynamic tolling.
Geography Analysis
APAC Smart Highway Market
Asia-Pacific secures 37.54% revenue and expands at an 17.96% CAGR through 2031. National governments position digital corridors as engines for economic rebalancing from coastal megacities to interior manufacturing hubs. China’s rollout of nearly 800 smart-city pilots embeds roadway telemetry in wider data-governance frameworks.India deepens budget-line allocations, helped by multi-lateral green-bond issuances that ring-fence funds for ITS.
Europe, United Kingdom and Nordics Smart Highway Market
Europe commands 33.18% share and champions common standards that enable cross-border continuity. The UK’s Connected and Automated Mobility roadmap assigns GBP 100 million (USD 126 million) to prove self-driving logistics corridors, projecting a GBP 42 billion market by 2035.Scandinavian administrations integrate smart highways with green-hydrogen truck stops to align with Fit-for-55 emissions ceilings, turning climate policy into procurement leverage.
North America Smart Highway Market
North America holds 29.28% revenue and grows at 14.78% CAGR. Federal stimulus accelerates design-build finance models, while state DOTs embrace open-application-programming-interface mandates that level the playing field for mid-sized software vendors. Canada pilots digital-twin sub-layers beneath resurfaced asphalt to model freeze-thaw stress, and Mexico bundles ITS rollouts with fibre concessions along tollways to cross-subsidise capital outlays. The smart highway market size in North America is slated to reach USD 44.78 billion by 2031.
Regulatory Landscape
In the European Union, the revised ITS framework under Directive (EU) 2023/2661 expands coverage to cooperative ITS (C-ITS), automated mobility, and multimodal digital services. Member states were required to transpose the directive by 21 December 2025, and subsequent Commission delegated acts for 2026-2027 focus on binding specifications for C-ITS interoperability, security credential management, and data sharing, increasing compliance demands for roadway operators and prime integrators.
In the United States, the national ITS governance foundation includes 23 U.S. Code Section 517 (national ITS architecture and standards), which supports systems engineering, interoperability, and standards alignment across federally funded deployments. In parallel, the U.S. Department of Transportation opened a formal inquiry in February 2026 on Transportation Digital Infrastructure (TDI), signaling a policy track that can shape nationwide architecture decisions for V2X and corridor-level data exchange, while supply-chain scrutiny for connected-vehicle and roadside ICT adds procurement constraints for hardware and communications stacks.
Value Chain Analysis
The smart highway value chain starts with standards and corridor design requirements set by road authorities and national architectures, then moves into civil works and power and fiber backbones, followed by procurement of roadside sensing and communications. Key technology inputs include V2X roadside units (RSUs), sensor and compute pods, ramp metering and lane-control systems, automated incident detection (AID) software, and secure networking that links field devices with traffic management centers and cloud platforms.
System integration and operations account for a large share of delivery, covering multi-vendor interoperability, cybersecurity hardening, and long-term maintenance under performance-based contracts. Recent corridor programs show how the chain runs from pilot buildout to production deployment: Cavnue completed construction on a connected corridor pilot phase on I-94 in Michigan (July 2024), Riverside County Transportation Commission broke ground on the I-15 Smart Freeway Pilot Project in California (January 2025), and Kapsch TrafficCom with the North Carolina Turnpike Authority launched a production-ready V2X toll collection system on the Triangle Expressway (August 2025), illustrating how tolling specialists, corridor developers, and public owners combine to scale deployments.
Competitive Landscape
The smart highway market remains moderately fragmented yet shows unmistakable consolidation cues. Siemens, IBM, and Cisco deploy end-to-end suites spanning roadside units to cloud dashboards, exploiting scale to meet turnkey tender requirements. Kapsch TrafficCom and SWARCO partner with civil-works majors, embedding proprietary lane-control algorithms into concrete-pavement contracts.
Strategic moves illustrate differentiation paths. Cisco repurposed street-light poles as multi-sensor hubs during Smart City Expo US 2025, creating an upgrade path for municipalities that lack roadside real estate. EnGoPlanet launched ultra-thin photovoltaic luminaires that integrate environment sensors, offering operators new carbon-credit monetisation vectors. Siemens expanded its Mobility Software Suite with cloud-native digital-twin modules to cut traffic-simulation runtime by 70%.
Solar Roadways pioneers hexagon tiles that generate electricity while melting snow, and start-ups in Israel and South Korea commercialise inductive charging coils rated for 200 kW. M&A intensity is likely to increase as platform owners seek proprietary power-management IP to complement traffic-control portfolios.
Smart Highway Industry Leaders
-
Alcatel-Lucent Enterprise (Nokia Corporation)
-
Cisco Systems Inc.
-
IBM Corporation
-
Indra Sistemas SA
-
Infineon Technologies AG
- *Disclaimer: Major Players sorted in no particular order

Smart Highway Market Companies Covered in this Report
- Alcatel-Lucent Enterprise (Nokia)
- Cisco Systems Inc.
- IBM Corporation
- Indra Sistemas SA
- Infineon Technologies AG
- Huawei Technologies Co. Ltd
- Kapsch TrafficCom AG
- LG CNS Co. Ltd
- Schneider Electric SE
- Siemens AG
- Xerox Holdings Corporation
- Thales Group
- Iteris Inc.
- Cubic Transportation Systems
- SWARCO AG
- TransCore (Roper Tech.)
- Econolite Group Inc.
- TomTom N.V.
- Conduent Inc.
- Continental AG
- FLIR Systems Inc.
- PTC Inc.
Market Opportunities and Future Outlook
Standardization and compliance-driven upgrades create whitespace in interoperability, credential management, and data exchange across multi-jurisdiction corridors. In Europe, Directive (EU) 2023/2661 and follow-on delegated acts for 2026-2027 push C-ITS programs toward binding technical specifications, which raises demand for compliant RSUs, security credential management, and standardized roadway data feeds (for example, DATEX II and TN-ITS) that can be consumed by traffic management centers and connected-vehicle services.
Operational AI and corridor automation are moving from concept to live deployments that broaden the addressable project set beyond new-build expressways. In the United States, TxDOT launched a 4-mile AI-powered Smart Corridor pilot on SH 130 in Pflugerville using 66 AI cameras for incident detection (May 2026), and Riverside County Transportation Commission activated Californias first Smart Freeway system on an 8-mile stretch of northbound I-15 in Temecula (June 2026). These deployments reinforce near-term opportunities in retrofit-friendly sensing, edge-to-cloud analytics, and managed services that integrate incident detection, ramp metering, and traveler information, while newer standards such as ISO/TR 17739-1:2026 for roadside infrastructure-supported location-based services support productization of connected automated mobility functions at the infrastructure layer.
Recent Industry Developments in Smart Highway Market
- June 2026: Riverside County Transportation Commission activated Californias first Smart Freeway system on an 8-mile stretch of northbound I-15 in Temecula. The project operationalized corridor-level control and monitoring capabilities as a deployable template, strengthening the case for replicable retrofit programs that combine field devices with centralized software operations.
- August 2025: Kapsch TrafficCom and the North Carolina Turnpike Authority launched a production-ready V2X toll collection system on the Triangle Expressway. The move connects roadside communications with tolling operations, expanding the role of V2X from safety pilots into revenue-critical workflows that require high availability and secure data handling.
- July 2024: Cavnue completed construction on the pilot phase of a connected corridor on I-94 in Michigan. Completing the build phase advanced the corridor from planning to operational testing, supporting broader procurement interest in modular roadside sensor and compute pods delivered through public-private partnership models.
Smart Highway Market Report Scope and Research Methodology
Market Definition and Coverage
For this study, the smart highway market is the revenue earned from digital and connected systems deployed on road corridors to monitor traffic, manage flow, support safety, and enable faster incident response through hardware, software, and related services.
Scope exclusions: We exclude stand-alone smart city projects that are not tied to road corridors, and we also exclude non-road transport infrastructure.
Segments Covered in This Report
- By Component
- Hardware
- Software
- Services
- By Product Technology
- Smart Traffic Management Systems
- Smart Transport Management Systems
- Monitoring Systems
- Communication Systems
- Lighting and Energy Systems
- Other Technologies
- By Application
- Traffic Congestion Management
- Safety and Incident Detection
- Smart Parking
- Toll Collection
- Emission Monitoring
- Connected and Autonomous Vehicle Support
- Other Applications
- By Deployment Model
- On-premise
- Cloud-based
- Hybrid
- By Road Type
- Highway
- Urban Road
- Expressway
- By Geography
- North America
- United States
- Canada
- Mexico
- South America
- Brazil
- Argentina
- Rest of South America
- Europe
- Germany
- United Kingdom
- France
- Italy
- Spain
- Rest of Europe
- Asia-Pacific
- China
- Japan
- India
- South Korea
- Rest of Asia-Pacific
- Middle East and Africa
- Middle East
- Saudi Arabia
- United Arab Emirates
- Rest of Middle East
- Africa
- South Africa
- Nigeria
- Rest of Africa
- Middle East
- North America
Data Sources, Market Sizing, and Validation
Desk Research
Desk work starts with defining what should be counted as smart highway spend and what should not, then mapping the typical buying and deployment cycle (public budgets, tenders, and multi-year programs). We use public sources for the base demand pool and context, including national transport and highway statistics, road safety agencies, World Bank transport indicators, OECD infrastructure datasets, and standards bodies relevant to connected transport.
After that, we gather pricing logic and adoption signals using sources such as government tender portals, customs and trade statistics for key electronics categories, company annual reports and investor presentations, and credible press releases on corridor upgrades. Where needed, a paid subscription for company financials and a shipment-level trade database are used to cross-check revenue and deployment momentum. These desk sources are illustrative only, and other references are used for data collection, validation, and clarification.
Primary Interviews and Surveys
Primary work is used to confirm what gets budgeted and what is actually deployed on corridors, then to test price ranges and typical project scope (new build versus retrofit). We speak with a mix of solution providers, integrators, and buyers such as road authorities and concession operators across APAC, EMEA, and the Americas, so desk research assumptions can be corrected where local procurement and rollout practice differ from the initial model.
Distribution of primary research fieldwork respondents
| Company type | Respondent position | Region |
|---|---|---|
| Top tier: 32% | CXOs: 20% | APAC: 42% |
| Mid tier: 46% | Functional/Unit leaders: 35% | EMEA: 32% |
| Smaller Players: 22% | Managers: 45% | Americas: 26% |
Market-Sizing & Forecasting
Sizing is built using a top-down and bottom-up logic, where we first reconstruct the addressable spend by linking road network investment and corridor modernization plans to the penetration of smart systems, then validate totals using selective supplier and channel checks. In practice, the model is driven by inputs such as lane-kilometers covered, share of highways and urban roads targeted for upgrades, tendered project values, average system cost per corridor and per site (for example, tolling points and monitoring points), and the split between upfront hardware and recurring software and services.
For forecasting, scenario analysis is used to reflect how funding cycles, rollout timing, and technology refresh can shift yearly spend, and then the scenarios are anchored to expert views from interviews. When bottom-up signals are missing, assumptions are filled carefully using proxy adoption rates from similar corridor programs and adjusting for local price levels. We then recheck the resulting path against observed tender cadence and typical project duration to keep the trajectory realistic.
Data Validation & Update Cycle
Validation is done through repeated checks that compare the modeled market totals with independent signals such as tender pipelines, corridor rollout announcements, and spending consistency versus wider ITS and highway capex patterns. Any large swings are reviewed, assumptions are revisited, and follow-up calls are triggered when pricing or deployment timing looks out of line.
Before sign-off, the model is reviewed in steps so outliers can be explained, corrected, or documented, and the final numbers are checked for internal consistency across regions and major use cases. Reports are refreshed annually, and interim updates are made when material events happen, such as major policy shifts or large program awards. Right before delivery, an analyst performs a fresh pass so clients receive the latest updated view.
Mordor Intelligence's Smart Highway Market Size Compared With Other Published Estimates
Published smart highway numbers can look far apart even when the topic sounds identical, because each publisher draws the boundary differently and then applies its own pricing and timing assumptions. The biggest drivers usually come from what is counted as smart highway spend, how recurring software and services are treated, and whether the estimate is tied to actual deployment timing or to broader infrastructure digitization.
When refresh cadence and currency timing are handled carefully, the yearly value tends to reflect what gets awarded and delivered in that period rather than smoothing the curve too much, and this is one reason the 2025 figure in Mordor Intelligence differs from some other estimates. Differences also show up when one model uses a higher assumed average selling price for corridor systems, or when adjacent categories like broader smart city platforms are included without a clear corridor link.
Benchmark comparison
| Source | Market Size | Gaps in Research Methodology |
|---|---|---|
| Mordor Intelligence | USD 66.88 B (2025) | |
| Industry Publisher A | USD 64.30 B (2025) | Uses a broader technology bucket with less emphasis on award-to-revenue timing, which can smooth annual values and lower the visible impact of large program ramp-ups. |
| Global Consultancy B | USD 52.40 B (2025) | Applies more conservative price and rollout assumptions, and it appears to undercount the mix shift toward software and services in multi-year corridor programs. |
The table shows that the spread is mainly explained by timing treatment and the way average prices and recurring revenue are applied, not by disagreement that smart highway programs are expanding. By keeping the scope tied to corridor deployments and by checking assumptions against tenders and rollout signals, our estimate remains traceable to specific drivers and can be repeated when inputs change.
Key Questions Answered in the Report
What is the current size of the smart highway market?
The market stands at USD 79.93 billion in 2026 and is forecast to reach USD 195.04 billion by 2031.
Which segment leads the smart highway market by product technology?
Smart traffic management systems lead with 37.45% revenue share in 2025.
How fast is the cloud deployment model growing?
Cloud-based implementations are projected to expand at a 19.48% CAGR through 2031.
Which region holds the largest share of the smart highway market?
Asia-Pacific holds 37.54% revenue share and is expected to grow at an 17.96% CAGR to 2031.
What is the major restraint facing smart highway adoption?
High capital expenditure and extended payback periods reduce project momentum, particularly in developing economies.
Why are communication systems gaining importance in smart highways?
They enable real-time V2X data exchange that supports autonomous-vehicle operations and other advanced services, driving a projected 20.08% CAGR.