
Market Overview
| Study Period | 2021 - 2031 |
|---|---|
| Market Size (2026) | USD 26.97 Billion |
| Market Size (2031) | USD 36.65 Billion |
| Growth Rate (2026 - 2031) | 6.33 % |
| Fastest Growing Market | Asia Pacific |
| Largest Market | Europe |
| Market Concentration | Medium |
Major Players
*Disclaimer: Major Players sorted in no particular order Image © Mordor Intelligence. Reuse requires attribution under CC BY 4.0. |
|
E-Cigarette Market Analysis by Mordor Intelligence
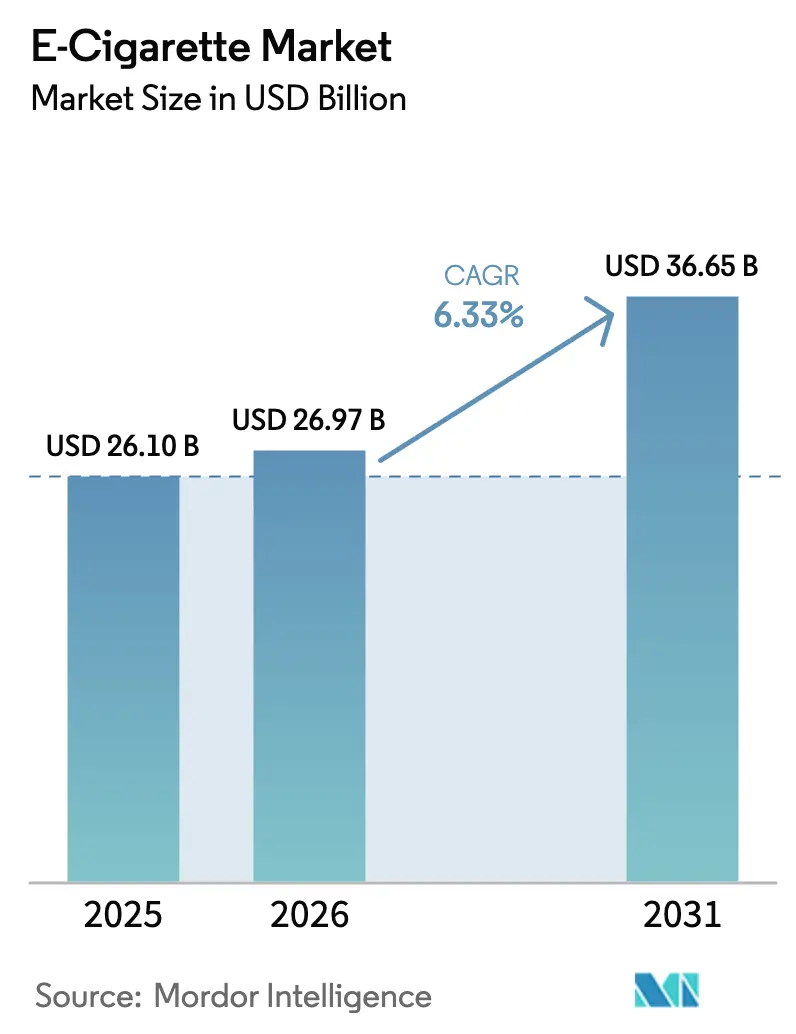
The E-Cigarette Market size is expected to increase from USD 26.10 billion in 2025 to USD 26.97 billion in 2026 and reach USD 36.65 billion by 2031, growing at a CAGR of 6.33% over 2026-2031. This consistent growth trajectory is driven by a notable shift in consumer preferences away from traditional tobacco, a maturing regulatory landscape, and swift innovations in devices and liquids across major regions. In 2025, Europe stood out as the dominant revenue hub, while the Asia-Pacific emerged as the primary engine for volume growth, with countries from Indonesia to New Zealand adjusting their harm-reduction policies. Innovations like closed-pod convenience, flavor engineering, and advanced energy-dense batteries have broadened the user base, attracting not just traditional smokers. Furthermore, leading companies, leveraging vertically integrated supply chains, have significantly shortened product refresh cycles from years to mere months. Key market opportunities are emerging around refillable ecosystems, omnichannel distribution, and novel oral nicotine formats, especially in light of potential legislation targeting disposable bans.
Key Report Takeaways
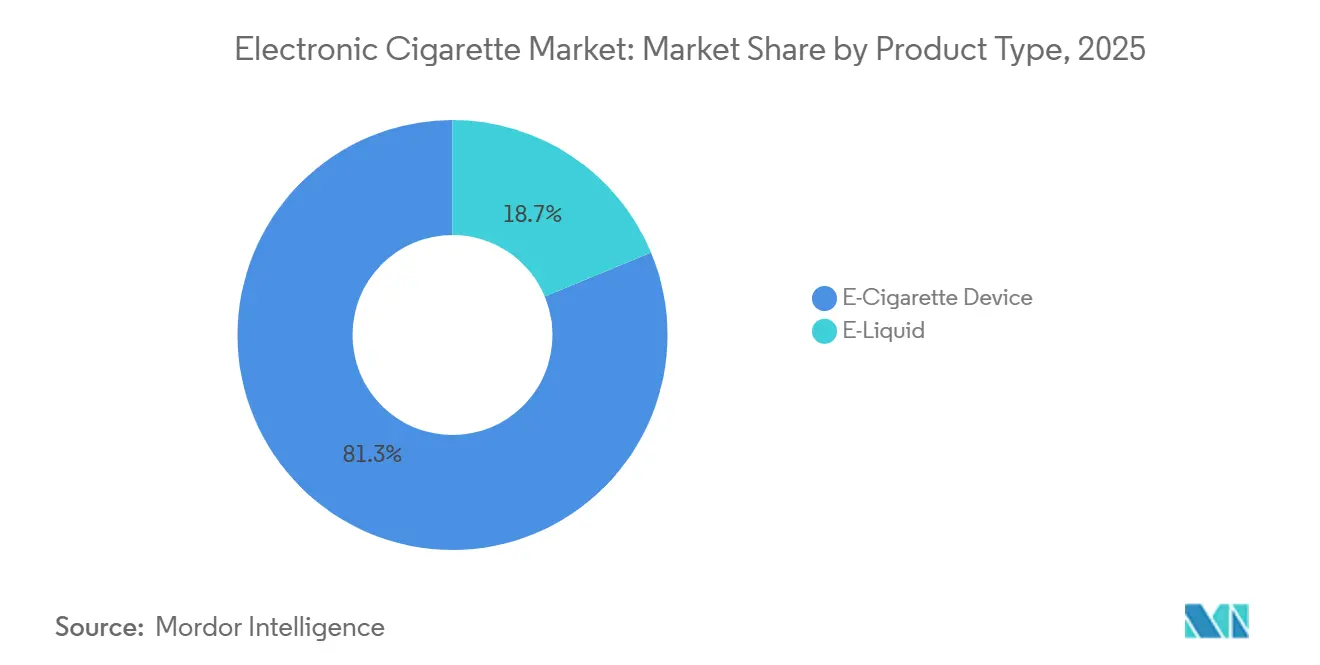
- By product type, e-cigarette devices led with 81.27% revenue share in 2025; e-liquids are predicted to expand at a 6.82% CAGR through 2031.
- By category, closed vaping systems commanded 73.62% of the E-Cigarette market share in 2025, while open systems are forecast to grow at a 6.97% CAGR through 2031.
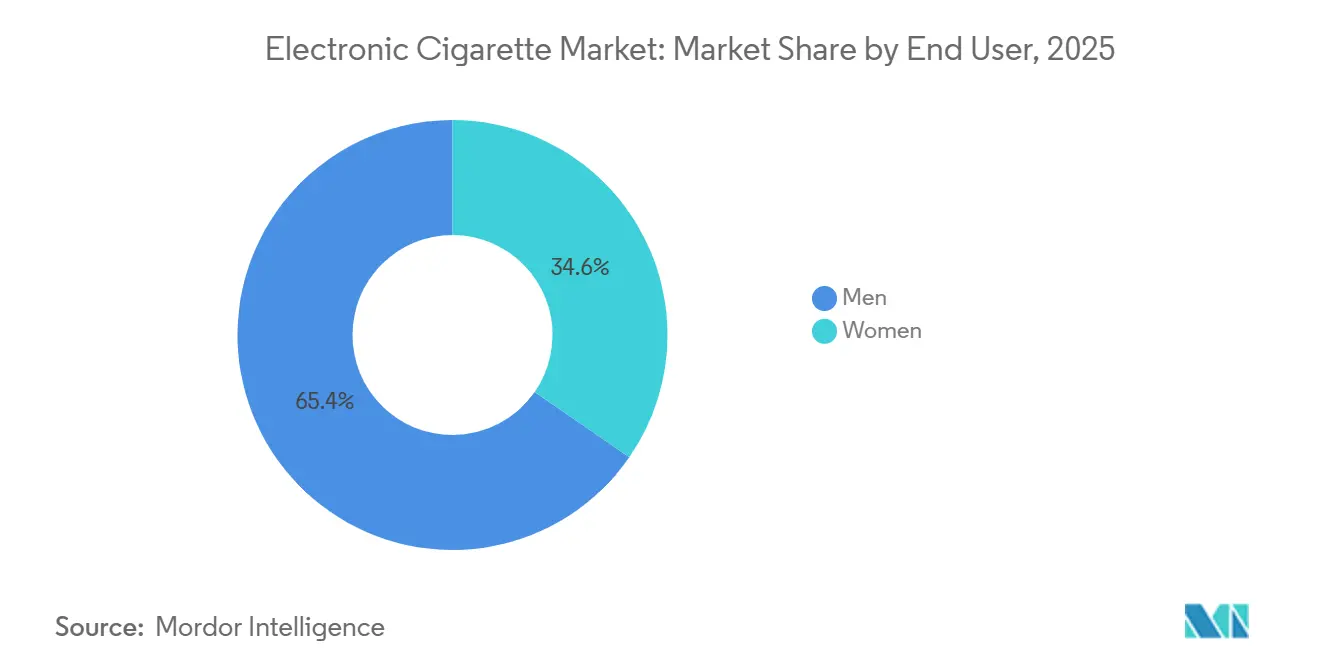
- By end user, men held 65.37% consumption in 2025; women’s uptake is advancing at a 7.59% CAGR to 2031.
- By distribution channel, offline stores secured 71.28% of 2025 sales; online platforms are poised to post a 7.48% CAGR growth through 2031.
Note: Market size and forecast figures in this report are generated using Mordor Intelligence’s proprietary estimation framework, updated with the latest available data and insights as of January 2026.
Global E-Cigarette Market Trends and Insights
Drivers Impact Analysis*
| Driver | (~) % Impact on CAGR Forecast | Geographic Relevance | Impact Timeline |
|---|---|---|---|
| Growing health consciousness and smoking cessation | +1.2% | Global, with concentration in North America, Europe, and Organisation for Economic Co-operation and Development (OECD) Asia-Pacific markets | Medium term (2-4 years) |
| Technological advancements in production | +0.9% | Global, led by China manufacturing hubs, spillover to North America and Europe | Long term (≥4 years) |
| Flavor innovation and diverse product offerings | +0.8% | North America, Europe, Asia-Pacific (excluding flavor-restricted markets) | Short term (≤2 years) |
| Growth in social media and influencer marketing | +0.6% | North America, Europe, select Asia-Pacific urban centers | Short term (≤2 years) |
| Convenience and user-friendly design | +0.7% | Global, with emphasis on urban markets in Asia-Pacific and Europe | Medium term (2-4 years) |
| Customizable nicotine levels | +0.5% | North America, Europe, Australia, New Zealand | Medium term (2-4 years) |
| Source: Mordor Intelligence | |||
Growing health consciousness and smoking cessation
Public health agencies are revising their approach to vaping, now considering it a viable harm-reduction tool and creating regulatory frameworks that were unavailable a decade ago. In 2024, the Food and Drug Administration approved NJOY's menthol e-cigarettes for premarket use, citing reduced exposure to harmful combustion toxicants as a primary justification. This approval marked a significant milestone as the first menthol vaping product to receive such authorization. The decision was supported by longitudinal studies showing that adult smokers who switched to e-cigarettes had significantly lower biomarkers of carcinogen exposure compared to those who continued smoking combustible products. As of 2024, the Office for National Statistics reported that about 5.4 million adults (10.0%) aged 16 and older in Great Britain use e-cigarettes either daily or occasionally[1]Source: Office for National Statistics, "Adult smoking habits in the UK: 2024", ons.gov.uk. Sweden's near-eradication of smoking through the adoption of snus and vaping has influenced policymakers in New Zealand and Australia to reconsider outright bans, favoring prescription-based models instead. However, a 2024 World Health Organization report raised concerns about the prevalence of dual use, simultaneous smoking and vaping, in emerging markets, which weakens cessation efforts and complicates public health messaging. Growing health concerns related to smoking are driving consumers toward e-cigarettes. For example, the American Lung Association reported nearly 235,000 new lung cancer cases in the United States in 2024[2]Source: American Lung Association, "State of Lung Cancer - 2024 Report", lung.org .
Technological advancements in production
Manufacturers are accelerating product development cycles while enhancing nicotine delivery systems to replicate the pharmacokinetics of traditional combustible cigarettes more precisely. The adoption of ceramic heating elements, which have replaced older nichrome coils, has been a significant innovation. These ceramic elements maintain temperature stability within a narrow range of ±2°C, effectively reducing the formation of harmful aldehydes and ensuring a more consistent flavor profile for users. Additionally, advancements in battery energy density, largely driven by technological spillovers from the electric vehicle supply chain, have significantly extended the lifespan of disposable vapes. These devices have evolved from offering 300 puffs to as many as 800 puffs, fundamentally altering the cost dynamics and appeal of single-use formats. Furthermore, premium vaping devices now feature integrated Bluetooth connectivity and app-based usage tracking, enabling the collection of detailed user data to guide product improvements. However, efforts to monetize this data face significant challenges due to stringent privacy regulations, particularly in regions such as the European Union and California, which impose strict controls on data usage and sharing.
Flavor innovation and diverse product offerings
In saturated markets, flavor portfolios have become a critical differentiator, but regulatory crackdowns are driving strategic adjustments. The United Kingdom government's 2024 proposal to ban disposable vapes and restrict flavors to tobacco and menthol mirrors California's 2020 flavor ban, which led to increased cross-border purchases and illicit trade. In response, Imperial Brands' blu brand introduced "tobacco blend" variants with subtle fruit undertones, complying with descriptor restrictions while maintaining consumer appeal. The European Union's Tobacco Products Directive bans characterizing flavors in combustibles but permits them in e-cigarettes, creating a regulatory gap that has encouraged vaping adoption among former smokers who avoided tobacco-flavored options. Flavor chemists are now developing "cooling agents" like WS-23 and WS-3, which replicate menthol sensations without violating flavor bans. However, regulators in Australia and New Zealand are working to close this loophole. The expansion of dessert and beverage flavors, such as vanilla custard, mango ice, and cola, has extended the market's reach beyond smoking cessation to lifestyle consumption. Public health advocates argue that this trend undermines harm-reduction goals by attracting individuals who have never smoked.
Growth in social media and influencer marketing
In 2024, the Food and Drug Administration issued warning letters to 15 social media influencers for promoting e-cigarettes without properly disclosing paid partnerships. This action prompted platforms like Instagram and TikTok to implement automated content filters to flag vaping-related posts. In response to these regulatory changes, brands are increasingly focusing on user-generated content and affiliate networks. For example, British American Tobacco's Vuse brand transitioned to geofenced mobile advertising and loyalty apps, avoiding social media gatekeepers. This shift has led to significantly higher customer retention rates compared to traditional digital campaigns. At the same time, influencer marketing has moved to closed communities on platforms such as Discord and Telegram, where age verification is weak and regulatory oversight is minimal. The European Commission's 2024 consultation on digital advertising restrictions for nicotine products indicates a stricter regulatory environment ahead. This is likely to push brands to reallocate budgets from digital channels to point-of-sale activations and experiential marketing. Additionally, the expansion of internet access continues to drive social media usage. For example, the International Telecommunication Union estimated that by 2025, approximately 6 billion people, about three-quarters of the global population, will have internet access, up from 5.8 billion in 2024[3]Source: International Telecommunication Union, "Global number of Internet users increases", itu.int.
Restraints Impact Analysis*
| Restraint | (~) % Impact on CAGR Forecast | Geographic Relevance | Impact Timeline |
|---|---|---|---|
| Stringent regulatory framework | -1.1% | Global, with highest intensity in Australia, European Union, and United States | Long term (≥4 years) |
| High production and operational costs | -0.7% | Global, with acute pressure in North America and Europe due to compliance requirements | Medium term (2-4 years) |
| Health campaign opposition | -0.5% | North America, Europe, Australia | Medium term (2-4 years) |
| Age and access restrictions | -0.4% | Global, with strictest enforcement in North America, Europe, and Oceania | Short term (≤2 years) |
| Source: Mordor Intelligence | |||
Stringent regulatory framework
Regulatory fragmentation remains the sector's primary constraint, with compliance costs and market access barriers varying across jurisdictions. In 2024, Australia's Therapeutic Goods Administration introduced a prescription-only model for nicotine vaping products, significantly restricting recreational use and disrupting retail distribution networks. The Food and Drug Administration's premarket tobacco product application (PMTA) process has approved fewer than 30 products, effectively creating an oligopoly that benefits established players with regulatory budgets exceeding USD 50 million annually. South Korea's 2024 regulations, which ban online sales and require plain packaging, align with Australia's approach and reflect a global trend toward stricter regulatory frameworks. These inconsistent standards limit economies of scale in product development, forcing multinationals to maintain region-specific SKUs, thereby increasing inventory costs and delaying the introduction of innovations to the market.
High production and operational costs
In 2024, the prices of propylene glycol and vegetable glycerin, which serve as the primary base liquids in e-cigarettes, surged by 18% and 22%, respectively. These price increases were primarily attributed to the volatility in petrochemical feedstocks and rising competition for these materials from the pharmaceutical and cosmetic sectors. The high upfront capital investment required for automated manufacturing lines, ranging between USD 8 million and USD 15 million, has created a significant barrier to entry. This has resulted in the consolidation of production in China, where manufacturers like Smoore and other contract producers achieve unit costs that are 30% to 40% lower than those of their Western competitors. Furthermore, tariffs and trade restrictions, including the U.S. Section 301 duties on Chinese electronics, are compelling companies to reconfigure their supply chains. These adjustments are eroding the cost advantages previously enjoyed by manufacturers and are also contributing to extended lead times, thereby impacting overall operational efficiency.
*Our forecasts treat driver/restraint impacts as directional, not additive. The impact forecasts reflect baseline growth, mix effects, and variable interactions.
Segment Analysis
By Product Type: Devices Dominate, Liquids Gain Share
E-Cigarette Devices accounted for 81.27% of the market share in 2025, driven by the growing popularity of disposable formats. These formats not only remove the need for separate e-liquid purchases but also appeal to convenience-focused consumers. However, the E-Liquid segment is expected to grow faster, with a projected CAGR of 6.82% through 2031. This growth is primarily attributed to increasing regulatory restrictions on single-use plastics and rising environmental concerns, which are encouraging a shift toward refillable systems. Disposable devices, which gained traction during the pandemic due to their perceived hygiene benefits and ease of use, now face significant challenges from bans in Australia and France, as well as proposed legislation in the UK. Meanwhile, non-disposable devices, such as pod systems and mod configurations, are regaining popularity among cost-conscious users due to the economic benefits of refillable formats, particularly when monthly usage exceeds 15 mL.
The division between device and liquid segments highlights strategic decisions regarding vertical integration and regulatory risks. Companies like JUUL and Vuse, which manage both hardware and consumables, can optimize nicotine delivery and flavor profiles. However, this also means they must address compliance requirements across multiple product categories. On the other hand, independent e-liquid manufacturers face fewer entry barriers but must navigate fragmented distribution networks and compete on price in a market dominated by commoditized flavor options. The introduction of nicotine salt formulations has standardized device technology, as most pod systems now deliver similar performance. As a result, differentiation has shifted toward brand equity and innovation in flavor offerings.


By Category: Closed Systems Lead, Open Formats Resurge
In 2025, Closed Vaping Systems accounted for 73.62% of the market share, highlighting consumer preference for plug-and-play convenience and manufacturers' efforts to integrate users into proprietary ecosystems. Meanwhile, Open Vaping Systems are expected to grow at a 6.97% CAGR through 2031, supported by enthusiast communities, cost-effective usage, and regulatory backing in markets permitting higher nicotine concentrations in refillable formats. Closed systems, such as JUUL, Vuse, and RELX, provide consistent nicotine delivery and reduce user error, but their proprietary pods, with gross margins ranging from 40% to 60%, often deter budget-conscious consumers. On the other hand, Open systems appeal to experienced vapers by enabling third-party e-liquid refills, offering customization, and delivering cost savings, with per-milliliter expenses lower than those of closed pods.
The competition between closed and open systems is influencing distribution strategies and regulatory approaches. Closed systems leverage brand recognition to dominate convenience retail, benefiting from impulse purchases. In contrast, open systems excel in specialty vape shops, where personalized consultations and aftermarket accessories enhance their appeal. Regulatory authorities increasingly favor closed systems due to their tamper-resistant designs and reduced risk of nicotine poisoning, a key factor in the FDA's approval of Vuse Alto and rejection of open-tank systems. However, closed systems face challenges from environmental regulations targeting single-use plastics. The EU's Single-Use Plastics Directive is driving manufacturers to explore biodegradable pod materials and implement take-back programs.
By End User: Women's Segment Accelerates
Men represented 65.37% of e-cigarette users in 2025. However, women are adopting e-cigarettes at a faster rate, with a 7.59% CAGR projected through 2031, the highest growth among all demographic groups. This growth is driven by product innovations such as sleeker designs, pastel color schemes, and fruit-flavored options, which contrast with the utilitarian designs of early vaping devices. Despite this, significant differences in flavor preferences persist: women favor berry, vanilla, and menthol flavors, while men prefer tobacco and mint. These differences create challenges for retailers, particularly in managing inventory under flavor restrictions.
In markets with advanced harm-reduction policies, such as the UK and Sweden, the gender gap in vaping adoption is closing more rapidly. Public health campaigns in these regions specifically target female smokers. Similarly, New Zealand's Smokefree 2025 initiative includes gender-focused messaging to address barriers like pregnancy-related cessation and social smoking habits. However, strict marketing regulations limit brands' ability to communicate these benefits, forcing them to rely on word-of-mouth and influencer marketing. Furthermore, the growing popularity of nicotine pouches, offering nicotine without vapor, poses a substitution risk for the women's segment. Brands like ZYN and Velo are leveraging this trend by offering discreet options that eliminate concerns about secondhand vapor.
By Distribution Channel: Online Gains Despite Regulatory Friction
In 2025, offline stores accounted for 71.28% of the distribution market, driven by the convenience of impulse purchases in retail and consumers' preference for tactile evaluations before trying new devices or flavors. However, online stores are anticipated to grow at a 7.48% CAGR through 2031. This growth is supported by subscription models, direct-to-consumer pricing, and the adoption of age-verification technologies that comply with regulatory standards. The PACT Act's 2024 implementation in the U.S. initially disrupted online sales by banning USPS shipments and requiring signature-on-delivery. Nevertheless, brands quickly adapted by partnering with UPS and FedEx, absorbing an additional USD 8-to-USD 12 per package to maintain their distribution channels. Additionally, online platforms leverage data collection to enhance product development and deliver personalized marketing, offering a competitive advantage over offline retailers, who would require significant IT investments to achieve similar results.
The online channel is increasingly divided between compliant platforms that enforce robust age verification and gray-market operators exploiting jurisdictional gaps. Legitimate e-commerce platforms now rely on third-party verification services like Veratad and Jumio, which validate identities by cross-referencing government databases and biometric selfies, adding USD 0.50 to USD 1.20 per transaction in costs. Subscription models, pioneered by JUUL and later adopted by Vuse and RELX, help reduce customer acquisition costs and improve customer lifetime value. Meanwhile, offline retail continues to dominate in emerging markets, where low credit card penetration and underdeveloped cash-on-delivery logistics provide a structural advantage. However, this advantage is expected to decline gradually as digital payment infrastructures advance.
Geography Analysis
Europe accounted for 31.74% of the global market share in 2025, supported by the European Union's Tobacco Products Directive. This directive established a unified regulatory framework, balancing harm reduction with youth prevention. The United Kingdom, Germany, and France lead regional consumption. The United Kingdom's National Health Service actively promotes vaping as a cessation tool, a policy that contrasts sharply with the Food and Drug Administration's more cautious stance. Sweden's near-elimination of smoking through the adoption of snus and vaping has prompted the European Commission to reconsider its skepticism toward reduced-risk products. However, member states retain authority over flavor restrictions and taxation. Reflecting environmental concerns, the United Kingdom proposed a ban on disposable vapes in 2024, driven by data showing that 20% of 16-to-17-year-olds had tried vaping. Italy and Spain, with high smoking prevalence and limited cessation infrastructure, present opportunities for brands capable of navigating fragmented distribution networks.
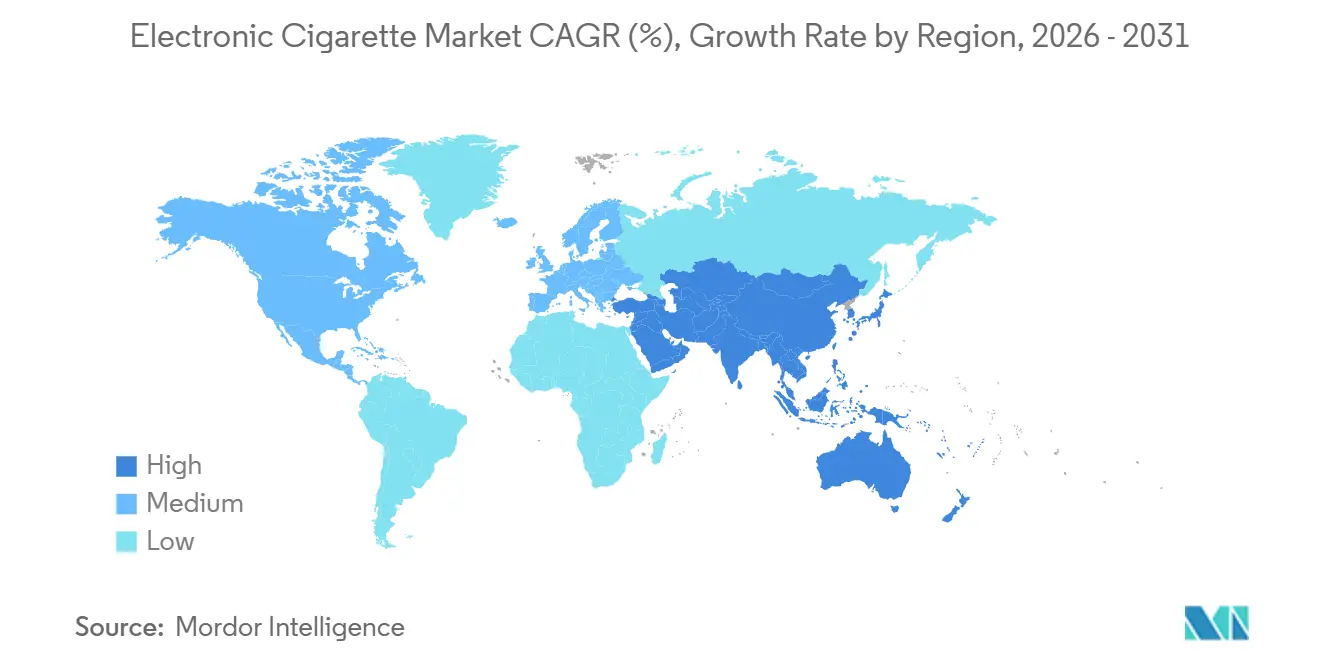
Asia-Pacific is projected to grow at a 7.39% CAGR through 2031, the fastest among major regions. This growth is driven by regulatory liberalization in Indonesia, evolving harm-reduction policies in Australia and New Zealand, and the scale of China's domestic market. In 2024, Indonesia introduced regulations that created a licensing framework for e-cigarette manufacturers and retailers, resolving years of regulatory uncertainty that had hindered formal market growth. Australia's prescription-only model, implemented in 2024, initially reduced retail sales but led to the emergence of a parallel market for nicotine pouches and heated tobacco products, which are not subject to the same restrictions. New Zealand's vaping regulations, which allow specialist retail but ban general retail and online sales, have fragmented distribution and increased compliance costs. However, the country's Smokefree 2025 goal continues to drive demand for cessation tools. China's domestic market remains opaque due to limited transparency from state-owned tobacco monopolies, positioning Chinese manufacturers as key players in the industry's supply chain. South Korea's 2024 flavor restrictions and online sales ban align with Australia's approach, signaling a regional trend toward restrictive frameworks that prioritize youth prevention over harm reduction.
North America, the Middle East and Africa, and South America follow distinct trajectories shaped by regulatory maturity and public health priorities. The United States remains the largest single-country market, but the Food and Drug Administration's stringent PMTA process has approved fewer than 30 products, creating a de facto oligopoly that limits consumer choice and innovation. In Canada, the federal framework permits vaping but delegates flavor restrictions and taxation to provinces, resulting in a patchwork of regulations that complicates national distribution strategies. South Africa's 2024 Control of Tobacco Products and Electronic Delivery Systems Act introduced age restrictions and advertising bans but stopped short of flavor prohibitions, creating a more permissive environment compared to Australia or the United Kingdom. Nigeria and Algeria, as emerging markets with minimal regulatory oversight, attract Chinese manufacturers seeking to offload products that cannot secure FDA or EU approval. South America's regulatory landscape remains underdeveloped, with Brazil maintaining a complete ban on e-cigarette sales while Argentina and Chile allow importation under tobacco control frameworks. This fragmentation limits multinational investment and favors gray-market operators.

Regulatory Landscape
The regulatory environment for e-cigarettes continues to diverge by region, with youth-prevention and retail-control requirements shaping enforcement and licensing. In the United Kingdom, the Tobacco and Vapes Act 2026 received Royal Assent on 29 April 2026, introducing a smoke-free generation sales restriction tied to birth year (born on or after 1 January 2009) and strengthening controls on vape advertising and sponsorship, alongside a new retail licensing framework.
The European Union is also actively reviewing its core rules. Following the end of the evaluation period for the Tobacco Products Directive (TPD) framework in 2025, the European Commission launched a targeted consultation in June 2026 on revising the TPD and the Tobacco Advertising Directive (TAD). Public-health bodies continue to influence policy direction, including a 2026 World Health Organization advocacy brief focused on preventing youth uptake and addressing nicotine addiction, reinforcing tighter access and stricter product presentation in multiple jurisdictions.
Competitive Landscape
The e-cigarette sector exhibits moderate fragmentation. Leading players in the e-cigarette sector, such as British American Tobacco Plc, Philip Morris International Inc, Japan Tobacco Group, and Imperial Brands Plc, hold a significant share of global revenues. However, they face margin pressures from vertically integrated Chinese manufacturers like Smoore International and rising competition from nicotine pouch disruptors. To address regulatory risks, these companies are prioritizing vertical integration, geographic expansion, and product portfolio diversification. Patent activity indicates a focus on nicotine salt formulations, ceramic heating elements, and biodegradable pod materials. Smoore International, for instance, holds 127 active patents in atomization technology as of 2024, solidifying its dominance in contract manufacturing. Additionally, prescription vaping markets in Australia and New Zealand offer high-margin opportunities for pharmaceutical-grade products, while emerging markets with less developed regulatory frameworks present further growth potential.
Key players in the e-cigarette market include Imperial Brands plc, Altria Group Inc., British American Tobacco PLC, Philip Morris International Inc., and Japan Tobacco Group. Over time, the market has shifted from an early-stage consolidation phase to a well-established and competitive environment. In this matured landscape, companies must prioritize regulatory compliance, technological advancements, and streamlined distribution processes to achieve success. The intensifying competition has led to a significant increase in investments toward research and development, as businesses aim to strengthen their market position and capture a larger share. Regulatory approval has become a crucial determinant of competitive advantage, with products approved by the Food and Drug Administration (FDA) securing premium market positioning and commanding higher pricing compared to unauthorized alternatives.
Technology remains the key competitive differentiator in the e-cigarette market. Established companies are allocating research and development budgets exceeding USD 50 million annually to develop closed-loop systems that enhance nicotine delivery and extend device lifespan. Japan Tobacco's Ploom X Advanced, launched in 2024, incorporates Bluetooth connectivity and usage analytics, generating data streams that support product improvements and enable personalized marketing within privacy regulations. Meanwhile, disruptors like Geekvape, VOOPOO, and Innokin are gaining traction in the open-system segment by offering modular designs and aftermarket ecosystems that appeal to enthusiast communities, avoiding the high costs of closed-system development. However, these disruptors face challenges from regulatory frameworks that favor tamper-resistant designs and proprietary consumables, potentially accelerating consolidation as compliance costs rise. The FDA's preference for closed-system products, as evidenced by its current authorizations, benefits established players with strong regulatory expertise. At the same time, environmental regulations targeting single-use plastics are creating opposing pressures that could drive renewed interest in open-system products.
E-Cigarette Industry Leaders
-
Altria Group Inc.
-
Philip Morris International Inc.
-
Japan Tobacco Group
-
Imperial Brands Plc
-
British American Tobacco Plc
- *Disclaimer: Major Players sorted in no particular order


Market Opportunities and Future Outlook
Regulatory change is creating whitespace for compliant players. In the United States, the FDA issued ENDS enforcement-priority guidance in May 2026, and in the same month the FDA authorized the first fruit-flavored e-cigarette products (mango and blueberry) for adult smokers. These steps underline the value of regulatory-grade evidence packages, quality systems that can support shifting enforcement, and age-gated commercialization models that remain workable under tighter scrutiny.
Supply chain redesign and manufacturing localization are emerging as actionable opportunities, driven by trade friction and product access constraints. In April 2026, Charlie's Holdings opened a US-based facility for filling disposable vapes with e-liquid to reduce exposure to disruption from China-linked manufacturing. In July 2026, ITM Semiconductor expanded e-cigarette production facilities in Indonesia, while China initiated measures in July 2026 to rein in e-cigarette manufacturing overcapacity. Together, these developments point to more diversified, compliant production footprints, alongside distribution that can support track-and-trace requirements.
Recent Industry Developments
- June 2026: Philip Morris International announced and launched the VEEV inPrime closed-system vaping device in South Korea as part of its smoke-free portfolio expansion. The launch extends PMI's closed-system footprint in a tightly regulated, innovation-driven market and supports regional scaling of proprietary device and consumables ecosystems.
- April 2026: Charlie's Holdings opened a US-based facility for filling disposable vapes with e-liquid to reduce exposure to disruption from China-linked manufacturing. The expansion strengthens supply chain resilience and improves time-to-market for disposable product lines across the United States.
- August 2024: Altria's NJOY received FDA authorizations for menthol e-vapor products in the United States, marking a major milestone for flavored product access under the PMTA framework. The authorization highlighted the regulatory-grade evidence package advantage and raised the bar for compliant menthol offerings.


Research Methodology Framework and Report Scope
Market Definition and Coverage
For this study, the market covers revenue generated from electronic nicotine delivery products, including vaping devices and the consumables used with them (refill liquids and pre-filled pods), sold for adult consumer use across geographies.
Scope exclusions: We exclude heat-not-burn tobacco sticks, cannabis vaping hardware, aftermarket spare parts, and therapeutic nicotine inhalers.
Segmentation Overview
-
By Product Type
-
E-Cigarette Device
- Disposable
- Non-Disposable
- E-Liquid
-
E-Cigarette Device
-
By Category
- Open Vaping Systems
- Closed Vaping Systems
-
By End User
- Men
- Women
-
By Distribution Channel
- Offline Stores
- Online Stores
-
By Geography
-
North America
- United States
- Canada
- Rest of North America
-
Europe
- United Kingdom
- Germany
- France
- Italy
- Spain
- Russia
- Sweden
- Romania
- Poland
- Netherlands
- Austria
- Portugal
- Greece
- Rest of Europe
-
Asia-Pacific
- Indonesia
- Australia
- New Zealand
- Rest of Asia-Pacific
-
Middle East and Africa
- South Africa
- Algeria
- Nigeria
- Rest of Middle East and Africa
- South America
-
North America
Data Sources, Market Sizing, and Validation
Desk Research
Desk research was used to build the starting structure for the model and to set realistic boundaries around what counts as an e-cigarette sale. Public health and population signals were taken from sources such as the World Health Organization, the US Centers for Disease Control and Prevention, and national health ministries that publish adult tobacco use and vaping prevalence indicators.
To anchor regulations and product pathways, we also reviewed sources such as the US Food and Drug Administration updates, regional regulator notices, and select peer-reviewed journals that track nicotine delivery and harm-reduction debates. Company filings, investor presentations, reputable press coverage, and association websites were then used to sense-check pricing moves, product launches, and channel shifts. Paid subscriptions for company financials and patent intelligence were used selectively where public disclosures were thin. These examples are not exhaustive, and additional sources were also used for data collection, validation, and clarification.
Primary Interviews and Surveys
Primary work focused on interviews and structured surveys with stakeholders across the value chain, such as device brand teams, e-liquid formulators, distributors, vape shop operators, and regulatory and public health experts. Because this is a global market, inputs were balanced across major demand regions so adoption, pricing, and compliance assumptions could be adjusted to local realities before final totals were locked.
Distribution of primary research fieldwork respondents
| Company type | Respondent position | Region |
|---|---|---|
| Top tier: 29% | CXOs: 16% | APAC: 42% |
| Mid tier: 55% | Functional/Unit leaders: 28% | EMEA: 31% |
| Smaller Players: 16% | Managers: 56% | Americas: 27% |
Market-Sizing & Forecasting
Sizing starts with a top-down demand pool build-up, where adult nicotine user populations and vaping prevalence are converted into an addressable user base, which is then translated into annual device turnover and consumables consumption. To keep the output grounded, the totals were corroborated with selective bottom-up approximations, such as sampled average selling price (ASP) by device format and typical consumption per user, followed by channel checks where data was available.
Key inputs used in the model include adult smoker base and switching rates, vaping prevalence by country, average e-liquid milliliters consumed per user, device replacement cycles, share of closed versus open systems, and observed ASP progression by category. When a country had limited data, proxy indicators from similar regulatory and income profiles were applied, and the assumption was later tested in interviews before being retained.
For forecasting, we used scenario analysis supported by trend-based smoothing on core drivers, since regulation and product authorization cycles can change demand patterns quickly. Growth paths were shaped by expected policy enforcement, retail access shifts between offline and online, product innovation cadence, and consumer price sensitivity, and then reviewed with experts to avoid overly aggressive curve shapes.
Data Validation & Update Cycle
Outputs are validated through triangulation, where prevalence-led demand totals are checked against independent signals like pricing ranges, device turnover logic, and qualitative channel feedback. If a country result looks out of line, the assumptions are re-opened and reviewed, and follow-up calls are triggered to confirm whether the variance is real or caused by a missing regulation or category mapping.
Before sign-off, the model and written conclusions go through multi-step analyst review so key definitions, currency conversions, and year labeling stay consistent. Reports are refreshed annually, and interim updates are done when material events occur, such as major rule changes, product authorization shifts, or tax actions that can move pricing and volumes. Right before delivery, a final pass is completed so clients receive the most current view that can be supported by the latest available information.
Mordor Intelligence's Global E Cigarettes Market Market Size Versus Other Published Estimates
Published market sizes for e-cigarettes often vary even when the topic name looks the same, since firms do not always count the same products, years, or revenue points. Differences also show up when one estimate leans more on shipment-style indicators while another leans more on user adoption signals and typical consumption.
The table shows a tight cluster around the mid-20s for 2025 in one estimate, but a higher 2025 value in another, which usually comes from what is included around adjacent nicotine categories and how service revenues are treated. In Mordor Intelligence's approach, the 2025 total is tied to factory gate revenues for vaping devices plus e-liquids and pods, with explicit exclusions like heat-not-burn sticks and cannabis vaping hardware, which can reduce scope versus broader nicotine or vape bundles.
Benchmark comparison
| Source | Market Size | Gaps in Research Methodology |
|---|---|---|
| Mordor Intelligence | USD 26.10 B (2025) | |
| Industry Publisher A | USD 26.00 B (2025) | Uses a broader product taxonomy that can group next-generation nicotine formats together, and it is less explicit about excluding heat-not-burn products, which can shift totals depending on local product mix assumptions. |
| Global Publisher B | USD 32.74 B (2025) | Defines an expanded e-cigarette and vape universe and also states inclusion of related services sold by creators, which can lift the measured value beyond device and consumables-only accounting. |
Taken together, the spread is explained by scope and accounting choices more than by arithmetic. When the product boundary, revenue point, and country-level adoption inputs are spelled out and then checked with expert feedback, the final number becomes easier to reproduce and to adjust when regulations or pricing conditions change.


Key Questions Answered in the Report
How large is the E-Cigarette market in 2026?
The E-Cigarette market size stood at USD 26.97 billion in 2026 and is on track to hit USD 36.65 billion by 2031.
What is the forecast CAGR for vapor products through 2031?
Global revenue is forecast to expand at a 6.33% CAGR over the 2026-2031 period.
Which region is expanding fastest in vaping adoption?
Asia-Pacific leads growth, projected at a 7.39% CAGR as Indonesia, Australia, and New Zealand evolve harm-reduction policies.
Are open or closed vaping systems gaining share?
Closed pods still lead, yet open systems are predicted to grow at a 6.97% CAGR because of lower per-use costs and customization.
Page last updated on:


 Your data is secure and never sold or shared.


