Waterway Transportation Software And Services Market Size and Share
Market Overview
| Study Period | 2019 - 2030 |
|---|---|
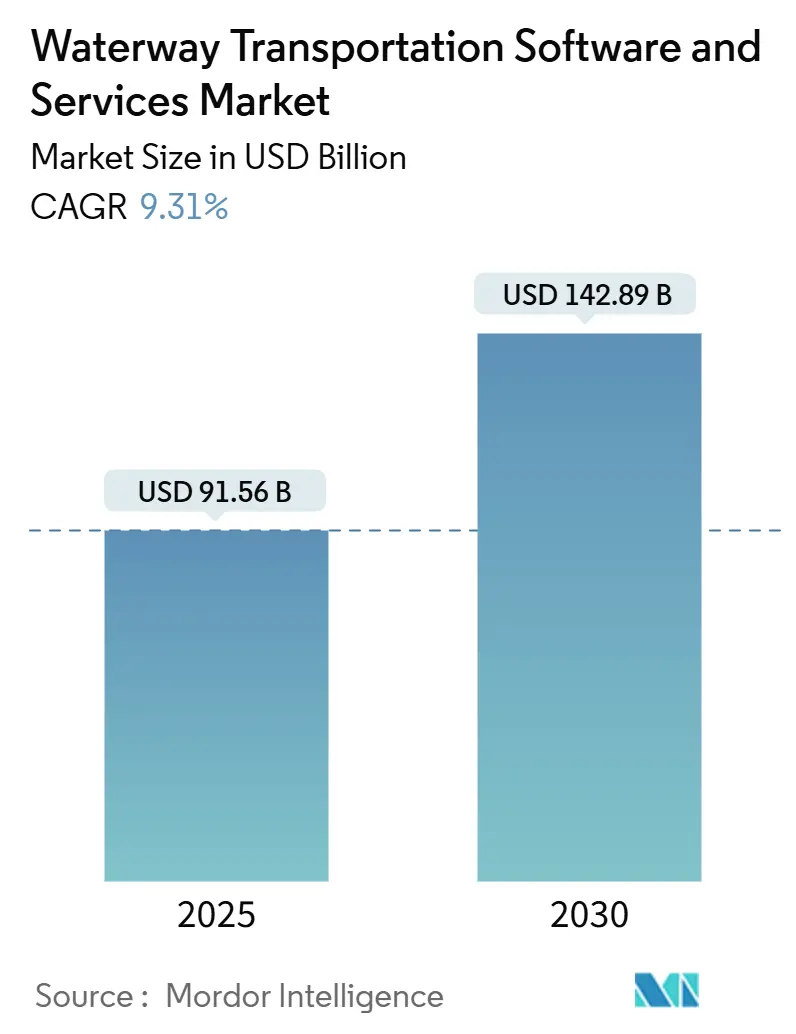
| Market Size (2025) | USD 91.56 Billion |
| Market Size (2030) | USD 142.89 Billion |
| Growth Rate (2025 - 2030) | 9.31% CAGR |
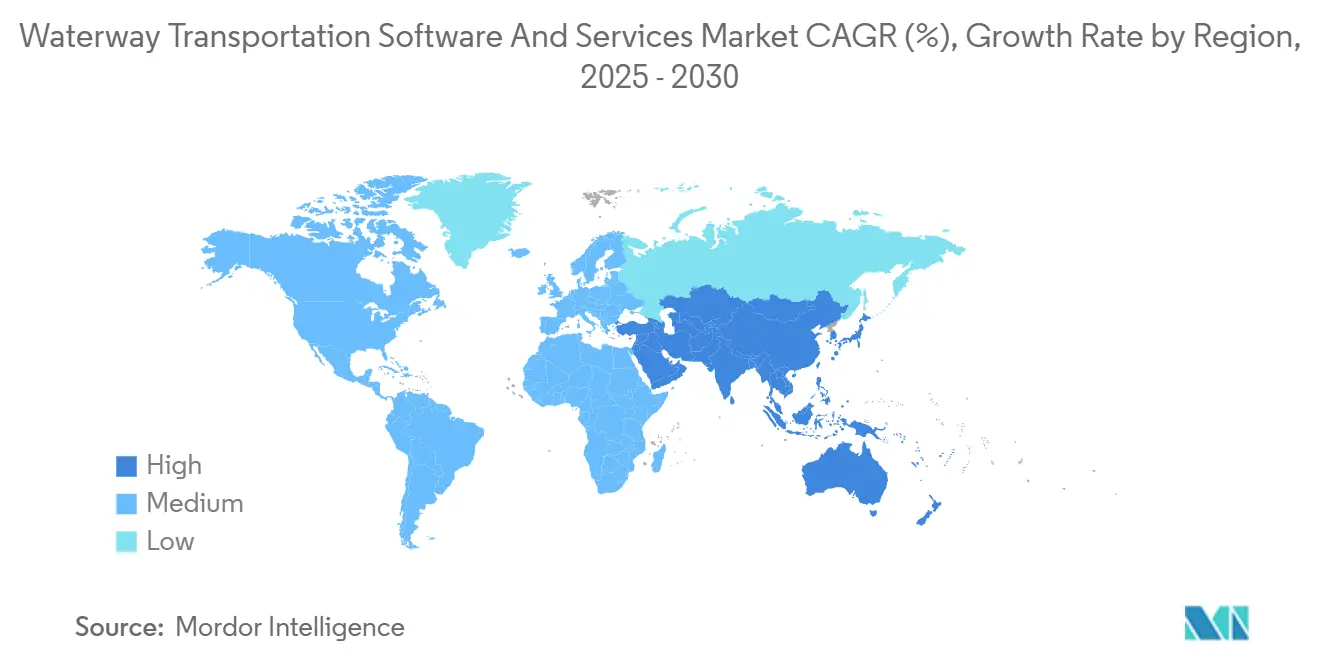
| Fastest Growing Market | Middle East |
| Largest Market | Asia Pacific |
| Market Concentration | Medium |
Major Players *Disclaimer: Major Players sorted in no particular order Image © Mordor Intelligence. Reuse requires attribution under CC BY 4.0. | |
Waterway Transportation Software And Services Market Analysis by Mordor Intelligence
The Waterway Transportation Software And Services Market size is estimated at USD 91.56 billion in 2025, and is expected to reach USD 142.89 billion by 2030, at a CAGR of 9.31% during the forecast period (2025-2030).
Container terminals, inland waterway operators, and offshore energy fleets are modernizing their vessel-tracking, cargo visibility, and emissions-monitoring processes, thereby increasing demand for cloud platforms, advanced analytics, and managed services. Cloud deployment already holds a 65.87% share, reflecting port authorities’ move away from capital-intensive data centers toward elastic architectures that ingest Automatic Identification System (AIS) data and support predictive maintenance. Analytics platforms are expanding at the fastest rate, aided by the International Maritime Organization’s Carbon Intensity Indicator rules, which require voyage-level emissions reporting. Regionally, Asia-Pacific leads spending with 36.32% thanks to China’s automated terminals and Japan’s remote-operation pilots, while the Middle East shows the quickest growth on the back of Saudi and United Arab Emirates digital-port programs. Competitive intensity is moderate, with enterprise resource planning giants cross-selling maritime modules and pure-play specialists defending terminal operating system leadership through multi-year port contracts.
Key Report Takeaways
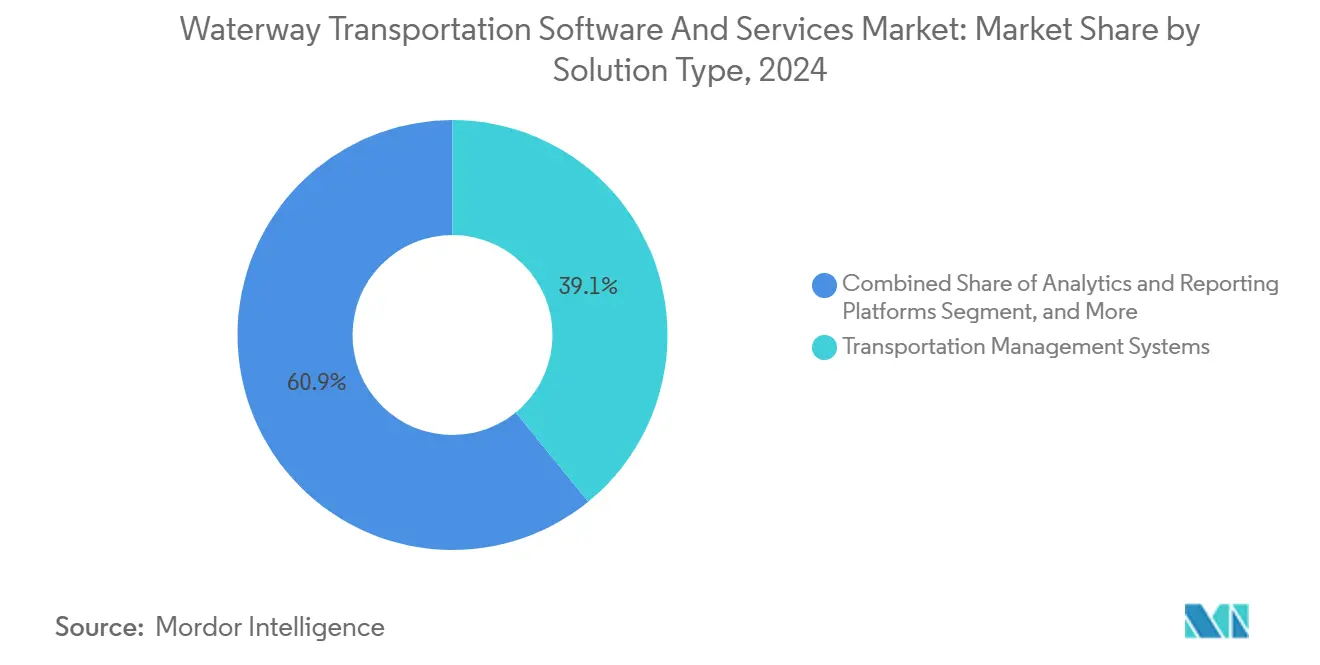
- By solution type, transportation management systems held 39.12% of the Waterway transportation software and services market size in 2024, while analytics and reporting platforms are forecast to post a 10.51% CAGR to 2030.
- By deployment mode, cloud platforms are expected to command a 65.87% of the Waterway transportation software and services market size in 2024; on-premises is expected to trail as cloud growth accelerates at a 9.67% CAGR through 2030.
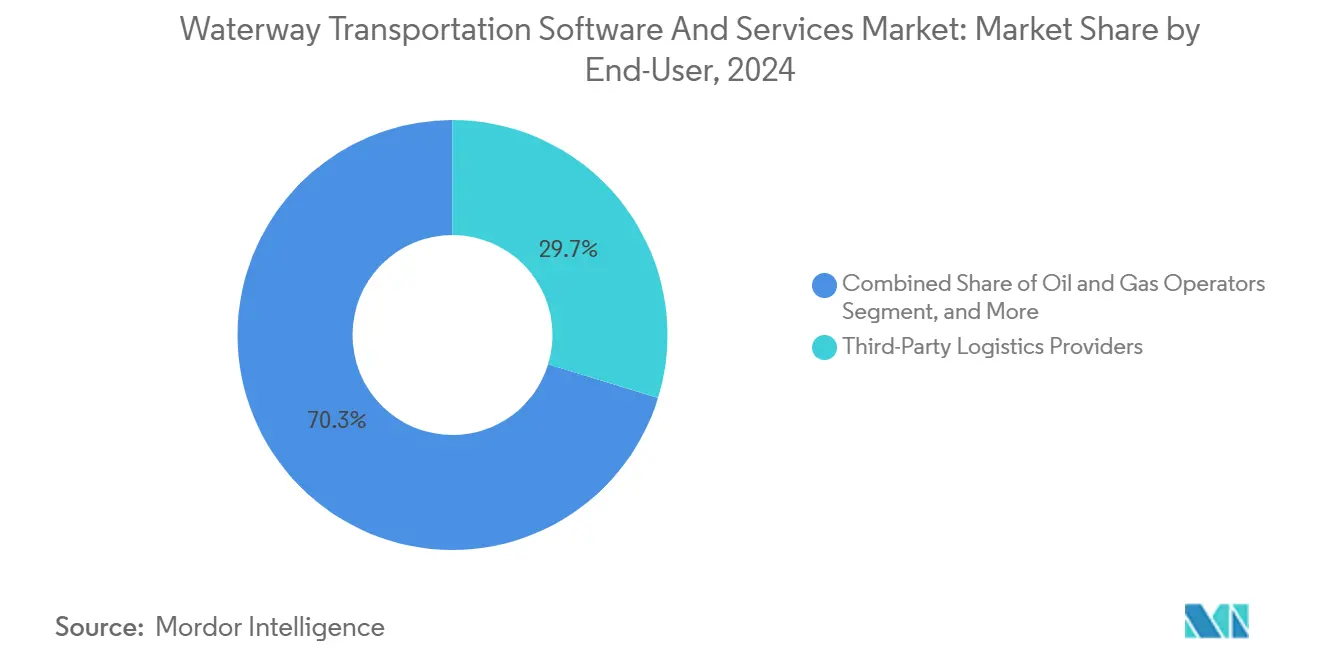
- By end-user, third-party logistics providers led with 29.73% of the Waterway transportation software and services market size in 2024, whereas oil and gas operators are projected to expand at a 10.57% CAGR between 2025 and 2030.
- By service type, managed services accounted for 29.47% of the Waterway transportation software and services market size in 2024 and are projected to grow at a 10.22% CAGR through 2030.
- By geography, the Asia-Pacific region generated 36.32% of the Waterway transportation software and services market size in 2024, while the Middle East is set to be the fastest-growing region, with a 10.39% CAGR through 2030.
Global Waterway Transportation Software And Services Market Trends and Insights
Drivers Impact Analysis*
| Driver | (~) % Impact on CAGR Forecast | Geographic Relevance | Impact Timeline |
|---|---|---|---|
| Growing Adoption of Cloud-Based Maritime Platforms | +1.8% | Global, concentrated in North America and Europe, accelerating in Asia-Pacific | Medium term (2-4 years) |
| Exponential Rise in Global Container Throughput | +2.1% | Asia-Pacific core, spill-over to Middle East and North America | Short term (≤ 2 years) |
| Tightening Environmental Compliance Mandates | +1.9% | Global, led by European Union and IMO frameworks | Long term (≥ 4 years) |
| Integration of IoT and Advanced Analytics in Fleets | +1.6% | North America and Europe early adopters, expanding to Asia-Pacific offshore operators | Medium term (2-4 years) |
| Emergence of Autonomous and Remote-Controlled Vessels | +1.2% | Norway, Japan, United Kingdom pilots, gradual global diffusion | Long term (≥ 4 years) |
| Increasing Digitalization of Inland Waterways | +0.9% | Europe, North America, China | Medium term (2-4 years) |
| Source: Mordor Intelligence | |||
Growing Adoption of Cloud-Based Maritime Platforms
Port authorities and shipping lines are moving vessel-tracking, cargo-visibility, and terminal-operating systems into the cloud to avoid capital expenditure on data centers and to enable real-time collaboration across dispersed partners. Maersk’s 2024 shift to 4G IoT connectivity now delivers 15-minute engine-performance updates that were impossible with legacy satellite links. CMA CGM’s alliance with Google Cloud analyzes 400,000 container moves a week, cutting berth dwell times by predicting congestion.[1]CMA CGM, “Google Cloud Partnership,” cma-cgm.com Elastic compute capacity also helps third-party logistics providers scale booking volumes seasonally without over-provisioning infrastructure. Although regulation is limited, ISO 27001 certification is becoming standard under European cyber-security directives, making compliance a de-facto market entry ticket.
Exponential Rise in Global Container Throughput
Major transshipment hubs exceed historic volume records, forcing adoption of automated gate systems, yard-management software, and vessel-scheduling algorithms. Shanghai processed 49 million TEUs in 2024, prompting PSA Singapore to deploy the CALISTA platform for live berth and crane allocation.[2]PSA International, “CALISTA Platform,” globalpsa.com Capacity expansion at Saudi Arabia’s King Abdullah Port included Navis N4 to orchestrate automated stacking cranes. Carriers such as ZIM now embed sensors in 100,000 refrigerated units, transmitting location and temperature every 30 minutes to support predictive rail-truck handoffs. The outcome is a surge in demand for analytics engines that simulate arrival sequences and reduce crane idle time.
Tightening Environmental Compliance Mandates
The IMO Carbon Intensity Indicator, effective since 2023, compels shipowners to hit annual efficiency targets through 2030, accelerating demand for voyage-optimization dashboards that evaluate route and hull condition.[3]International Maritime Organization, “Carbon Intensity Indicator,” imo.org In April 2025 the IMO approved a Net-Zero Framework mandating 20% well-to-wake greenhouse-gas reductions by 2030, a goal that pushes digital-twin adoption to model alternative fuels. The European Union’s FuelEU Maritime regulation, effective January 2025, imposes a 2% emissions-intensity cut at EU ports, climbing to 6% by 2030, and obligates container and passenger vessels to connect to shore power at berth. Eastern Pacific Shipping used DeepSea analytics across 50 vessels in 2024, saving 5% fuel by adjusting trim and load.
Integration of IoT and Advanced Analytics in Fleets
Engine, hull, and cargo sensors stream granular data to machine-learning models that predict failure and optimize maintenance. Kongsberg Digital’s Vessel Insight aggregates 20,000 shipboard data points, letting shore engineers catch anomalies early, a capability Wilhelmsen adopted fleet-wide in 2024. EXMAR applied Toqua’s AI to liquefied petroleum gas carriers, cutting fuel 4% by recommending speed changes. Edge gateways filter messages onboard, lowering satellite bandwidth costs 60%. These gains appeal particularly to offshore energy operators, where downtime can cost USD 500,000 per day.
Restraints Impact Analysis*
| Restraint | (~) % Impact on CAGR Forecast | Geographic Relevance | Impact Timeline |
|---|---|---|---|
| High Upfront Integration Costs for Legacy Ports | -1.4% | Global, acute in South America and Africa | Short term (≤ 2 years) |
| Cybersecurity Risks Across Maritime Supply Chains | -1.1% | Global, heightened in North America and Europe | Medium term (2-4 years) |
| Limited Broadband Connectivity in Remote Sea Routes | -0.8% | Remote ocean corridors, Arctic routes | Long term (≥ 4 years) |
| Shortage of Skilled Maritime IT Professionals | -0.7% | Global, especially Asia-Pacific and Middle East | Medium term (2-4 years) |
| Source: Mordor Intelligence | |||
High Upfront Integration Costs for Legacy Ports
Smaller terminals struggle to fund migration from decades-old on-premises systems to modern cloud platforms. A mid-size European terminal estimated EUR 8 million (USD 9 million) for Navis N4 licenses, consulting, and staff training, equal to 18 months of profit. African and South American facilities face similar hurdles as investment capital favors quay deepening over software. Vendor lock-in further discourages switching once initial integration is sunk. Phased rollouts can defer cost but fragment data flows and dilute efficiency benefits.
Cybersecurity Risks Across Maritime Supply Chains
Ransomware and phishing events have risen, exemplified by the January 2024 attack on DNV that disrupted ship-classification workflows. A breach at a single vendor can cascade across dozens of ports using the same software. IMO cyber-risk guidelines demand integration into safety-management systems by 2024, yet smaller operators still lack security teams. ISO 27001 certification, penetration tests, and cyber-liability insurance now add material cost to any new deployment.
*Our forecasts treat driver/restraint impacts as directional, not additive. The impact forecasts reflect baseline growth, mix effects, and variable interactions.
Segment Analysis
By Solution Type: Analytics Platforms Outpace Legacy Systems
Analytics and reporting platforms lead growth with a 10.51% CAGR, reflecting increased emissions-reporting obligations under IMO and EU frameworks. Transportation management systems still generate the largest share at 39.12% because freight forwarders demand multi-modal orchestration. Port and terminal software anchors automated crane scheduling in mega-ports, while vessel-tracking modules underpin offshore energy fleets’ digital twins. ZIM’s smart-container rollout shows freight security’s rising relevance. The waterway transportation software and service market size for analytics solutions is projected to expand rapidly as carriers seek voyage-level dashboards that satisfy regulators and investors.
Forecast momentum also favors AI-enabled platforms that model fuel burn, weather, and congestion. CMA CGM’s Google Cloud project processes 400,000 container moves weekly, trimming dwell times. Such projects illustrate why analytics will keep eroding share from legacy modules through 2030. In parallel, energy-management add-ons required for shore power compliance place additional upside on emissions analytics.


By Deployment Mode: Cloud Dominance Accelerates
Cloud deployment owns 65.87% of revenue and is growing at 9.67% per year, powered by elastic compute, real-time collaboration, and lower capital demands. Maersk’s 4G IoT upgrade highlights cloud’s ability to capture high-frequency telemetry. Kongsberg’s Vessel Insight further shows how cloud APIs enable cross-fleet diagnostics. Yet on-premises remains essential for defense agencies and data-sovereignty jurisdictions.
Costs also cap cloud adoption for smaller terminals; the waterway transportation software and service market share of on-premises therefore persists despite overall decline. Hybrid models, with sensitive data kept locally while analytics move to cloud, will bridge the gap until connectivity and cybersecurity concerns ease.
By End-User: Oil and Gas Operators Drive Fastest Expansion
Third-party logistics providers deliver the highest 2024 revenue at 29.73% by leveraging integrated visibility across rail, truck, and ocean. Oil and gas operators, however, will grow 10.57% annually as offshore tracking mandates and floating production digital twins proliferate. Predictive maintenance helps avoid USD 500,000-per-day rig standby fees.
Regulatory pressure applies to every segment, but capital-intensive energy fleets can justify larger budgets. Defense agencies maintain on-premises for sovereignty, while manufacturers integrate yard management to streamline landside bottlenecks. The waterway transportation software and service market size for offshore energy users is set to widen as new FPSO projects enter operation through 2030.
By Service Type: Managed Services Lead Growth
Managed services expand at 10.22% annually, ahead of consulting, maintenance, and training. Port operators outsource cybersecurity monitoring and platform administration to compensate for scarce maritime IT talent. After the DNV incident many terminals opted for 24-hour threat detection via third-party providers.
Consulting remains vital for multimillion-dollar terminal migrations, while maintenance contracts ensure patching and hotline support. Virtual-reality training is emerging to upskill crane operators before live deployment. Overall, managed services capture recurring revenue streams, strengthening vendor-operator partnerships and boosting the waterway transportation software and service market’s annuity profile.
Geography Analysis
Asia-Pacific contributed 36.32% of 2024 revenue, supported by China’s automated container hubs and Japan’s shore-based control centers. Shanghai’s 49 million TEUs necessitated PSA Singapore’s CALISTA real-time scheduling platform. The Nippon Foundation opened a Fleet Operation Center in 2024 to let engineers supervise multiple ships from shore, cutting crew costs. South Korean newbuilds now embed digital twins before steel cutting, positioning owners for analytics upgrades at delivery.
The Middle East will grow fastest at 10.39% as Saudi Vision 2030 injects USD 20 billion into port modernization, including Jeddah’s terminal-system refresh and NEOM’s greenfield smart port. Dubai-based DP World’s 2024 blockchain platform digitized bills of lading, cutting fraud and attracting 15 carriers within six months. Qatar and Oman follow with automated gate systems and berth algorithms.
North America and Europe show mature adoption, focusing on analytics and managed services. EU FuelEU Maritime rules push voyage-optimization uptake and shore-power modules. United States coast-guard programs mandate sovereign data hosting, slowing cloud rollouts yet spurring on-premises upgrades. South America and Africa lag due to integration-cost hurdles, exemplified by the EUR 8 million Navis project cited earlier. Nonetheless, inland waterway initiatives on the Rhine, Danube, and Mississippi signal a coming wave of barge-tracking modernization.

Competitive Landscape
Market concentration is moderate. ERP giants SAP and Oracle cross-sell maritime extensions to their manufacturing customer base, while pure-plays Navis and Tideworks defend terminal-operating-system incumbency via long contracts. Wärtsilä Voyage’s October 2024 acquisition of a predictive-maintenance startup broadened its Fleet Optimization suite. WiseTech Global extended its CargoWise platform to ocean modules, challenging incumbents on horizontal scope. Edge-computing patents filed by MAPS Messaging in 2024 highlight cost-saving differentiation in satellite bandwidth.
Disruptors such as DeepSea Technologies deliver AI-native performance optimization, proven by Eastern Pacific Shipping’s 5% fuel savings. DP World’s blockchain initiative shows platform plays that encompass shipping lines and forwarders alike. Competitive focus is shifting toward pre-integrated APIs, ISO 27001 credentials, and emissions-compliance analytics. Despite vendor variety, barriers such as legacy lock-in and capital intensity limit market fragmentation, keeping rivalry balanced and collaboration frequent for multi-vendor stack integrations.
Waterway Transportation Software And Services Industry Leaders
Oracle Corporation
SAP SE
Descartes Systems Group Inc.
Kongsberg Digital AS
Wärtsilä Voyage Limited
- *Disclaimer: Major Players sorted in no particular order

Recent Industry Developments
- October 2025: The International Maritime Organization formally adopts its Net-Zero Framework, setting a 20% well-to-wake greenhouse-gas cut by 2030 and a 70% reduction by 2040, spurring shipowners to intensify rollouts of voyage-optimization tools and digital twins that assess alternative-fuel use and propulsion efficiency across fleets.
- April 2025: The International Maritime Organization approves the Net-Zero Framework for eventual enforcement, creating binding emissions targets that will take effect in 2027 and accelerating demand for analytics platforms able to calculate voyage-level carbon intensity and generate compliance reports for flag-state inspectors.
- January 2025: The European Union’s FuelEU Maritime regulation comes into force, obliging vessels that call at EU ports to trim emissions intensity by 2% in 2025 and by 6% in 2030, while also requiring shore-power hookups for container and passenger ships, prompting European terminal operators to procure port energy-management systems and performance-monitoring software.
- January 2025: EU port authorities launch compliance programs for FuelEU Maritime, rolling out emissions-tracking software to monitor fuel consumption and shore-power usage, with the Rotterdam Port Authority deploying real-time carbon-intensity dashboards that link to terminal-operating systems to prioritize berthing for lower-emission vessels.


Global Waterway Transportation Software And Services Market Report Scope
The Waterway Transportation Software and Services Market Report is Segmented by Solution Type (Transportation Management Systems, Port and Terminal Operations Software, Vessel Tracking and Fleet Management, Warehouse and Yard Management, Freight Security and Monitoring, Analytics and Reporting Platforms), Deployment Mode (Cloud, and On-Premises), End-User (Third-Party Logistics Providers, Freight Forwarders, Port Authorities and Terminal Operators, Manufacturers and Industrial Shippers, Defense and Government Agencies, Oil and Gas Operators), Service Type (Consulting and Implementation, Managed Services, Maintenance and Support, Training and Education), and Geography (North America, Europe, Asia-Pacific, Middle East and Africa, South America). The Market Forecasts are Provided in Terms of Value (USD).
| Transportation Management Systems (TMS) |
| Port and Terminal Operations Software |
| Vessel Tracking and Fleet Management |
| Warehouse and Yard Management |
| Freight Security and Monitoring |
| Analytics and Reporting Platforms |
| Cloud |
| On-Premises |
| Third-Party Logistics Providers |
| Freight Forwarders |
| Port Authorities and Terminal Operators |
| Manufacturers and Industrial Shippers |
| Defense and Government Agencies |
| Oil and Gas Operators |
| Consulting and Implementation |
| Managed Services |
| Maintenance and Support |
| Training and Education |
| North America | United States | |
| Canada | ||
| Mexico | ||
| Europe | Germany | |
| United Kingdom | ||
| France | ||
| Russia | ||
| Rest of Europe | ||
| Asia-Pacific | China | |
| Japan | ||
| India | ||
| South Korea | ||
| Australia | ||
| Rest of Asia-Pacific | ||
| Middle East and Africa | Middle East | Saudi Arabia |
| United Arab Emirates | ||
| Rest of Middle East | ||
| Africa | South Africa | |
| Egypt | ||
| Rest of Africa | ||
| South America | Brazil | |
| Argentina | ||
| Rest of South America | ||
| By Solution Type | Transportation Management Systems (TMS) | ||
| Port and Terminal Operations Software | |||
| Vessel Tracking and Fleet Management | |||
| Warehouse and Yard Management | |||
| Freight Security and Monitoring | |||
| Analytics and Reporting Platforms | |||
| By Deployment Mode | Cloud | ||
| On-Premises | |||
| By End-User | Third-Party Logistics Providers | ||
| Freight Forwarders | |||
| Port Authorities and Terminal Operators | |||
| Manufacturers and Industrial Shippers | |||
| Defense and Government Agencies | |||
| Oil and Gas Operators | |||
| By Service Type | Consulting and Implementation | ||
| Managed Services | |||
| Maintenance and Support | |||
| Training and Education | |||
| By Geography | North America | United States | |
| Canada | |||
| Mexico | |||
| Europe | Germany | ||
| United Kingdom | |||
| France | |||
| Russia | |||
| Rest of Europe | |||
| Asia-Pacific | China | ||
| Japan | |||
| India | |||
| South Korea | |||
| Australia | |||
| Rest of Asia-Pacific | |||
| Middle East and Africa | Middle East | Saudi Arabia | |
| United Arab Emirates | |||
| Rest of Middle East | |||
| Africa | South Africa | ||
| Egypt | |||
| Rest of Africa | |||
| South America | Brazil | ||
| Argentina | |||
| Rest of South America | |||


Key Questions Answered in the Report
How fast is the waterway transportation software market expected to grow to 2030?
It is projected to expand from USD 91.56 billion in 2025 to USD 142.89 billion by 2030, reflecting a 9.31% CAGR.
Which deployment mode dominates spending?
Cloud platforms hold 65.87% of 2024 revenue and are forecast to rise at a 9.67% CAGR through 2030.
What segment records the highest market share today?
Transportation management systems lead solution revenue with 39.12% in 2024.
Which end-user group will be the fastest-growing?
Oil and gas operators are set to grow at a 10.57% CAGR, driven by offshore vessel tracking mandates.
Why are managed services gaining momentum?
Ports and shipping lines outsource cybersecurity monitoring and platform management, pushing managed services to a 10.22% CAGR through 2030.
Which region is expanding most rapidly?
The Middle East, powered by Saudi and United Arab Emirates digital-port projects, is expected to grow at a 10.39% CAGR to 2030.
Page last updated on:


