
Wastewater Treatment Services Market Size and Share
Market Overview
| Study Period | 2021 - 2031 |
|---|---|
| Market Size (2026) | USD 72.64 Billion |
| Market Size (2031) | USD 98.74 Billion |
| Growth Rate (2026 - 2031) | 6.33 % |
| Fastest Growing Market | Asia-Pacific |
| Largest Market | Asia-Pacific |
| Market Concentration | Medium |
Major Players *Disclaimer: Major Players sorted in no particular order Image © Mordor Intelligence. Reuse requires attribution under CC BY 4.0. | |
Wastewater Treatment Services Market Analysis by Mordor Intelligence
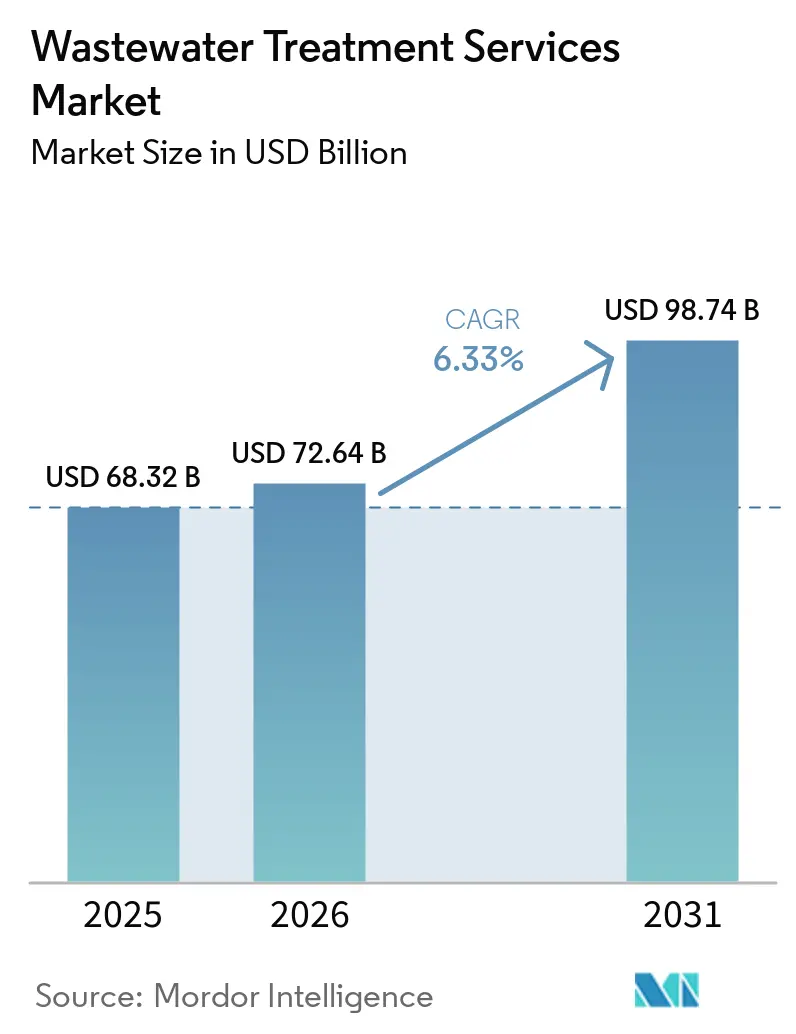
The Wastewater Treatment Services Market size was valued at USD 68.32 billion in 2025 and is estimated to grow from USD 72.64 billion in 2026 to reach USD 98.74 billion by 2031, at a CAGR of 6.33% during the forecast period (2026-2031). The wastewater treatment services market is supported by compliance work under the European Union Urban Wastewater Treatment Directive and by tighter industrial discharge requirements in the United States. These requirements make treatment upgrades and operating support necessary for utilities and industrial sites, rather than discretionary purchases. Water reuse is also moving closer to core production activity at water-intensive facilities, which raises the value of treatment services that can meet demanding water-quality requirements. Providers that can design, install, operate, and maintain a system under one contract are better positioned to offer clear accountability across the asset life cycle. Capital constraints, uncertainty over per- and polyfluoroalkyl substances (PFAS) liability, and shortages of certified operators may delay projects in some locations, but they also increase the value of experienced service providers.
Key Report Takeaways
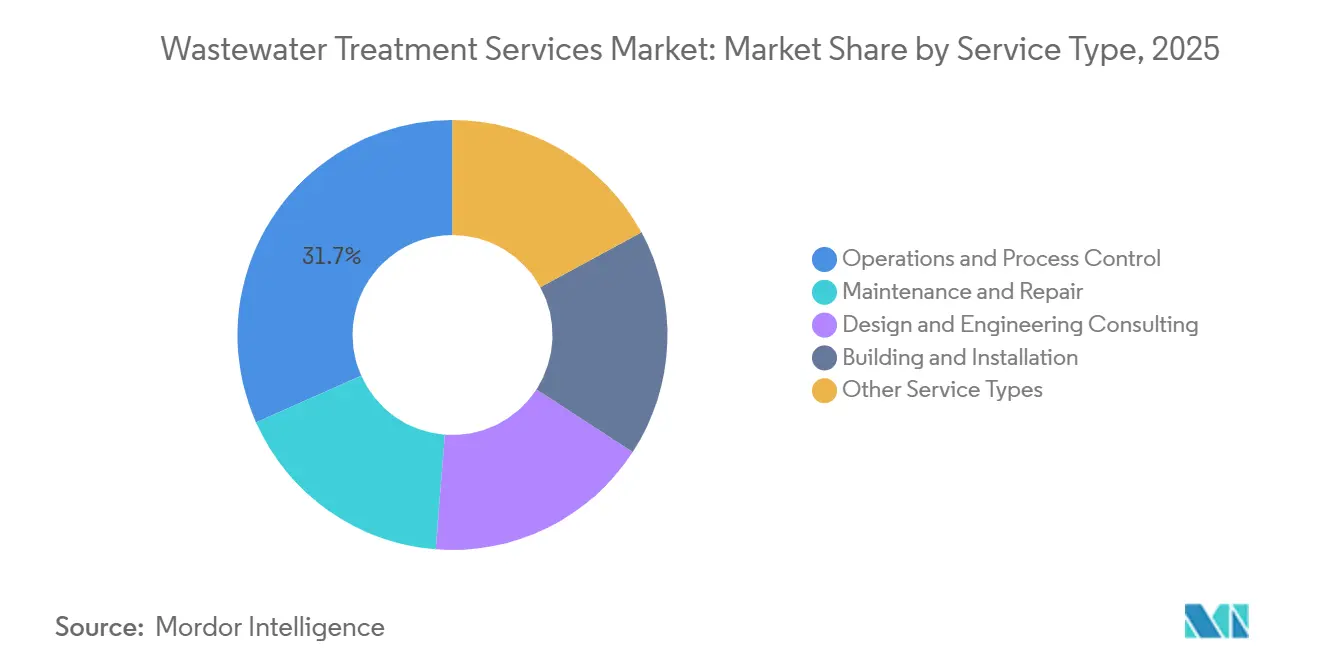
- By service type, operations and process control held 31.67% of the wastewater treatment services market share in 2025, while maintenance and repair is projected to advance at a 6.96% CAGR through 2031.
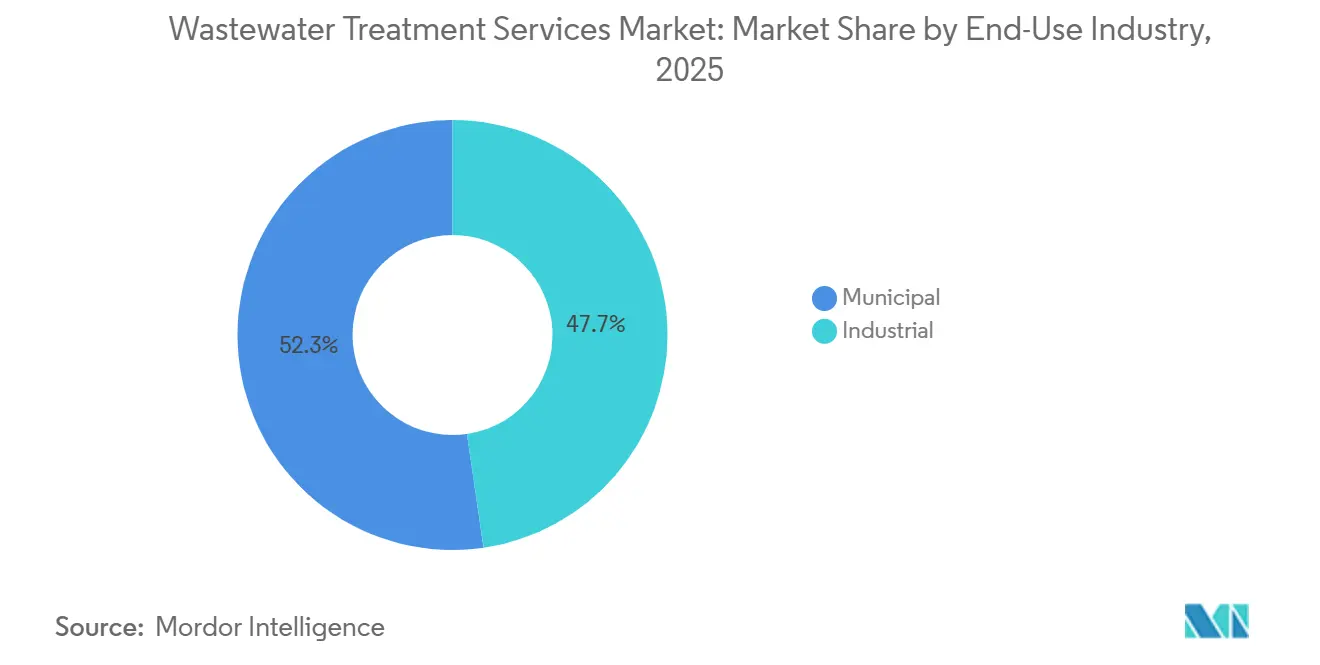
- By end-use industry, municipal held 52.31% of the wastewater treatment services market share in 2025, while industrial is projected to advance at a 7.34% CAGR through 2031.
- By geography, Asia-Pacific held 38.52% of the wastewater treatment services market share in 2025 and is projected to advance at a 7.02% CAGR through 2031.
Note: Market size and forecast figures in this report are generated using Mordor Intelligence’s proprietary estimation framework, updated with the latest available data and insights as of January 2026.
Global Wastewater Treatment Services Market Trends and Insights
Drivers Impact Analysis*
| Driver | (~) % Impact on CAGR Forecast | Geographic Relevance | Impact Timeline |
|---|---|---|---|
| Stringent Effluent-Discharge and Water-Quality Regulation | +2.1% | Global, near-term concentration in EU and North America | Medium term (2–4 years) |
| Water Reuse and Circular-Water Investment | +1.5% | APAC core, spillover to MEA and North America | Long term (≥ 4 years) |
| Industrial Expansion in Water-Intensive Sectors | +1.1% | APAC core (China, South Korea, India), spill-over to North America | Short term (≤ 2 years) |
| Aging Treatment Assets and Mandatory Upgrades | +0.9% | North America and EU | Medium term (2–4 years) |
| AI-Enabled Process Control and Predictive Maintenance | +0.7% | Global, early adoption in North America, EU, and APAC | Long term (≥ 4 years) |
| Source: Mordor Intelligence | |||
Stringent Effluent-Discharge and Water-Quality Regulation
The wastewater treatment services market gains a stable source of demand when discharge rules require utilities to upgrade treatment systems. The revised European Union Urban Wastewater Treatment Directive covers agglomerations of 1,000 population equivalents and sets staged requirements for secondary, tertiary, and quaternary treatment[1]. The framework assigns part of the advanced-treatment funding burden to pharmaceutical and cosmetics producers through extended producer responsibility. Member states will move from reporting under the prior framework to reporting under the new directive in 2028, which supports early planning for operating and upgrade contracts. In the United States, the Steam Electric Power Generating Effluent Limitations Guidelines set another layer of wastewater compliance for power-sector sites and connected public treatment systems. These requirements support the wastewater treatment services market and favor providers that can document compliance performance and manage complex treatment processes over long contract periods.
Water Reuse and Circular-Water Investment
Water reuse is widening the role of wastewater treatment from disposal management to supply security. The World Bank stated that reuse could increase eightfold by 2040 to 430 million cubic meters per day, with up to USD 340 billion of investment required to reach that scale. The wastewater treatment services market, therefore, has opportunities in systems that produce treated water for municipal, industrial, and high-purity applications. Reuse systems can create longer service engagements because water quality must be maintained continuously after a plant is commissioned. Providers with membrane operations, monitoring, and operator training capabilities can, therefore, compete on reliability as well as treatment capacity.
Industrial Expansion in Water-Intensive Sectors
Industrial growth is increasing demand for services that handle complex wastewater streams and maintain high uptime. South Korea’s Honam semiconductor cluster is treating recycled wastewater as a primary water source and plans to route 200,000 metric tons per day of treated municipal effluent to chip-production facilities. The wastewater treatment services market benefits when semiconductor, chemical, pharmaceutical, food and beverage, and power facilities require specialized treatment rather than standard municipal processes. Micron’s planned facility in Onondaga County required an industrial wastewater treatment plant with projected costs exceeding USD 1 billion. Such projects support the wastewater treatment services market by bringing municipal-scale infrastructure requirements into private industrial investment programs. This supports performance-based contracts that link providers to treatment quality, equipment availability, and operating outcomes.
Aging Treatment Assets and Mandatory Upgrades
Aging networks and treatment facilities require regular rehabilitation, maintenance, and operating support. The wastewater treatment services market benefits when asset owners choose life-extension work instead of replacing facilities outright. Pennsylvania American Water invested USD 722 million in water and wastewater system improvements in 2025. Predictive maintenance can help operators identify equipment faults before they affect compliance or plant availability. A 2025 study reported more than 94% fault-detection accuracy for a hybrid explainable artificial intelligence framework applied to wastewater aeration systems. These tools can strengthen maintenance contracts when they are paired with clear operating responsibilities and verified service levels.
Restraints Impact Analysis*
| Restraint | (~) % Impact on CAGR Forecast | Geographic Relevance | Impact Timeline |
|---|---|---|---|
| High Capital and Operating Cost of Advanced Treatment | -0.9% | Global, most acute in South/Southeast Asia and MEA | Short term (≤ 2 years) |
| Shortage of Skilled Operations and Maintenance Personnel | -0.6% | North America and EU; emerging pressures in APAC | Medium term (2–4 years) |
| PFAS and Micropollutant Liability Allocation Uncertainty | -0.4% | North America, with regulatory spillover to EU | Short to medium term (2–4 years) |
| Source: Mordor Intelligence | |||
High Capital and Operating Cost of Advanced Treatment
Advanced treatment systems can require more capital and operating expenditure than smaller utilities can fund. Membrane bioreactors, advanced oxidation processes, and PFAS treatment trains can be difficult to finance for smaller municipalities and developing-country utilities. A 10,000 m³ per day industrial reverse osmosis reuse plant requires USD 8 million to USD 12 million upfront, while membrane replacement adds USD 1.5 million to USD 2 million every 3 to 5 years. Aeration can account for 50% to 60% of a treatment plant’s energy budget, which makes operating costs difficult to reduce without better controls. The European Union directive includes a derogation provision where investment would be excessively onerous, recognizing that some communities face real funding constraints. The wastewater treatment services market may, therefore, develop unevenly, with well-funded operators moving faster while other asset owners defer upgrades and build future remediation demand.
PFAS and Micropollutant Liability Allocation Uncertainty
PFAS and micropollutant requirements can create uncertainty about which parties should carry treatment and remediation costs. The European Union framework supports advanced micropollutant removal at larger plants and uses extended producer responsibility to direct part of the funding burden toward pharmaceuticals and cosmetics producers. In the United States, the U.S. Environmental Protection Agency continues to address PFAS pollution through enforcement and relief measures, showing the financial consequences that can follow contamination[2]. Wastewater utilities need clarity on their responsibilities when they receive PFAS-containing flows and manage residuals. Until that allocation is settled, some owners may delay investments or favor treatment options that can be adapted as requirements change. The wastewater treatment services market can still gain work from investigations, monitoring, and treatment upgrades, but contract design must address liability and performance responsibilities carefully.
*Our forecasts treat driver/restraint impacts as directional, not additive. The impact forecasts reflect baseline growth, mix effects, and variable interactions.
Segment Analysis
By Service Type: Operations and Process Control Supports Contract Continuity
Operations and process control held 31.67% of the wastewater treatment services market share in 2025. This position reflected the need for continuous operation, certified staffing, and dependable compliance management after a facility is handed to an operator. Changing an operating provider can introduce technical and regulatory risks, especially at plants with established process settings and experienced site teams. Building and installation, along with design and engineering consulting, support recurring operations revenue because early project involvement can create familiarity with the facility. A provider that designs and commissions a treatment system can be well placed to manage it after startup. The wastewater treatment services industry consequently rewards companies that can connect project delivery with long-term operations and maintenance.
Maintenance and repair is projected to advance at a 6.96% CAGR through 2031. Aging assets increase demand for inspection, repair, replacement planning, and equipment reliability work. Predictive maintenance can improve the value of these contracts when it identifies faults before they affect treatment performance. A 2025 study found that an explainable artificial intelligence framework achieved more than 94% fault-detection accuracy for wastewater aeration systems. Other service types, including sludge management and digital monitoring, provide additional service opportunities that complement core operations work. Providers can use performance measures to show the operational value of maintenance instead of competing only on labor cost.

By End-Use Industry: Municipal Demand Remains Broad While Industrial Demand Accelerates
The municipal segment held 52.31% of the wastewater treatment services market share in 2025. Municipal demand comes from universal wastewater generation, public service obligations, and long-duration infrastructure programs. Regulatory standards give public operators a continuing need for engineering, operations, maintenance, and upgrade support. Municipal customers also require experienced partners when treatment processes become more complex or when local staffing is constrained. The segment provides stable contract opportunities because facilities must remain in operation across economic cycles. This base gives the wastewater treatment services industry a recurring need for providers that can maintain compliance and service continuity.
The industrial segment is projected to advance at a 7.34% CAGR through 2031. Chemical and pharmaceutical, oil and gas, and power generation facilities require treatment systems that can manage demanding contaminants and discharge conditions. Food and beverage and pulp and paper facilities add recurring treatment demand through large process-water volumes and corporate water-management commitments. Veolia announced USD 750 million in new industrial contracts in May 2025, including a USD 550 million agreement with a US Midwest microelectronics facility. Managed service contracts can appeal to industrial customers because they bring operational accountability and measurable treatment performance. These contracts may also include process controls that reduce energy and chemical consumption while supporting discharge compliance.
Geography Analysis
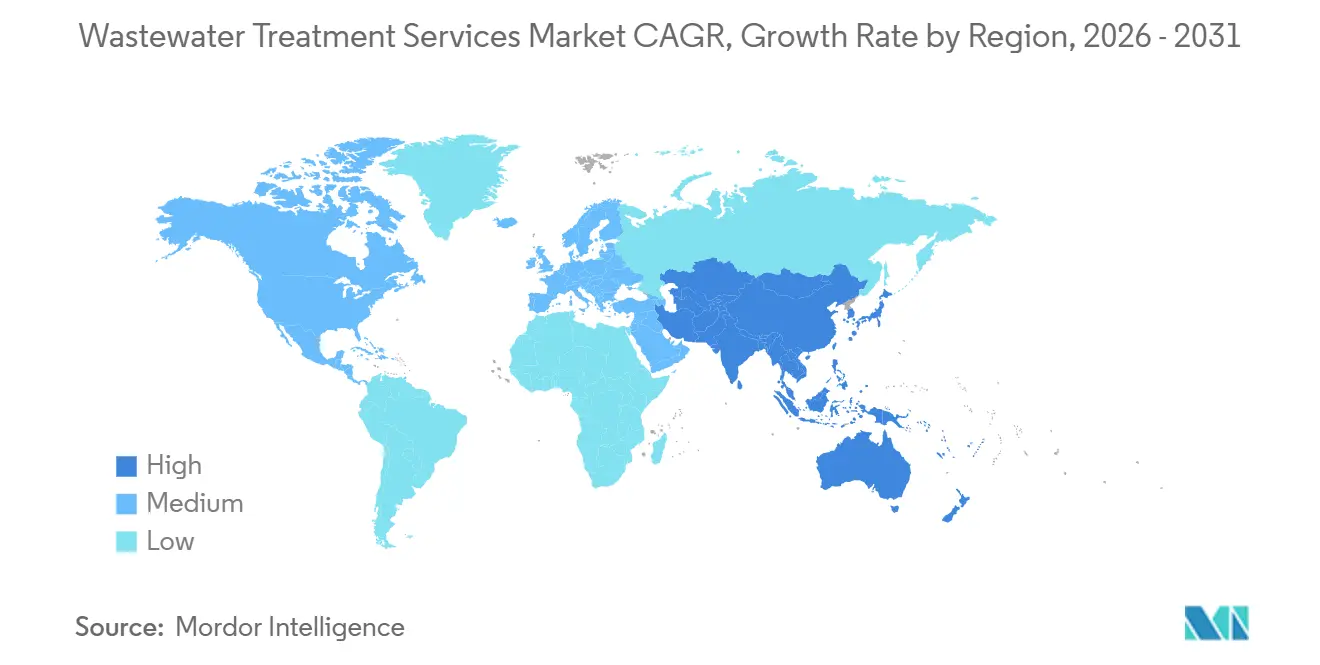
Asia-Pacific accounted for 38.52% of the wastewater treatment services market share in 2025 and is projected to grow at a 7.02% CAGR through 2031. China has built more than 10,000 wastewater treatment plants with a daily capacity exceeding 200 million cubic meters. India’s Namami Gange Mission targets 7,000 Million Liters per Day (MLD) of sewage treatment capacity by December 2026 through 200 sanctioned projects. South Korea is developing advanced reuse infrastructure to supply semiconductor manufacturing. Construction began in September 2026 on a dedicated pipeline that will supply 310,000 metric tons of water per day from Paldang Dam to the Yongin complex. Vietnam and the Philippines are also working to close the gap between industrial output and treatment capacity.
North America remains a large service base because asset renewal and compliance work are ongoing needs. Federal financing supports community water and wastewater systems and helps convert infrastructure plans into service opportunities. Pennsylvania American Water’s USD 722 million investment in 2025 showed the scale of private utility work in the region. Canada and Mexico add demand through population needs and infrastructure gaps.
Europe’s wastewater treatment services market size is supported by a compliance schedule that extends through 2045. The revised directive creates demand for tertiary treatment, micropollutant removal, and improved energy performance at relevant facilities. Nordic countries and Germany focus on energy-neutral plant upgrades, while Central and Eastern Europe face larger legacy infrastructure gaps. The Middle East and Africa region is increasingly shaped by water scarcity and reuse requirements. South America offers long-duration concession opportunities as Brazil’s sanitation framework supports private participation. Together, these regional patterns create different needs for providers, from advanced treatment in mature systems to new capacity and operating support in developing systems.
Competitive Landscape
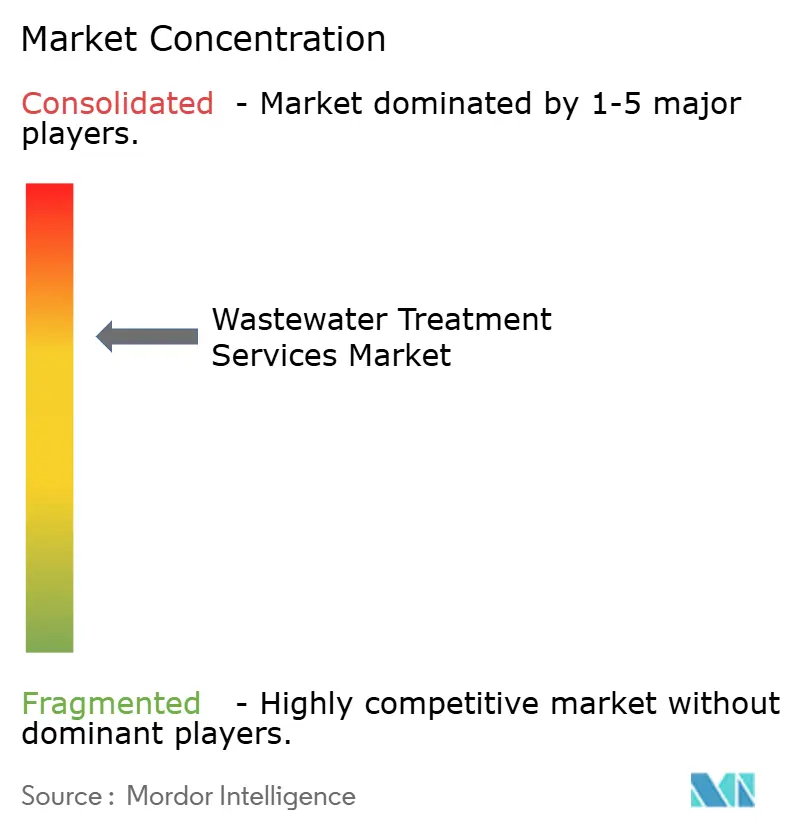
The wastewater treatment services market is moderately concentrated, with the top five players including Veolia, Xylem, Ecolab Inc., Thermax Limited, and WABAG. The wastewater treatment services market favors firms that can integrate design, construction, operations, and maintenance within one delivery model. This approach gives customers a single operating partner across the asset life cycle. It is particularly relevant for municipal concessions and industrial managed-service contracts that need clear performance accountability.
Veolia acquired the remaining 30% stake in its Water Technologies and Solutions subsidiary for USD 1.75 billion in May 2025. This move strengthened its ability to provide integrated water technology and services for industrial customers. Jacobs was selected in September 2026 for a 5.5-year operations and maintenance contract covering 4 wastewater treatment facilities for the Oklahoma City Water Utilities Trust. The work includes digital asset management and data-informed capital planning, which shows how operations contracts are expanding beyond day-to-day plant management.
Specialty chemistry suppliers also compete by combining treatment chemicals with recurring performance support. Kemira Oyj completed its first full-scale U.S. trial of KemConnect DEX at Capital Region Water’s Harrisburg facility in March 2026. The solution received U.S. Environmental Protection Agency registration for the core ingredient in May 2025 and Pest Management Regulatory Agency registration in March 2026. DuPont selected MemCor membrane bioreactor technology for the Riverstone Water Resource Recovery Facility upgrade in Sydney in June 2026. These examples show that technology suppliers can build a stronger service role when their products are paired with site-specific performance, operational support, and long-term asset needs.
Wastewater Treatment Services Industry Leaders
-
Veolia
-
Xylem
-
Ecolab Inc.
-
Thermax Limited
-
WABAG
- *Disclaimer: Major Players sorted in no particular order
Recent Industry Developments
- September 2026: WABAG secured a contract from Reliance Industries to develop an effluent treatment plant at the Dhirubhai Ambani Green Energy Giga Complex in Jamnagar. The project includes chemical and biological treatment, sludge treatment, and commissioning services, supporting demand for integrated wastewater treatment services in large industrial facilities.
- July 2026: Aquatech agreed to acquire METICHEM to expand industrial water treatment chemicals and operations and maintenance services across the Middle East, North Africa, and Southeast Asia. The transaction strengthens demand for outsourced wastewater treatment, plant operations, maintenance, and technical services across industrial and municipal customers.
Global Wastewater Treatment Services Market Report Scope
Wastewater treatment services encompass specialized activities that support the operation, development, installation, and upkeep of systems used to treat wastewater. These services help maintain treatment performance, operational reliability, regulatory compliance, and efficient management of wastewater infrastructure.
The Wastewater Treatment Services Market is segmented by service type, end-use industry, and geography. By service type, the market is segmented into operations and process control, design and engineering consulting, building and installation, maintenance and repair, and other service types. By end-use industry, the market is segmented into municipal and industrial, with industrial further segmented into chemical and pharmaceutical, oil and gas, food and beverage, pulp and paper, metal and mining, power generation, and other industrial industries. The report also covers the market size and forecasts for wastewater treatment services in 16 countries across major regions. For each segment, the market sizing and forecasts have been done on the basis of value (USD).
| Operations and Process Control |
| Design and Engineering Consulting |
| Building and Installation |
| Maintenance and Repair |
| Other Service Types |
| Municipal | |
| Industrial | Chemical and Pharmaceutical |
| Oil and Gas | |
| Food and Beverage | |
| Pulp and Paper | |
| Metal and Mining | |
| Power Generation | |
| Other Industrial Industries |
| Asia-Pacific | China |
| India | |
| Japan | |
| South Korea | |
| ASEAN Countries | |
| Rest of Asia-Pacific | |
| North America | United States |
| Canada | |
| Mexico | |
| Europe | Germany |
| United Kingdom | |
| France | |
| Italy | |
| NORDIC Countries | |
| Russia | |
| Rest of Europe | |
| South America | Brazil |
| Argentina | |
| Rest of South America | |
| Middle East and Africa | Saudi Arabia |
| South Africa | |
| Rest of Middle East and Africa |
| By Service Type | Operations and Process Control | |
| Design and Engineering Consulting | ||
| Building and Installation | ||
| Maintenance and Repair | ||
| Other Service Types | ||
| By End-Use Industry | Municipal | |
| Industrial | Chemical and Pharmaceutical | |
| Oil and Gas | ||
| Food and Beverage | ||
| Pulp and Paper | ||
| Metal and Mining | ||
| Power Generation | ||
| Other Industrial Industries | ||
| By Geography | Asia-Pacific | China |
| India | ||
| Japan | ||
| South Korea | ||
| ASEAN Countries | ||
| Rest of Asia-Pacific | ||
| North America | United States | |
| Canada | ||
| Mexico | ||
| Europe | Germany | |
| United Kingdom | ||
| France | ||
| Italy | ||
| NORDIC Countries | ||
| Russia | ||
| Rest of Europe | ||
| South America | Brazil | |
| Argentina | ||
| Rest of South America | ||
| Middle East and Africa | Saudi Arabia | |
| South Africa | ||
| Rest of Middle East and Africa | ||
Key Questions Answered in the Report
What is the size of the wastewater treatment services market?
The wastewater treatment services market stands at USD 72.64 billion in 2026 and is projected to reach USD 98.74 billion by 2031.
What is driving demand for wastewater treatment services?
Regulatory upgrades, water reuse, industrial expansion, aging assets, and digital process control are increasing the demand for specialized services.
Which service type held the largest market share in 2025?
Operations and process control led with a 31.67% share in 2025 because customers needed continuous treatment performance and compliance support.
Which end-use industry is projected to advance fastest through 2031?
Industrial is projected to advance at a 7.34% CAGR through 2031, supported by complex wastewater requirements in water-intensive sectors.