Vascular Imaging Market Size and Share
Market Overview
| Study Period | 2020 - 2031 |
|---|---|
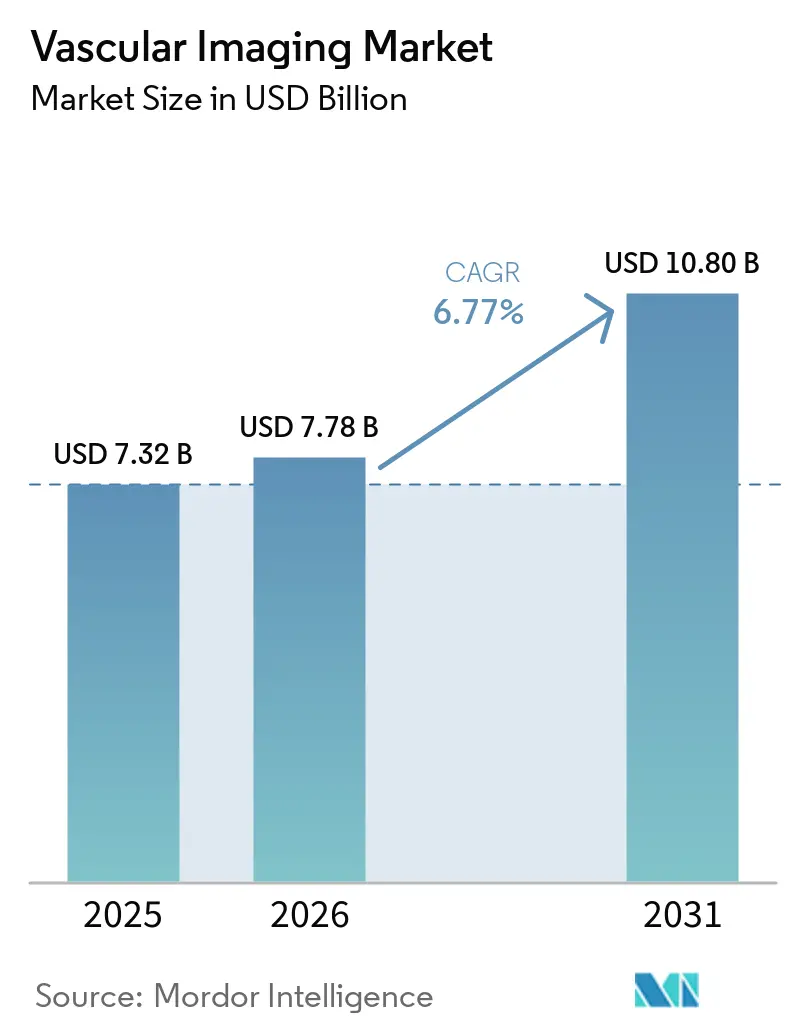
| Market Size (2026) | USD 7.78 Billion |
| Market Size (2031) | USD 10.80 Billion |
| Growth Rate (2026 - 2031) | 6.77% CAGR |
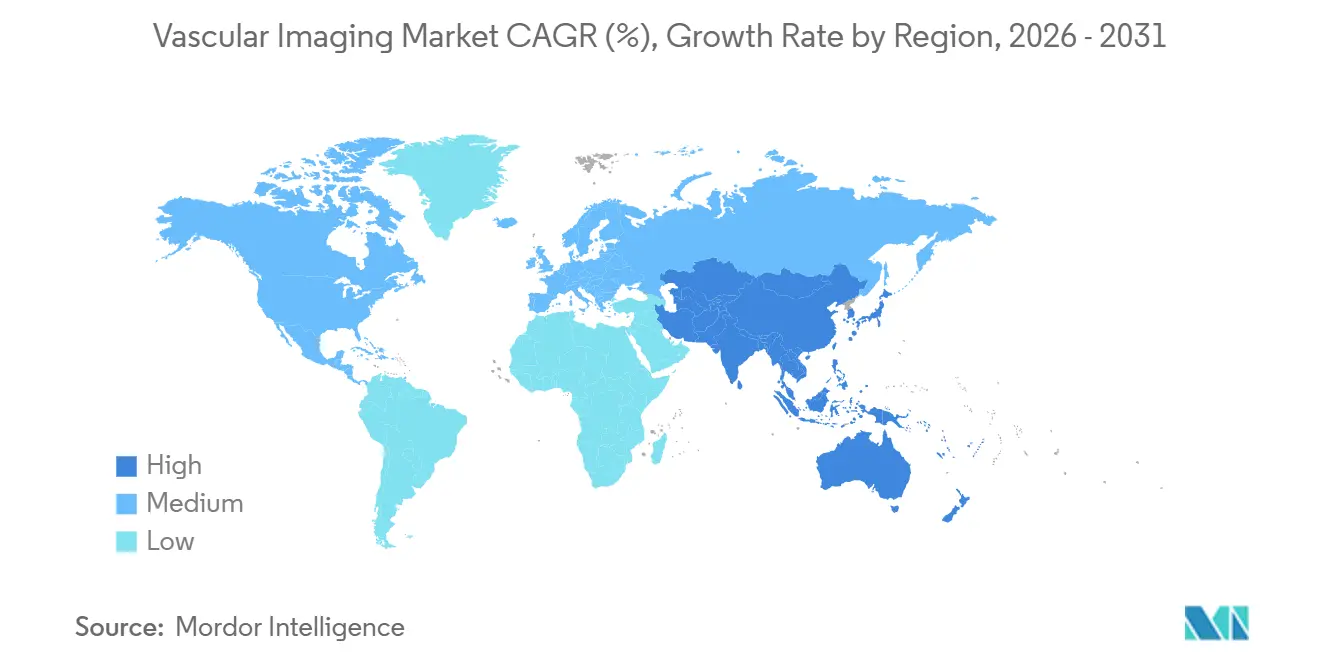
| Fastest Growing Market | Asia-Pacific |
| Largest Market | North America |
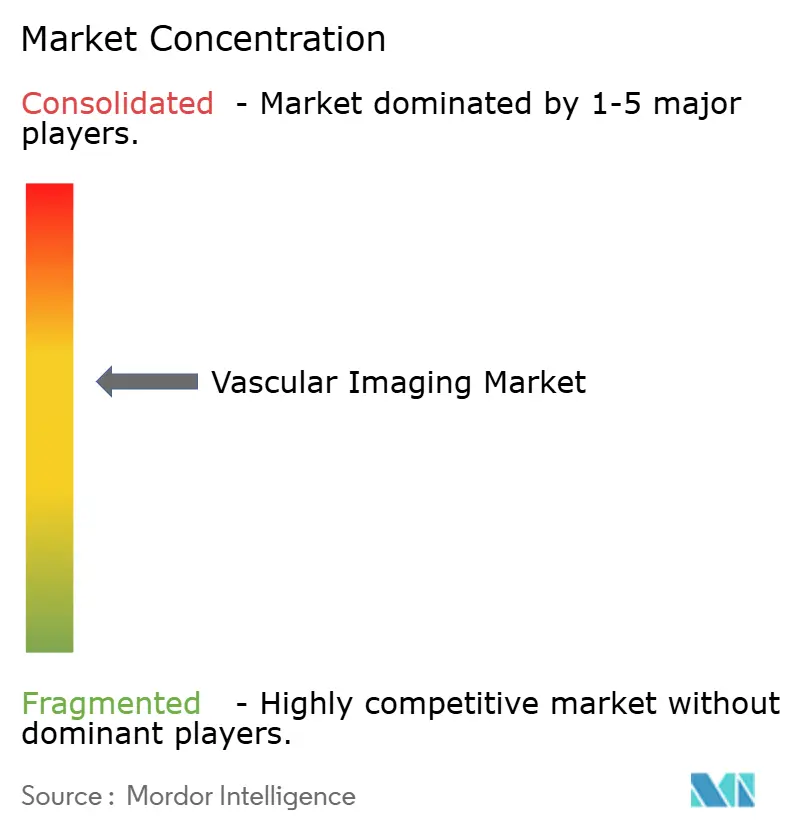
| Market Concentration | Medium |
Major Players *Disclaimer: Major Players sorted in no particular order Image © Mordor Intelligence. Reuse requires attribution under CC BY 4.0. | |
Vascular Imaging Market Analysis by Mordor Intelligence
The Vascular Imaging Market size is expected to increase from USD 7.32 billion in 2025 to USD 7.78 billion in 2026 and reach USD 10.80 billion by 2031, growing at a CAGR of 6.77% over 2026-2031.
Declining hardware prices, widening reimbursement for coronary CT angiography plus fractional-flow-reserve-derived‐from-CT (FFR-CT), and sustained demand for point-of-care ultrasound keep volumes high despite workforce shortages. Hospitals continue to refresh fixed angiography rooms with cone-beam CT fusion, while ambulatory surgery centers (ASCs) and office-based labs accelerate scanner procurement to capture outpatient procedure migration. Photon-counting detector CT installs over-index in North America and Western Europe as providers pursue dose neutrality, 40 keV virtual monoenergetic reconstructions, and in-stent visualization that conventional energy-integrating detectors cannot deliver. Manufacturers defend gross margins by bundling multi-year service, AI auto-positioning, and automatic dose-tracking software, although 20%-30% lower-priced systems from Chinese suppliers are eroding entry-level share in Asia and South America.
Key Report Takeaways
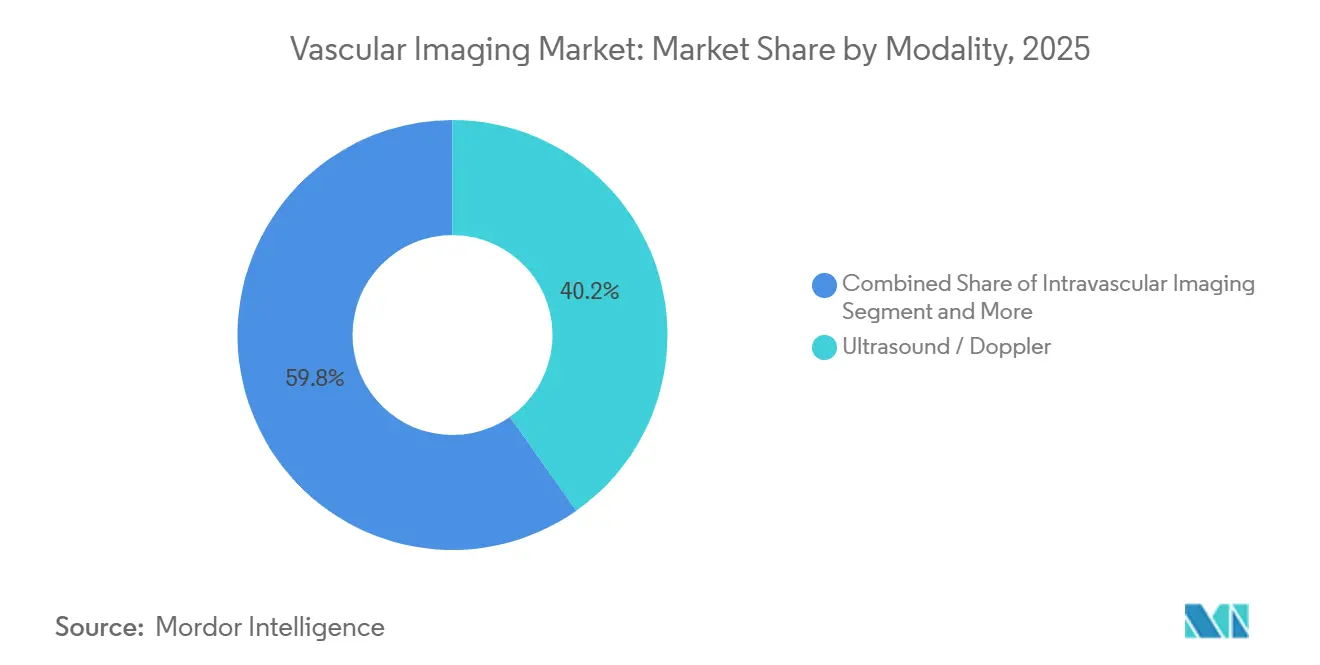
- By modality, ultrasound and Doppler systems led with 40.24% of vascular imaging market share in 2025, while intravascular IVUS-OCT-NIRS is projected to expand at an 8.22% CAGR through 2031.
- By procedure type, aortic and endovascular aneurysm repair imaging is forecast to grow at an 8.65% CAGR to 2031, whereas coronary angiography and PCI guidance retained 35.28% revenue share in 2025.
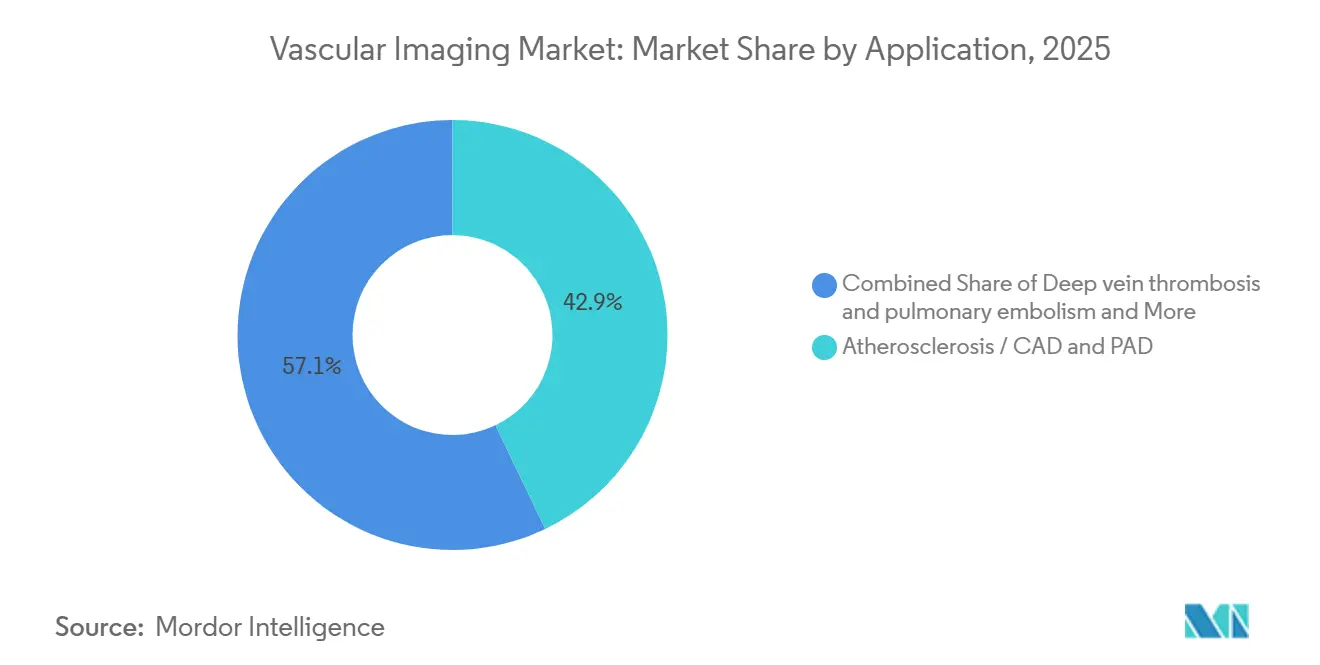
- By application, atherosclerotic coronary and peripheral arterial disease together accounted for 42.91% revenue in 2025, yet standardized deep-vein-thrombosis and pulmonary-embolism protocols are advancing at 7.12% annually.
- By end user, hospitals held 51.45% revenue in 2025, but ASCs represent the fastest-growing channel with a 9.53% CAGR over 2026-2031 as CMS added 560 vascular codes to the ASC list in 2026.
- By geography, North America captured 39.35% revenue in 2025, whereas Asia-Pacific is expected to lead expansion at a 9.12% CAGR through 2031 on the back of China’s CNY 1 trillion (USD 0.15 trillion) healthcare-infrastructure allocation.
Note: Market size and forecast figures in this report are generated using Mordor Intelligence’s proprietary estimation framework, updated with the latest available data and insights as of January 2026.
Global Vascular Imaging Market Trends and Insights
Driver Impact Analysis*
| Driver | (~) % Impact on CAGR Forecast | Geographic Relevance | Impact Timeline |
|---|---|---|---|
| CVD and PAD burden elevates demand for vascular diagnostics and monitoring | +1.8% | Global, peak in North America & EU | Long term (≥ 4 years) |
| Shift toward minimally invasive endovascular procedures increases intraprocedural imaging volumes | +1.5% | North America, EU, APAC tier-1 cities | Medium term (2-4 years) |
| CT, ultrasound, and AI advances improve diagnostic yield and throughput | +1.2% | Global | Medium term (2-4 years) |
| Reimbursement tailwinds for CCTA + FFR-CT and intravascular imaging codes | +1.0% | North America, select EU | Short term (≤ 2 years) |
| Outpatient ASC/OBL shift and hybrid OR buildouts expand installed base | +0.9% | North America, spill-over to MEA & LATAM | Medium term (2-4 years) |
| Spectral/low-iodine CT broadens eligibility for renal-risk cohorts | +0.4% | Global, early in North America & EU | Long term (≥ 4 years) |
| Source: Mordor Intelligence | |||
CVD and PAD Burden Elevates Demand for Vascular Diagnostics and Monitoring
Concerted guideline updates now mandate ankle-brachial index screening for adults over 65 and duplex or CT angiography for symptomatic peripheral arterial disease, effectively doubling the diagnostic pool worldwide. European recommendations position pre-intervention CTA or MRA as compulsory for chronic limb-threatening ischemia, embedding imaging into every revascularization workflow. Serial carotid duplex reimbursements in Japan and South Korea establish recurring revenue that was previously episodic. Cumulative procedure growth maintains a clear pull on the vascular imaging market even as modality pricing edges downward.
Shift Toward Minimally Invasive Endovascular Procedures Increases Intraprocedural Imaging Volumes
Endovascular aneurysm repair now addresses roughly 80% of abdominal cases and thoracic EVAR treats up to 80% of type B dissections, each case requiring triple-phase imaging, pre-operative CTA, cone-beam CT fusion, and completion angiography. Complex PCI volumes climbed 12% year-over-year in 2024, while randomized evidence shows OCT guidance lowers target-vessel failure by 28%, driving guideline elevation of intravascular imaging. Hybrid operating rooms surpassed 1,200 installs in North America by late 2025 and cut contrast volume 30%-40% per EVAR, expanding utilization[1]Society for Vascular Surgery, “Hybrid OR Survey 2025,” vascular.org. These intraprocedural needs power resilient spending within the vascular imaging market despite capital-budget scrutiny.
CT, Ultrasound, and AI Advances Improve Diagnostic Yield and Throughput in Vascular Pathways
Photon-counting CT reduces median CTDIvol from 12.3 mGy to 3.7 mGy at half the iodine load while retaining diagnostic confidence. FDA-cleared AI platforms now segment vessels and flag pulmonary embolism or dissection within 90 seconds, trimming radiologist read time by 40% FDA. Handheld ultrasound with AI probe guidance shrinks rural time-to-diagnosis for DVT from 48 hours to 2 hours. These technology leaps sustain throughput even when technologist vacancies approach 20%, thereby easing operational bottlenecks across the vascular imaging industry.
Reimbursement Tailwinds for CCTA + FFR-CT and Intravascular Imaging Codes Accelerate Adoption
CMS doubled outpatient payment for coronary CTA from USD 175 in 2024 to USD 357.13 in 2025 and assigned USD 877 to FFR-CT in 2026 after 34% volume growth. Private insurers removed prior-authorizations, transforming coronary CTA into a gatekeeper for stable chest-pain pathways. IVUS and OCT now receive around USD 450 per vessel in the United States, while Japan lifted OCT reimbursement by 56%, spurring cross-regional uptake. Payment momentum, therefore, underpins rapid procedure expansion and cements future revenue streams within the vascular imaging market.
Restraint Impact Analysis*
| Restraint | (~) % Impact on CAGR Forecast | Geographic Relevance | Impact Timeline |
|---|---|---|---|
| Technologist shortages cap scanning capacity and extend wait times | -0.9% | North America, EU, Australia | Short term (≤ 2 years) |
| Radiation dose and iodinated contrast safety/availability concerns limit CT and angiography use | -0.7% | Global | Medium term (2-4 years) |
| High capital and lifecycle costs constrain adoption in resource-limited settings | -0.5% | Sub-Saharan Africa, South Asia, LATAM tier-2 | Long term (≥ 4 years) |
| EU MDR/IVDR compliance burden slows product refresh and availability | -0.3% | European Union | Medium term (2-4 years) |
| Source: Mordor Intelligence | |||
Technologist Shortages Cap Scanning Capacity and Extend Wait Times
Vacancy rates reached 19.4% for CT technologists and 17.4% for cardiovascular interventional roles in 2025, lengthening median hiring time to 94 days and delaying scanner purchases. European radiographer deficits hit 12,000 positions in 2024, with Brexit-related workforce exits worsening U.K. aortic-imaging queues. Cross-training sonographers and deploying AI auto-positioning offers only partial relief, underscoring a human-capital ceiling on the vascular imaging market.
Radiation Dose and Iodinated Contrast Safety/Availability Concerns Limit CT and Angiography Use
FDA dose-tracking mandates and ACR registry participation spotlight cumulative exposure that can exceed 50 mSv in lifelong aneurysm surveillance. Contrast-induced kidney injury persists in 2%-7% of renal-impaired patients, and European guidelines restrict contrast below eGFR 30 mL/min unless dialysis is on standby, excluding 8% of peripheral arterial disease cases. The 2022-2024 iohexol shortage illustrated supply fragility, forcing substitution with MRA and delaying elective CTA. These constraints temper otherwise strong growth trajectories for the vascular imaging market.
*Our forecasts treat driver/restraint impacts as directional, not additive. The impact forecasts reflect baseline growth, mix effects, and variable interactions.
Segment Analysis
By Modality: Intravascular Precision Gains Market Traction
Intravascular imaging is forecast to post the fastest modality expansion at 8.22% CAGR as Abbott’s Ultreon 3.0 and Conavi’s hybrid IVUS-OCT automate lumen analytics and cut interpretation time 35%[2]FDA, “510(k) Premarket Notification Database,” fda.gov. The vascular imaging market size for ultrasound commanded 40.24% share in 2025 and still drives point-of-care adoption, but capital intensity is pivoting to photon-counting CT where vendors promise 0.2 mm resolution and dual‐energy subtraction. Ultrasound’s portability and zero radiation sustain 5.8% annual growth, yet margin migration to premium CT and angiography systems is unmistakable.
The vascular imaging market share for computed-tomography angiography reached a significant percentage share in 2025 and rises in tandem with AI reconstruction, while X-ray angiography benefits from hybrid-OR demand that pairs ceiling C-arms with 3D fusion software. Magnetic resonance angiography consolidates difficult renal and carotid cohorts, and nuclear medicine retains a research niche below a 5% revenue threshold.


By Procedure Type: Aortic Imaging Leads Growth Trajectory
Aortic and aneurysm imaging grows 8.65% annually as TEVAR treatment windows widen and cone-beam CT fusion lowers contrast burden 30%-40%. Coronary angiography maintains dominant revenue owing to 5,000 U.S. cath labs and guideline-mandated IVUS/OCT for complex PCI. Peripheral arterial angiography accelerates on new PAD screening recommendations, while neurovascular guidance benefits from 24-hour thrombectomy eligibility and AI triage that cuts door-to-groin time to 58 minutes.
Single-stage EVAR enabled by intraoperative cone-beam CT reduces 30-day readmissions from 8.4% to 2.9% and illustrates the cost-avoidance case sustaining scanner replacement cycles. Deep-vein-thrombosis imaging gains consistency as CTPA risk-stratification routines enter every emergency department, bolstering vascular imaging market depth.
By Application: DVT/PE Imaging Accelerates on Protocol Standardization
Emergency-department adherence to standardized CTPA plus AI RV/LV ratio measurement fuels 7.12% CAGR in DVT/PE pathways, transforming throughput and shortening time-to-anticoagulation to 2.1 hours. Atherosclerosis still dominates revenue with 42.91% share, supported by broad CAD and PAD prevalence, but aneurysmal disorder imaging keeps rising as population aging persists.
Compression ultrasound remains first-line for proximal DVT with 95% sensitivity, while dual-energy CT iodine-mapping refines chronic thromboembolic pulmonary-hypertension surgery planning in Japan. Opportunistic carotid screening identifies ≥70% stenosis in 4.2% of risk patients and reinforces cross-modality pull on duplex and CTA systems.
By End User: ASCs Capture Procedural Migration
The ASC cohort grows 9.53% annually after CMS expanded its procedure list and equalized site payment, prompting 82% of U.S. hospitals to own at least one ASC and 47% to budget angiography installs within two years. Hospitals still hold 51.45% of 2025 revenue but confront labor inflation that spurs referral of routine angiograms to lower-cost settings.
Diagnostic imaging centers consolidate under private equity, radiology partners manages 400 centers and secures 15%-20% equipment discounts, tilting purchasing leverage against OEMs. Academic institutes drive ultra-high-field MRA research and secure grants for photon-counting dose studies, ensuring an innovation loop inside the vascular imaging industry.
Geography Analysis
North America controls 39.35% of 2025 revenue thanks to 1,200 hybrid ORs, early FFR-CT reimbursement, and an installed base exceeding 5,000 cath labs. Yet technologist vacancies lengthen elective CTA wait times from 12 days in 2023 to 18 days in 2025, creating latent demand buffered by AI workflow tools.
Asia-Pacific delivers the fastest regional CAGR at 9.12%, driven by China’s CNY 1 trillion (USD 0.15 trillion) hospital build-out and India’s Production-Linked Incentive that subsidizes domestic CT and ultrasound manufacturing[3]National Health Commission of China, “14th Five-Year Plan for Healthcare Infrastructure,” nhc.gov.cn. United Imaging captured 18% of new CT installs in tier-1 Chinese cities by Q4 2024 after pricing photon-counting systems 25% below incumbents. Japan lifted the OCT reimbursement 56%, reinforcing premium adoption curves.
Europe’s significant share faces MDR/IVDR attrition that places 40% of legacy devices at withdrawal risk and lifts compliance cost 30%, favoring vendors with deep notified-body ties. The Middle East and Africa grow off a small base, Saudi Arabia’s USD 64 billion Vision 2030 spend anchors GCC demand and delivered the region’s first photon-counting CT in June 2024. South America’s 5% share is steady, with Brazil and Argentina adopting refurbished angiography systems to offset currency volatility.

Competitive Landscape
The vascular imaging market exhibits moderate concentration; GE HealthCare, Siemens Healthineers, Philips, Canon Medical, and FUJIFILM collectively hold a significant share. GE secures accounts with bundled photon-counting CT, 10-year service, and AI automation priced at USD 3.5 million total cost, locking out low-capital rivals. Siemens’ 200 global NAEOTOM Alpha installs and 14 spectral patents erect IP barriers until 2028.
Regional challengers pressure price: United Imaging undercuts photon-counting CT by 25%, Mindray’s Resona A20 handheld ultrasound launched in 2025 at sub-USD 15,000, and Conavi disrupts the IVUS/OCT duopoly with a hybrid catheter 15% cheaper than separate devices. IEC dose-display standards add USD 80,000 per angiography system, a burden smaller OEMs struggle to absorb.
AI software providers such as Viz.ai and RapidAI circumvent capital cycles by selling SaaS subscriptions, capturing USD 120 million annualized recurring revenue and compelling equipment makers to embed open-API ecosystems. Private-equity consolidation of imaging centers shifts bargaining power downstream, forcing OEMs to supply outcome-based contracts with uptime guarantees.
Vascular Imaging Industry Leaders
Siemens Healthineers
GE HealthCare
Koninklijke Philips
FUJIFILM (SonoSite)
Canon Medical Systems
- *Disclaimer: Major Players sorted in no particular order

Recent Industry Developments
- April 2026: Abbott received FDA clearance and CE Mark for Ultreon 3.0 software, integrating AI coronary-imaging analytics into one platform.
- December 2025: Royal Philips agreed to acquire SpectraWAVE, adding enhanced vascular imaging and AI-based physiology tools to its cardiology franchise.


Global Vascular Imaging Market Report Scope
As per the scope of the report, vascular imaging is a set of medical techniques used to visualize the blood vessels (arteries, veins, and capillaries) within the body. It helps in diagnosing and assessing vascular conditions such as blockages, aneurysms, blood clots, and abnormalities in blood flow.
The vascular imaging market is segmented by modality into ultrasound/doppler, computed tomography angiography (CTA), X-ray angiography/digital subtraction angiography (DSA), magnetic resonance angiography (MRA), intravascular imaging (IVUS/OCT/NIRS), and nuclear medicine (SPECT/PET vascular applications). By procedure type, the market is categorized into coronary angiography/PCI guidance, peripheral arterial angiography and interventions (lower/upper extremity), neurovascular angiography and EVT guidance, aortic/EVAR/TEVAR imaging, venous thromboembolism imaging (DVT/PE pathways), and carotid and cerebrovascular duplex/CTA/MRA. By application, it is divided into atherosclerosis/CAD and PAD, aneurysmal disorders, vasculitis and large-vessel inflammation, deep vein thrombosis and pulmonary embolism, arteriovenous malformations and fistulas, and tumor vascularity and pre-op planning. By end user, the market is segmented into hospitals (tertiary/community), diagnostic imaging centers, ambulatory surgery centers, and academic and research institutes.
Geographically, the market is analyzed across North America, Europe, Asia-Pacific, the Middle East and Africa, and South America. The market report also covers the estimated market sizes and trends for 17 countries across major regions globally. For each segment, the market size and forecast are provided in terms of value (USD).
| Ultrasound / Doppler |
| Computed Tomography Angiography (CTA) |
| X-ray Angiography / Digital Subtraction Angiography (DSA) |
| Magnetic Resonance Angiography (MRA) |
| Intravascular Imaging (IVUS / OCT / NIRS) |
| Nuclear Medicine (SPECT / PET vascular applications) |
| Coronary angiography / PCI guidance |
| Peripheral arterial angiography & interventions (lower/upper extremity) |
| Neurovascular angiography & EVT guidance |
| Aortic/EVAR/TEVAR imaging |
| Venous thromboembolism imaging (DVT/PE pathways) |
| Carotid and cerebrovascular duplex/CTA/MRA |
| Atherosclerosis / CAD & PAD |
| Aneurysmal disorders |
| Vasculitis & large-vessel inflammation |
| Deep vein thrombosis & pulmonary embolism |
| Arteriovenous malformations & fistulas |
| Tumor vascularity and pre-op planning |
| Hospitals (Tertiary/Community) |
| Diagnostic Imaging Centers |
| Ambulatory Surgery Centers |
| Academic & Research Institutes |
| North America | United States |
| Canada | |
| Mexico | |
| Europe | Germany |
| France | |
| United Kingdom | |
| Italy | |
| Spain | |
| Rest of Europe | |
| Asia-Pacific | China |
| India | |
| Japan | |
| South Korea | |
| Australia | |
| Rest of Asia-Pacific | |
| Middle East and Africa | GCC |
| South Africa | |
| Rest of Middle East and Africa | |
| South America | Brazil |
| Argentina | |
| Rest of South America |
| By Modality | Ultrasound / Doppler | |
| Computed Tomography Angiography (CTA) | ||
| X-ray Angiography / Digital Subtraction Angiography (DSA) | ||
| Magnetic Resonance Angiography (MRA) | ||
| Intravascular Imaging (IVUS / OCT / NIRS) | ||
| Nuclear Medicine (SPECT / PET vascular applications) | ||
| By Procedure Type | Coronary angiography / PCI guidance | |
| Peripheral arterial angiography & interventions (lower/upper extremity) | ||
| Neurovascular angiography & EVT guidance | ||
| Aortic/EVAR/TEVAR imaging | ||
| Venous thromboembolism imaging (DVT/PE pathways) | ||
| Carotid and cerebrovascular duplex/CTA/MRA | ||
| By Application | Atherosclerosis / CAD & PAD | |
| Aneurysmal disorders | ||
| Vasculitis & large-vessel inflammation | ||
| Deep vein thrombosis & pulmonary embolism | ||
| Arteriovenous malformations & fistulas | ||
| Tumor vascularity and pre-op planning | ||
| By End User | Hospitals (Tertiary/Community) | |
| Diagnostic Imaging Centers | ||
| Ambulatory Surgery Centers | ||
| Academic & Research Institutes | ||
| By Geography | North America | United States |
| Canada | ||
| Mexico | ||
| Europe | Germany | |
| France | ||
| United Kingdom | ||
| Italy | ||
| Spain | ||
| Rest of Europe | ||
| Asia-Pacific | China | |
| India | ||
| Japan | ||
| South Korea | ||
| Australia | ||
| Rest of Asia-Pacific | ||
| Middle East and Africa | GCC | |
| South Africa | ||
| Rest of Middle East and Africa | ||
| South America | Brazil | |
| Argentina | ||
| Rest of South America | ||


Key Questions Answered in the Report
How large will the vascular imaging market be by 2031?
The vascular imaging market size is projected to reach USD 10.80 billion by 2031, expanding at a 6.77% CAGR from 2026 to 2031.
Which modality segment grows the fastest through 2031?
Intravascular imaging systems (IVUS, OCT, NIRS) are forecast to post the quickest growth at 8.22% annually as cardiologists rely on real-time plaque characterization.
What drives ASC demand for vascular imaging equipment?
CMS added 560 vascular procedures to the ASC list in 2026 and raised reimbursement 8%-12%, prompting 63% of hospital administrators to prioritize angiography purchases for their ASCs.
Which region leads future growth?
Asia-Pacific records the highest regional CAGR at 9.12% through 2031 due to China's CNY 1 trillion (USD 0.15 trillion) hospital build program and India's incentive scheme for domestic scanner production.
Page last updated on:


