
Vanilla Flavor Market Size and Share
Market Overview
| Study Period | 2022 - 2032 |
|---|---|
| Market Size (2027) | USD 223.5 Million |
| Market Size (2032) | USD 998.61 Million |
| Growth Rate (2027 - 2032) | 5.24 % |
| Fastest Growing Market | Asia-Pacific |
| Largest Market | North America |
| Market Concentration | Medium |
Major Players *Disclaimer: Major Players sorted in no particular order Image © Mordor Intelligence. Reuse requires attribution under CC BY 4.0. | |
Vanilla Flavor Market Analysis by Mordor Intelligence
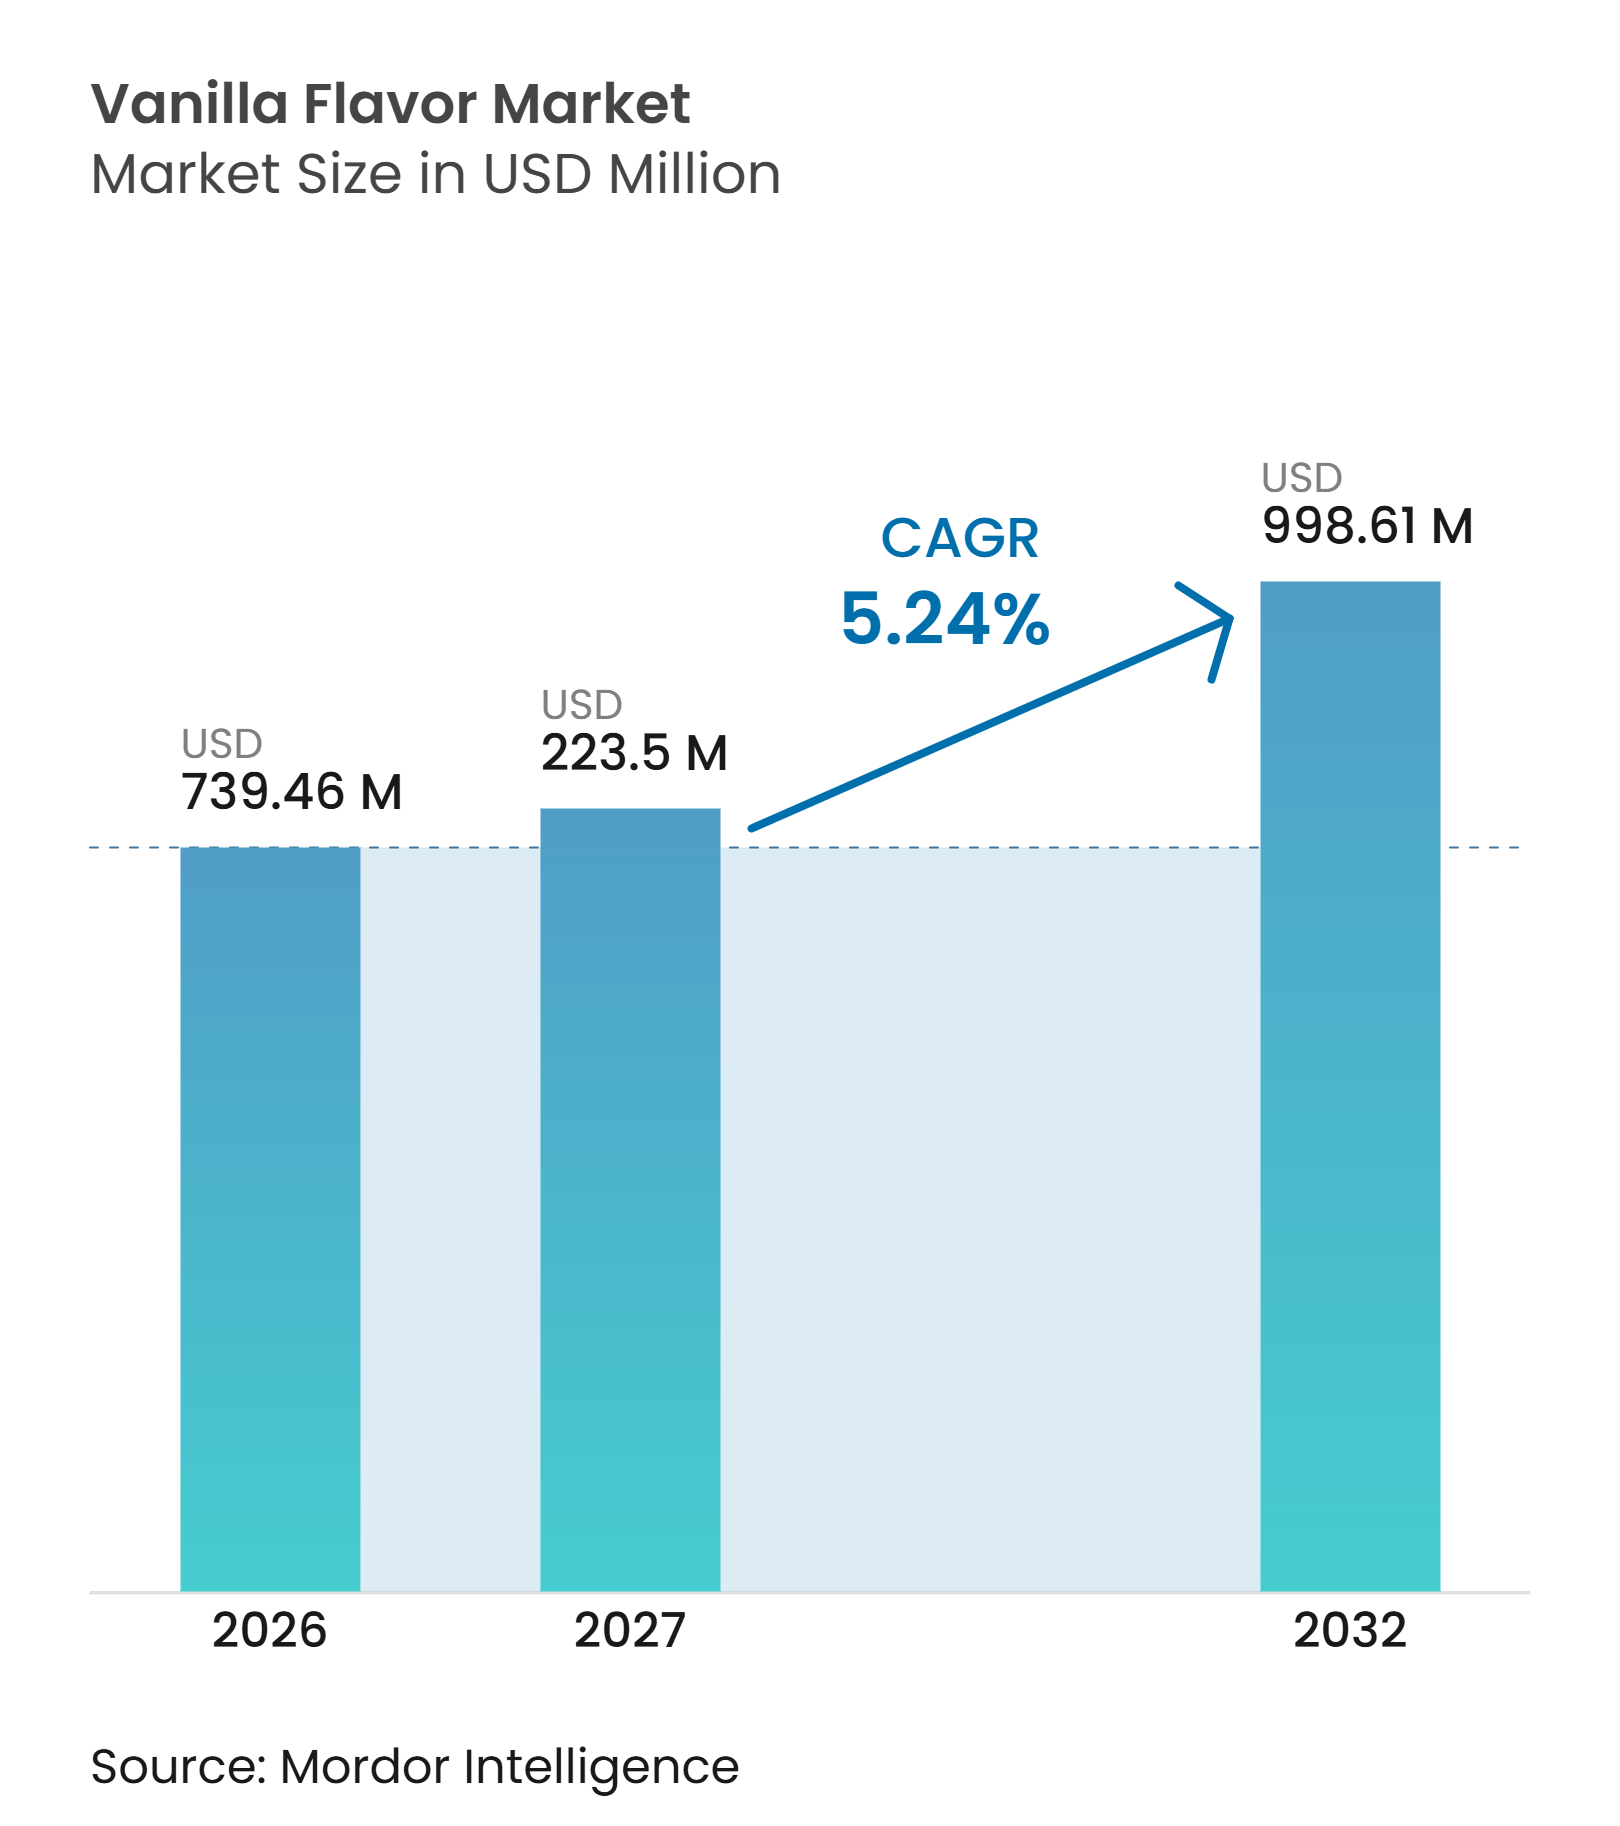
The vanilla flavor market size was valued at USD 739.46 million in 2026 and is estimated to grow from USD 773.50 million in 2027 to reach USD 998.61 million by 2032, at a CAGR of 5.24% during the forecast period (2027-2032). The vanilla flavor market is shaped by wider demand for clearer ingredient labeling and dependable supply arrangements. Synthetic vanillin remains central to high-volume formulations because it provides stable quality and year-round availability. Natural vanilla extracts are gaining attention as food producers review labels, product positioning, and ingredient sourcing. Fermentation-derived vanillin adds another supply option between conventional synthetic vanillin and bean-derived extracts. This makes supply flexibility, traceability, and formulation performance important areas of competition.
Key Report Takeaways
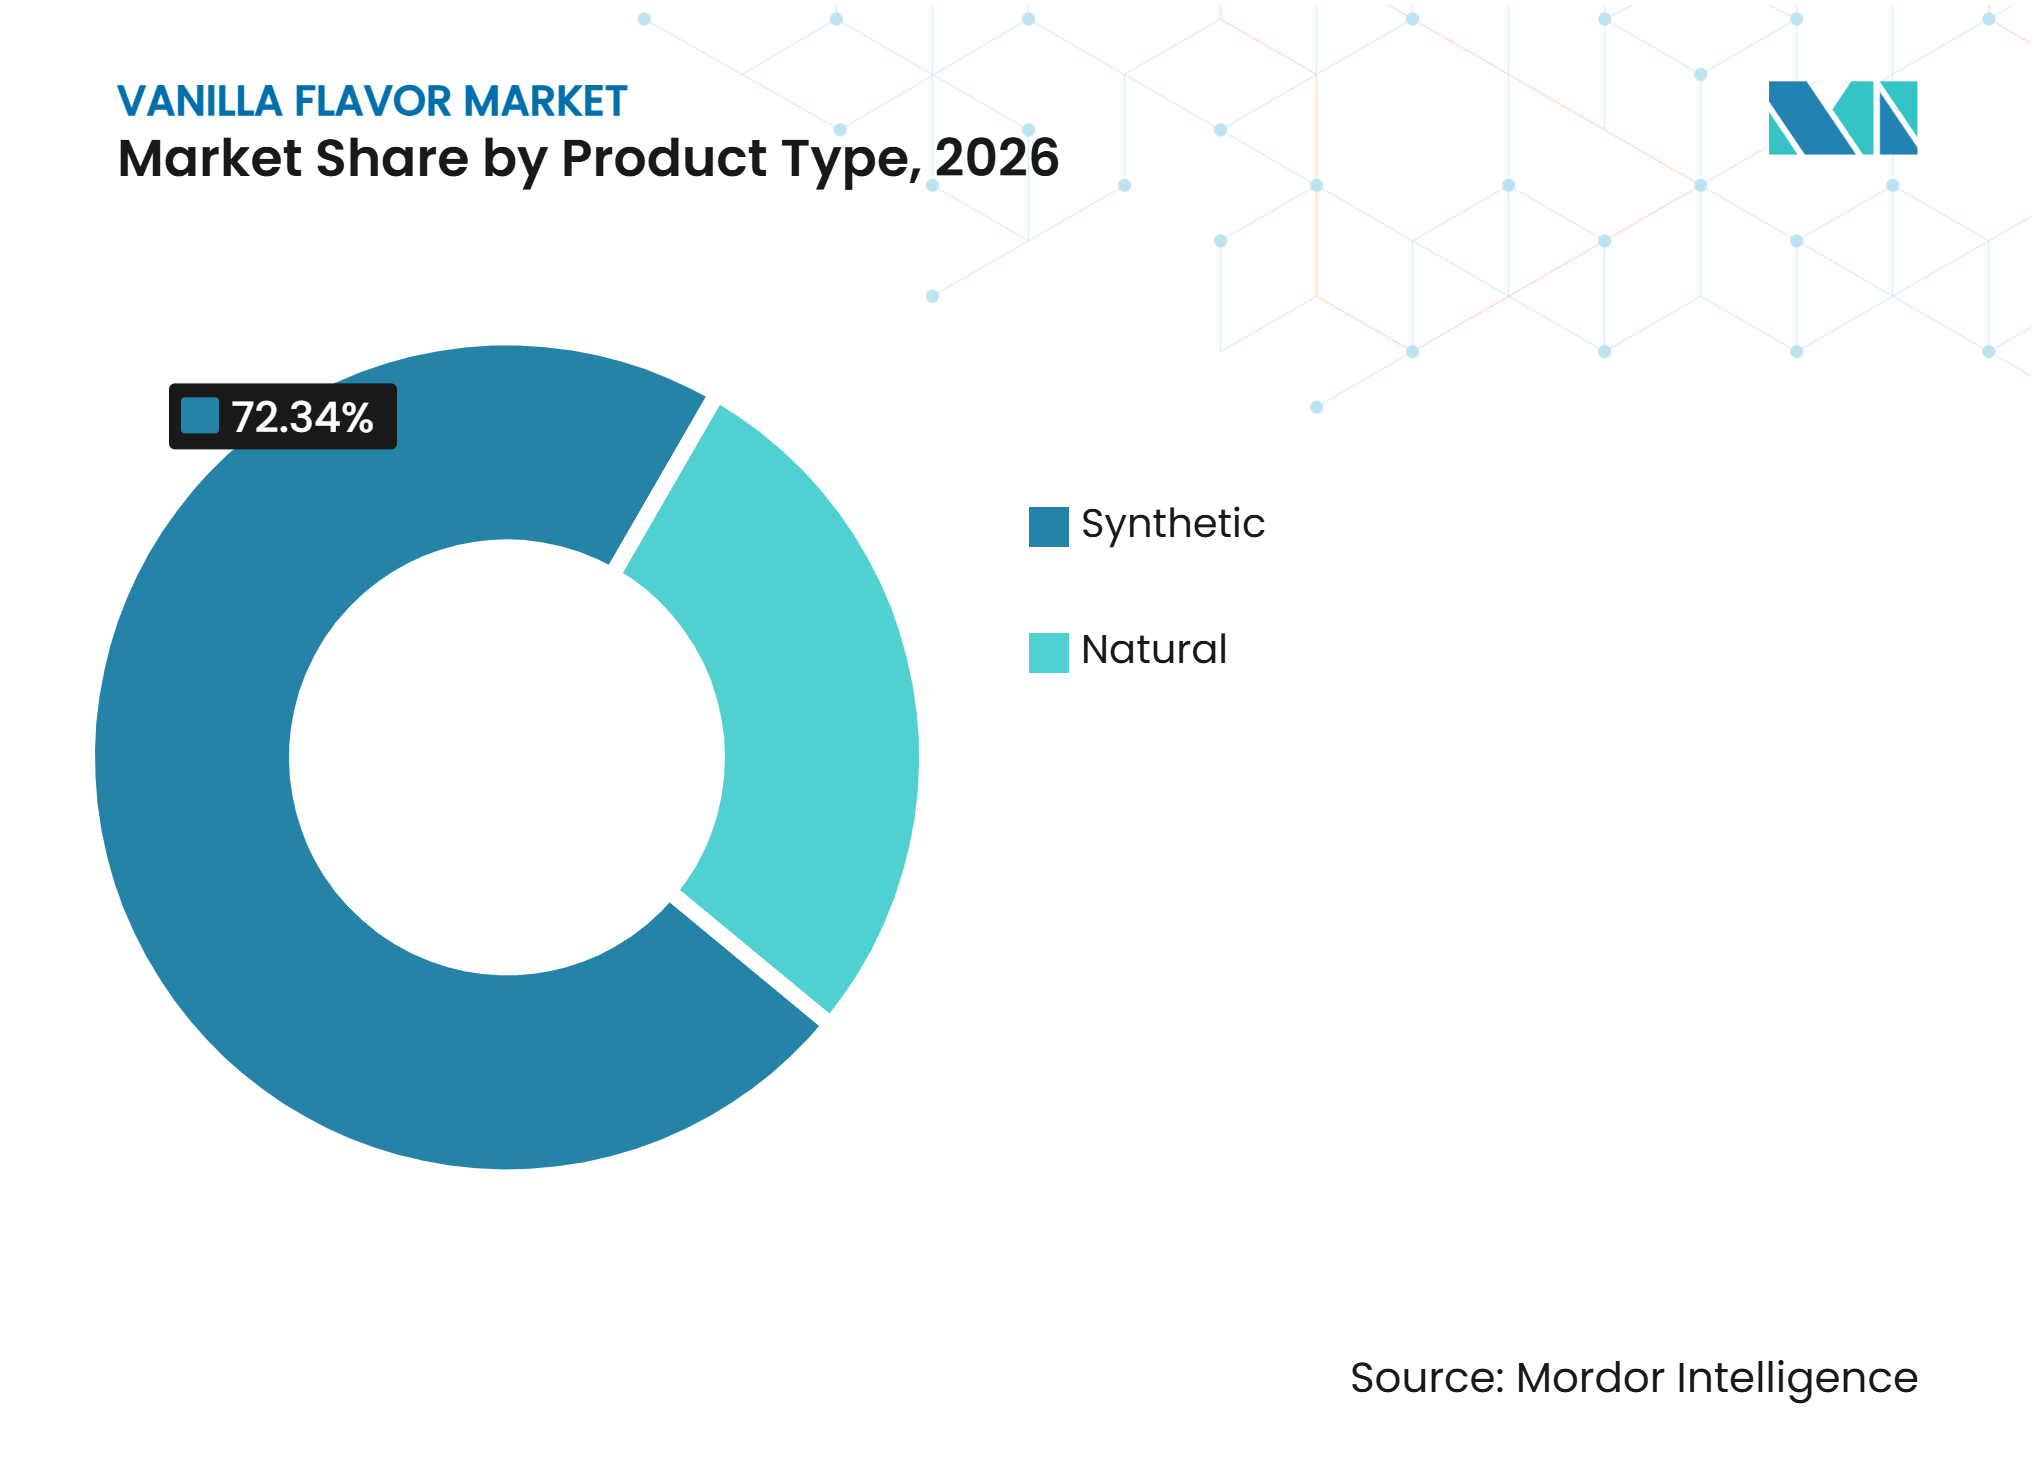
- By type, synthetic vanilla flavoring held 72.34% of the vanilla flavor market share in 2026, while natural vanilla extract is projected to expand at a 6.81% CAGR through 2032.
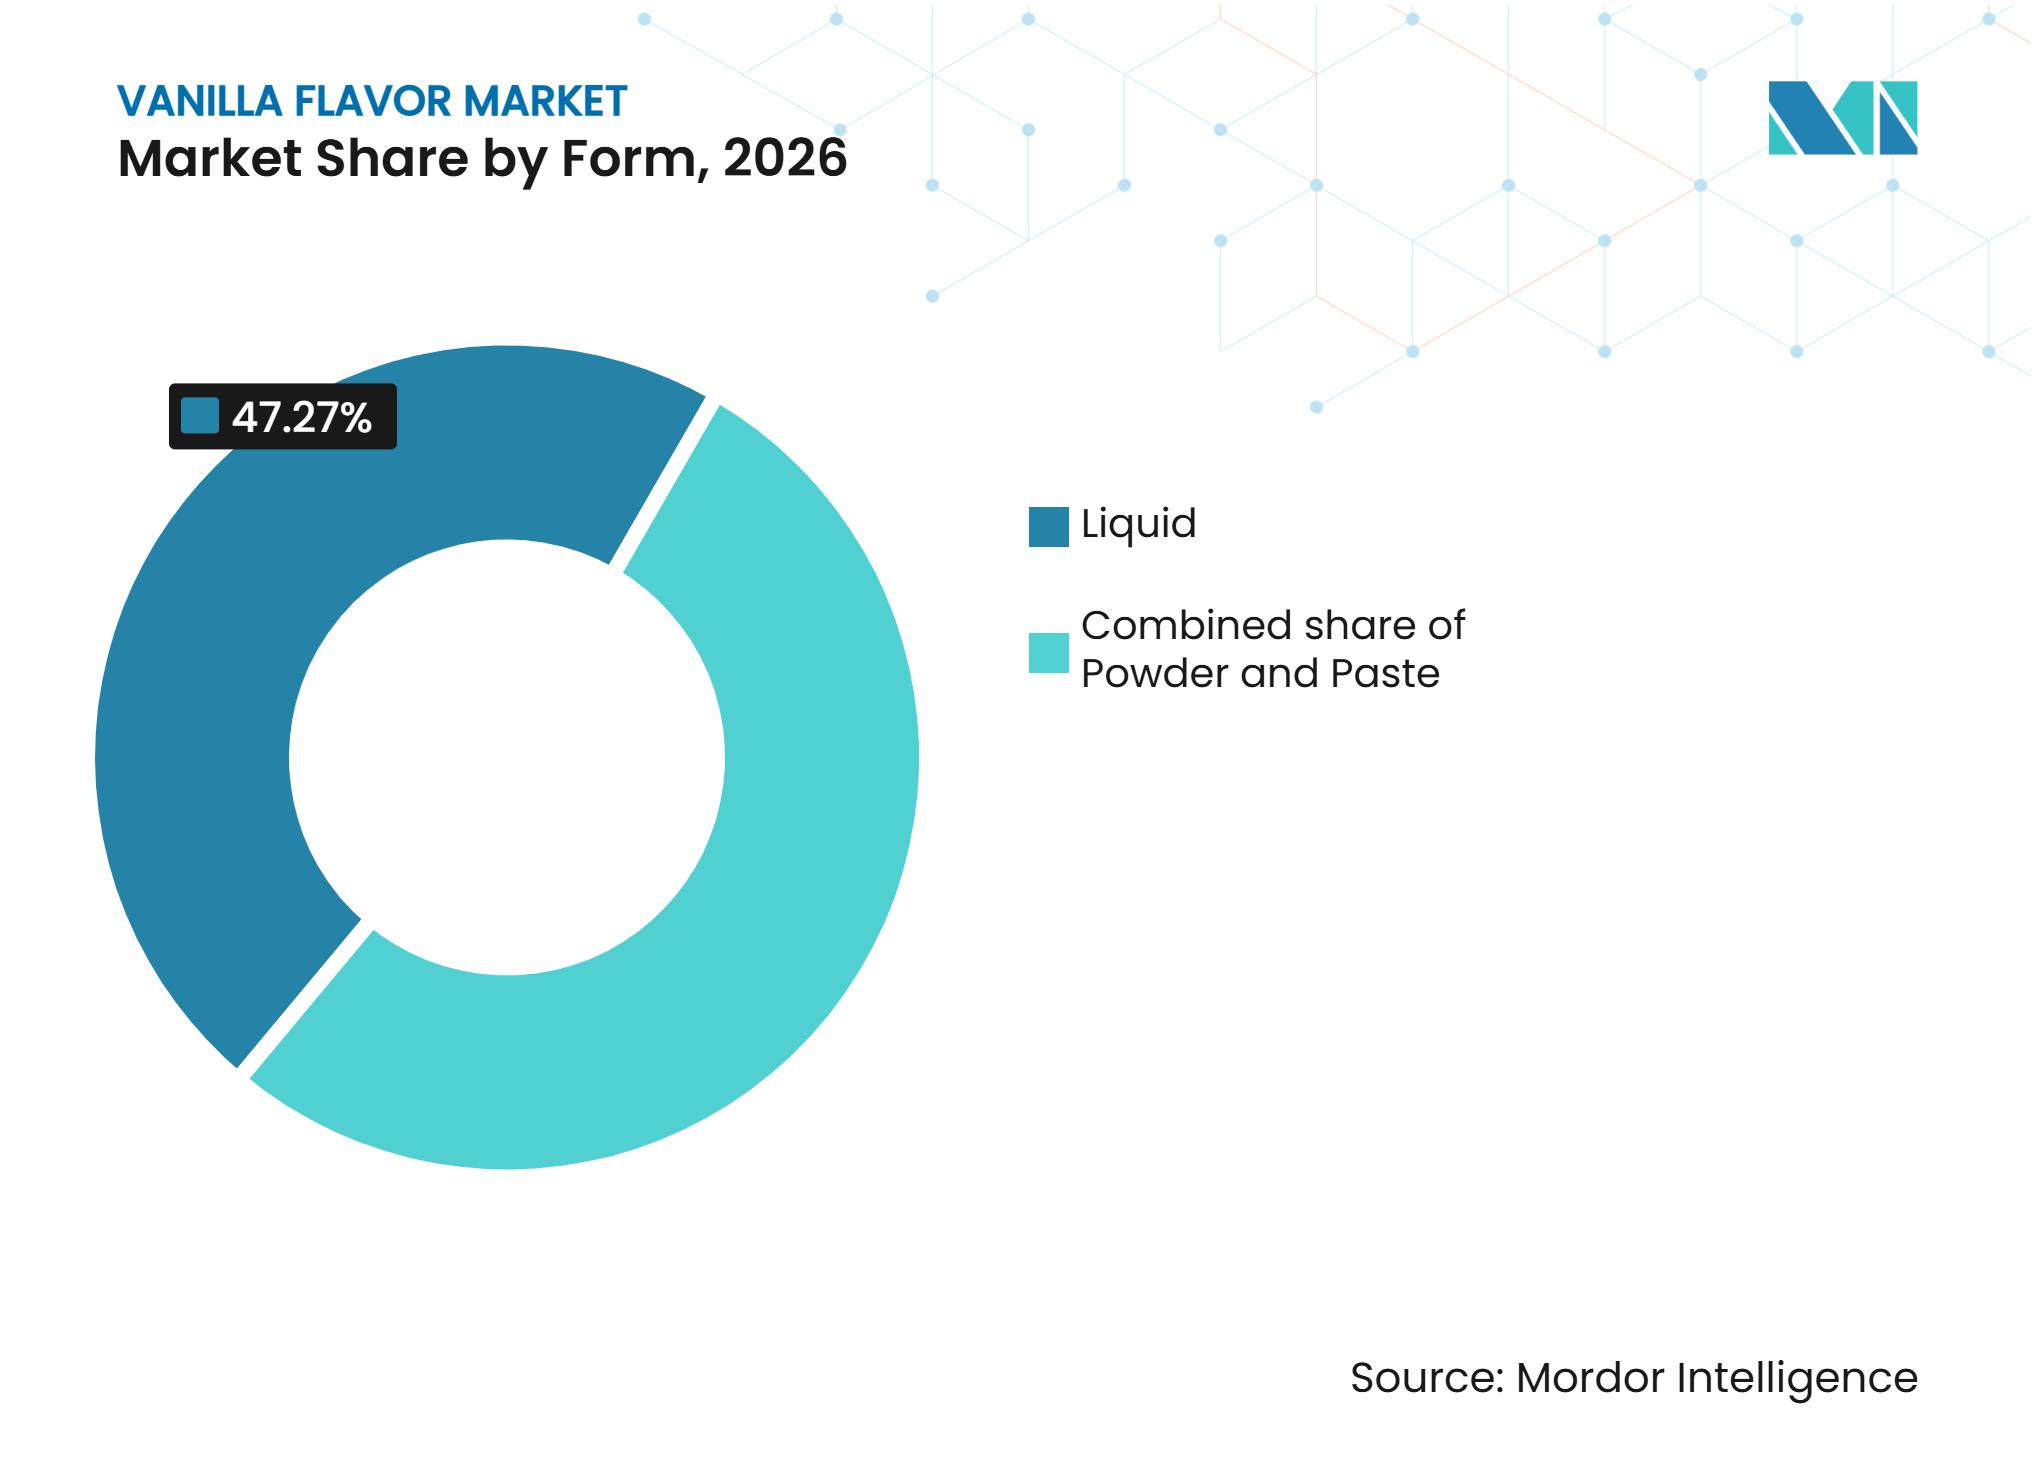
- By form, liquid vanilla held 47.27% of the vanilla flavor market share in 2026, while paste vanilla is projected to expand at a 6.69% CAGR through 2032.
- By application, bakery and confectionery held 37.45% of the vanilla flavor market share in 2026, while dairy products are projected to expand at a 7.56% CAGR through 2032.
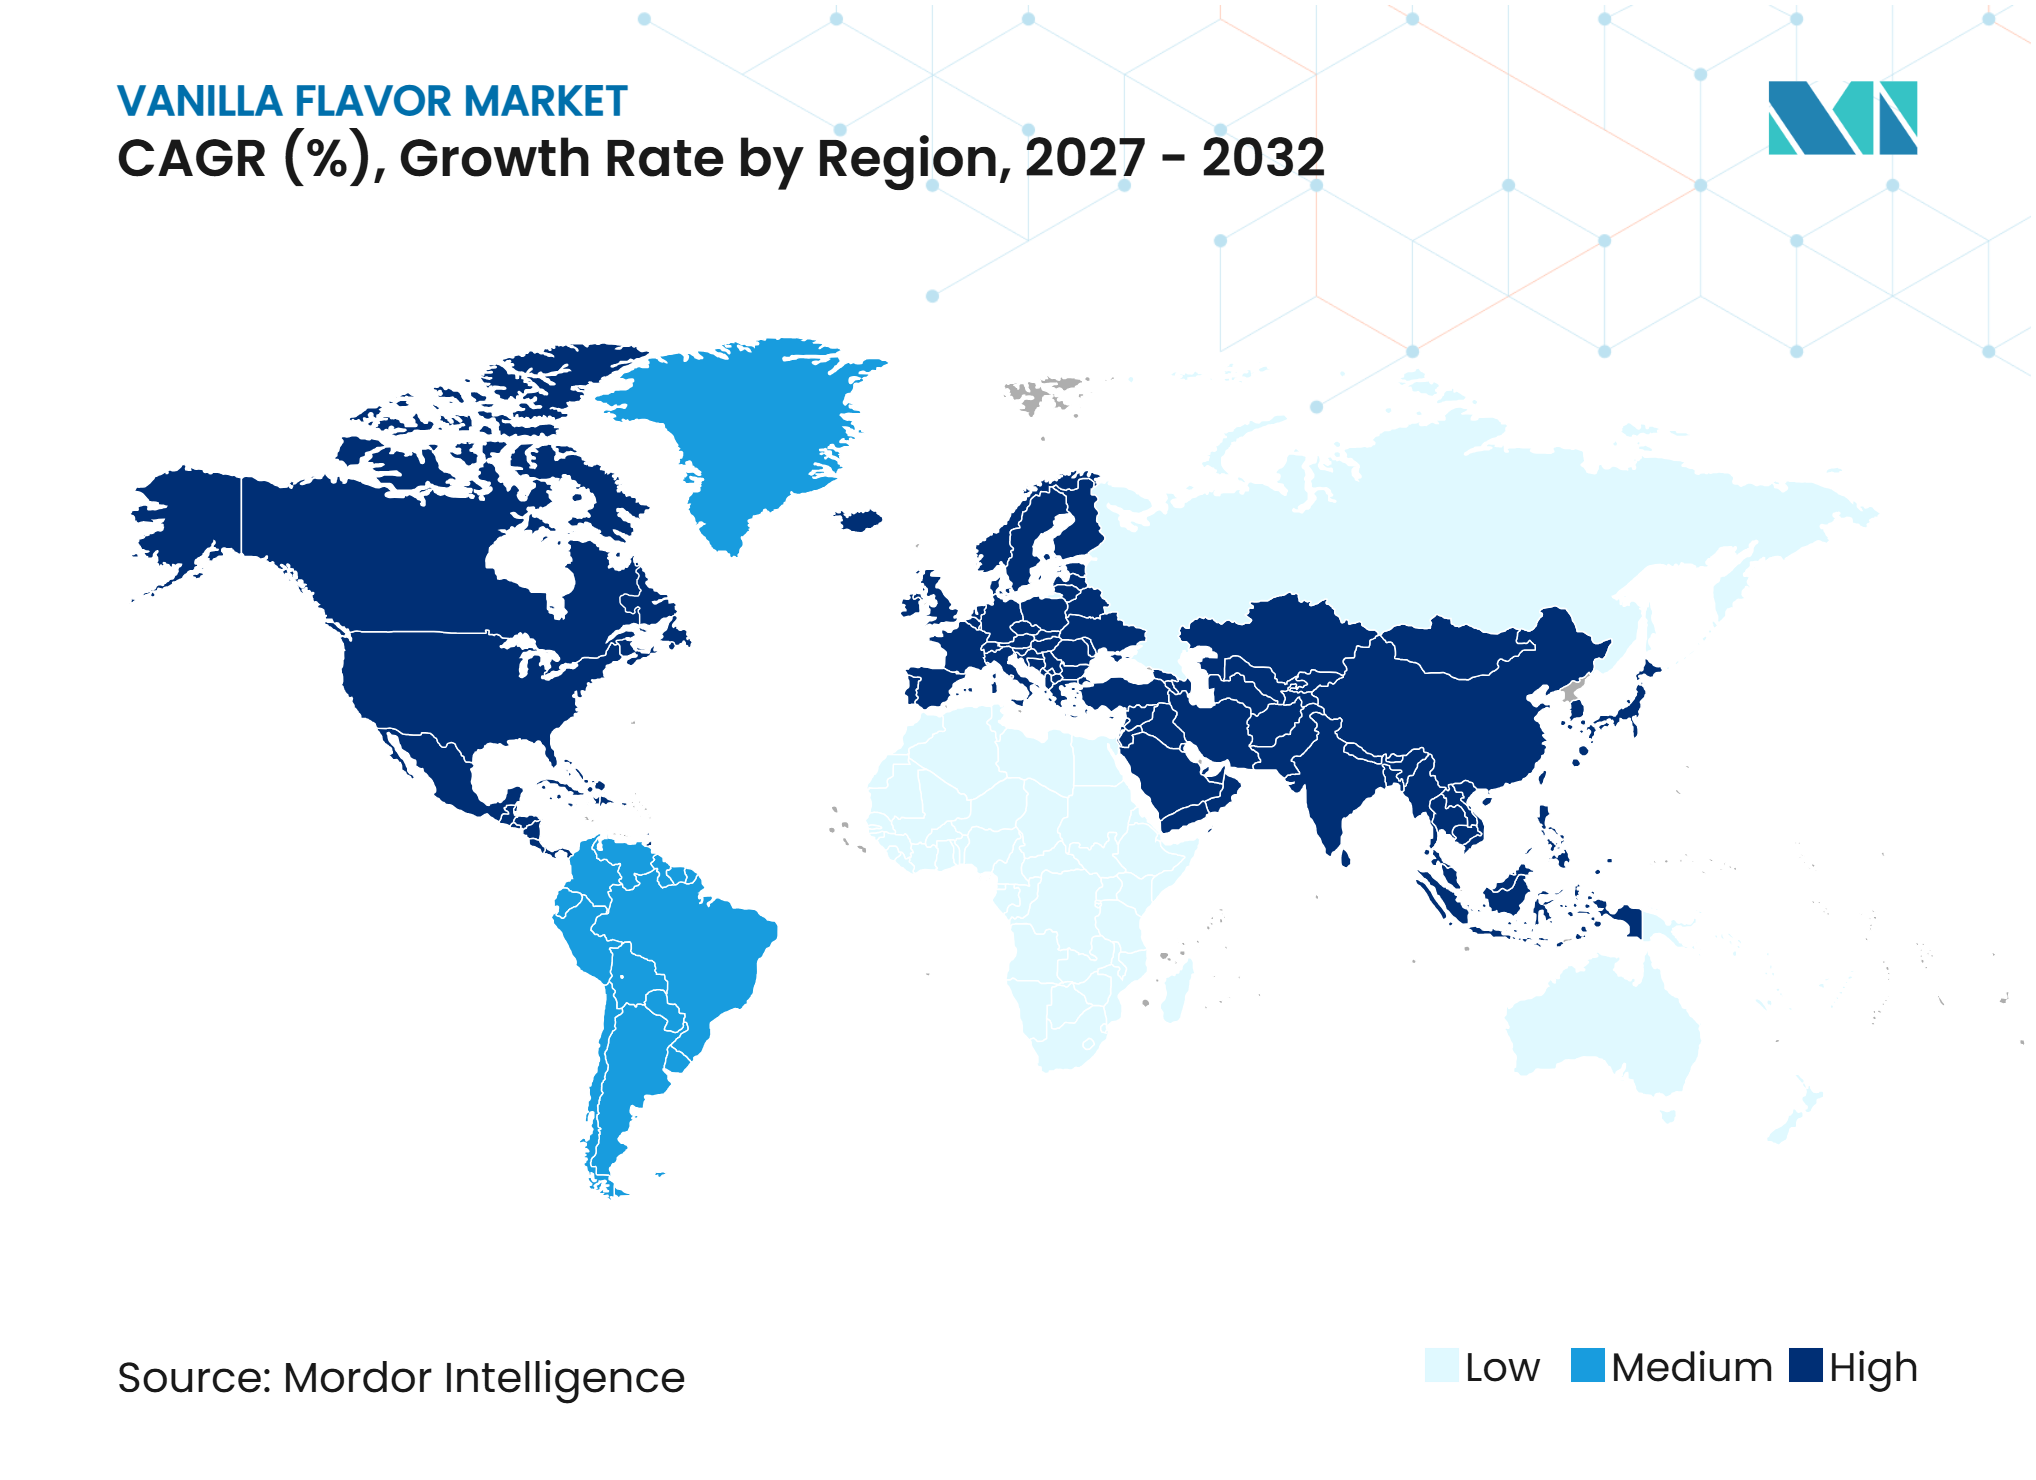
- By geography, North America held 34.71% of the vanilla flavor market share in 2026, while Asia-Pacific is projected to expand at a 6.75% CAGR through 2032.
Note: Market numbers in this report are based on Mordor Intelligence's proprietary estimation framework, which combines nine months of actuals with Q4 projections for base year 2026.
Market Trends and Insights
Drivers Impact Analysis of Vanilla Flavor Market*
| Driver | (~) % Impact on CAGR Forecast | Geographic Relevance | Impact Timeline |
|---|---|---|---|
| Demand for Natural and Clean-Label Flavors | +1.2% | Global, strongest in North America and Western Europe | Medium term (2-4 years) |
| Premium Bakery and Confectionery Consumption | +0.9% | North America, Europe, and Asia-Pacific | Medium term (2-4 years) |
| Applications Across Dairy and Ice Cream | +0.8% | Asia-Pacific, with spillover to the Middle East and Africa and South America | Long term (≥ 4 years) |
| Demand for Organic Vanilla Extracts | +0.5% | North America and Western Europe | Long term (≥ 4 years) |
| Artisanal and Specialty Dessert Popularity | +0.4% | North America, Western Europe, and Asia-Pacific urban centers | Short term (≤ 2 years) |
| Vanilla Flavor Extraction Advances | +0.5% | Global, with early gains in Europe and North America | Medium term (2-4 years) |
| Source: Mordor Intelligence | |||
Growing Demand for Natural and Clean-Label Flavors
The vanilla flavor market benefits from food producers placing greater emphasis on ingredient labeling and traceable sourcing. Bean-derived extracts and fermentation-derived vanillin can support natural product positioning, although they address different cost and sensory requirements. IFF identifies clean-label options, sustainable sourcing, traceability, and customizable solutions as key considerations in vanilla flavor design[1]. Manufacturers must distinguish vanilla extract from flavors formulated with natural or nature-identical compounds, as this distinction affects labeling and regulatory compliance. This requirement encourages suppliers to provide clearer origin information, application guidance, and documentation to food producers. Consequently, demand favors suppliers that combine natural-label options with reliable industrial-scale supply.
Rising Consumption of Premium Bakery and Confectionery
Bakery and confectionery is projected to remain the largest application area in the vanilla flavor market, accounting for a 37.45% share in 2026. Vanilla supports established products, including cakes, cookies, chocolate products, pastry creams, and coatings. Kerry classifies vanilla as a mainstream flavor that has remained popular for five years, supporting its continued role as a familiar base for product development[2]. The same source notes that mainstream flavors, such as vanilla, can serve as a foundation for seasonal variations and new add-ins. Single-origin, bourbon, smoked, and floral vanilla profiles enable bakery brands to differentiate premium products while retaining a familiar core flavor. Vanilla also supports sweetness perception and masks challenging notes in reduced-sugar and protein-enhanced baked goods.
Expanding Applications Across Dairy and Ice Cream
Dairy products are projected to register a CAGR of 7.56% through 2032, the fastest growth rate among application segments in the vanilla flavor market. Vanilla use extends beyond conventional ice cream and yogurt to high-protein beverages, plant-based drinks, and fortified dairy products. According to IFF, vanilla can mask challenging notes, add warmth, and enhance perceived sweetness in protein shakes, meal replacements, bars, dairy products, and plant-based beverages. Its performance varies based on the product base, acidity, protein content, fat level, processing conditions, and shelf life. Therefore, manufacturers must conduct product-specific screening when selecting vanilla flavors rather than relying on a single vanilla solution. Vanilla’s broader role as a sensory tool supports its application across dairy and dairy-alternative formulations.
Increasing Demand for Organic Vanilla Extracts
Organic vanilla extracts appeal to buyers who place greater value on agricultural practices, origin, and ingredient transparency. The opportunity is most pronounced in North America and Western Europe, where specialty food, bakery, and dessert manufacturers use sourcing credentials to strengthen product positioning. Vanilla extraction methods, origin, curing processes, and species influence the final flavor profile, making documented sourcing important for products that emphasize quality differentiation. However, organic positioning does not eliminate the need for consistent flavor performance and reliable supply. Producers must therefore align certification and traceability practices with the technical requirements of large-scale food production. This dynamic supports demand for suppliers that can deliver both premium claims and repeatable sensory performance.
Restraints Impact Analysis of Vanilla Flavor Market*
| Restraint | (~) % Impact on CAGR Forecast | Geographic Relevance | Impact Timeline |
|---|---|---|---|
| Natural Vanilla Bean Price Volatility | -1.0% | Global, with strong effects on North American and European procurement | Short term (≤ 2 years) |
| Climate Disruptions in Producing Regions | -0.6% | Madagascar, Indonesia, and Uganda, with global supply-chain effects | Long term (≥ 4 years) |
| Competition From Synthetic Vanillin Alternatives | -0.4% | Global, strongest in cost-sensitive Asia-Pacific and South American markets | Medium term (2-4 years) |
| Concentrated Vanilla Bean Production | -0.3% | Global, with strong exposure in North America and Europe | Long term (≥ 4 years) |
| Source: Mordor Intelligence | |||
High Volatility in Natural Vanilla Bean Prices
Natural vanilla bean price fluctuations can influence sourcing decisions and complicate long-term reformulation strategies. The Central Bank of Madagascar reported an average export price of USD 38/kg in Q4 2025, compared with USD 63.6/kg in Q4 2024. Lower prices can improve access to natural extracts for food manufacturers that previously relied on synthetic vanillin. However, they may also reduce farmer incomes and discourage investment in crop care, curing, and quality management. Suppliers must balance favorable short-term purchasing conditions with robust traceability and quality controls. The vanilla flavor market remains vulnerable to price changes that affect both ingredient costs and the consistency of bean-derived materials.
Climate-Related Disruptions in Vanilla-Producing Regions
Climate change is increasingly threatening vanilla cultivation by disrupting growing conditions, reducing supply reliability, and increasing sourcing risks for global vanilla flavor manufacturers. In March 2025, Duke University reported findings from a survey of nearly 500 smallholder farmers in Madagascar’s SAVA region, which produces approximately two-thirds of the world’s vanilla. Nearly all surveyed farmers reported changes in temperature and rainfall patterns. These disruptions affected agricultural calendars, reduced water availability, and increased exposure to pests and crop diseases. Unpredictable weather conditions can consequently affect flowering, pollination, bean development, and harvest quality. For manufacturers, these risks create uncertainty in raw-material procurement, increase the possibility of supply shortages, and intensify price volatility, making consistent vanilla flavor production more challenging.
*Our forecasts treat driver/restraint impacts as directional, not additive. The impact forecasts reflect baseline growth, mix effects, and variable interactions.
Vanilla Flavor Market Segment Analysis
By Type:
Synthetic Supply Supports Scale While Natural Options Gain AttentionSynthetic vanilla flavoring is projected to hold a 72.34% share of the vanilla flavor market in 2026. This position reflects its suitability for high-volume food production, where manufacturers require consistent sensory performance and reliable availability. Borregaard states that vanillin, derived from petrochemical or bio-based sources, accounts for more than 99% of the vanilla flavor used in food production[3]. The company also notes that global vanilla bean production cannot meet demand for vanilla flavor at current food processing volumes. Consequently, synthetic and bio-based vanillin remain practical options for industrial bakery, dairy, beverage, and compound applications. Their role extends beyond cost considerations, as consistency and year-round availability are also critical.
Natural vanilla extract is projected to grow at a CAGR of 6.81% through 2032, driven by increasing interest in clear labeling, traceability, and premium flavor positioning. IFF explains that manufacturers produce vanilla extract by macerating and percolating vanilla pods in water and ethanol, while they can formulate vanilla flavor using other permitted compounds. This distinction creates a clear difference between extract-led product positioning and broader vanilla flavor systems. Fermentation-based vanillin provides an additional option, as microorganisms can convert natural precursors into vanillin. The vanilla flavor market is therefore likely to retain a substantial synthetic base, while natural and bio-based alternatives gain relevance across selected applications.



By Form:
Liquid Retains Broad Utility While Paste Serves Premium Baking UsesLiquid vanilla is projected to account for 47.27% of the vanilla flavor market share in 2026. Liquid formats remain widely used because they are compatible with beverage, dairy, and large-scale bakery applications. They enable easy dosing and integration into liquid or semi-liquid product bases. Extraction methods also influence the final sensory profile and application suitability. IFF identifies alcohol extraction, alcohol-free extraction, oleoresins, concentrates, and tailored delivery systems as options available to formulators. These factors support the continued use of liquid vanilla in applications where solubility and process compatibility are priorities.
Paste vanilla is forecast to grow at a CAGR of 6.69% through 2032. It is used in baking-intensive applications where visual appeal, aromatic intensity, and a concentrated flavor profile are important to the finished product. Artisan bakeries and specialty dessert producers use paste vanilla in exposed applications, such as fillings, ganaches, and mousse desserts. Powder vanilla remains relevant for dry mixes, protein powders, beverage premixes, and compound systems that require moisture control. When selecting a vanilla format, formulators must evaluate heat stability, fat content, product matrix, and shelf life. The vanilla flavor market size for paste applications is supported by the demand for differentiated sensory outcomes in premium bakery and dessert products.

By Application:
Bakery Provides Scale While Dairy Offers Faster GrowthBakery and confectionery are projected to account for 37.45% of the vanilla flavor market size in 2026. Manufacturers use vanilla in cakes, cookies, chocolates, pastry creams, dessert fillings, and coatings. Its broad consumer acceptance enables manufacturers to maintain familiar product profiles while introducing regional or premium variations. Kerry identifies vanilla as a mainstream flavor and a suitable base for seasonal product development. According to IFF, vanilla can also soften eggy or floury notes in cake applications. These applications support vanilla’s stable role in both industrial and artisan bakery production.
Dairy products are forecast to grow at a CAGR of 7.56% through 2032. Ice cream, yogurt, protein-enriched beverages, and plant-based dairy alternatives create multiple demand avenues for vanilla flavoring. IFF reports that vanilla can balance bitterness, reduce harsh notes, and enhance creaminess in product systems containing protein, fiber, or high-intensity sweeteners. This functionality is particularly valuable in dairy alternatives, where certain plant bases may produce beany or astringent notes. Savory foods, beverages, soups, pasta, and noodles remain smaller application areas; however, formulators are exploring vanilla as a subtle sweetness enhancer and masking agent. The vanilla flavor market benefits when vanilla serves as both a recognizable flavor and a functional component of a broader sensory system.
Geography Analysis
North America: Established Food Manufacturing and Traceable Sourcing
North America is projected to hold a 34.71% share of the vanilla flavor market in 2026. Large-scale food and beverage manufacturing operations drive demand across bakery, ice cream, snacks, functional beverages, and dairy products. Strong consumer preference for familiar flavors also supports vanilla’s use across retail price tiers. Manufacturers increasingly prioritize traceability and product documentation when selecting vanilla ingredients. IFF identifies regional flavor regulations, natural flavor labeling standards, halal and kosher requirements, and carrier systems as key formulation considerations. Consequently, technical support and reliable documentation are critical for suppliers serving the North American vanilla flavor market.
Asia-Pacific: Dairy, Desserts, and Local Supply Interest
Asia-Pacific is forecast to grow at a CAGR of 6.75% through 2032, representing the fastest regional growth rate in the vanilla flavor market. China, India, Japan, and Southeast Asian countries are expanding the use of vanilla in packaged bakery products, ice cream, dairy products, and foodservice desserts. The source material identifies vanilla as a leading ice cream flavor in China and India. IFF notes that vanilla can be adapted to different product bases and processing conditions, which is valuable as regional producers develop dairy-based and plant-based beverages. Demand for premium desserts and branded packaged foods is supporting the broader use of familiar vanilla flavor profiles. Manufacturers in the region can differentiate their offerings through localized product concepts while maintaining the reliability of a widely recognized flavor.
Europe, South America, and Middle East and Africa: Premium Uses and Foodservice Expansion
Europe demonstrates demand for traceable extracts and premium vanilla profiles in bakery and confectionery applications, particularly across established food markets. Suppliers serving the region must comply with labeling requirements, origin documentation, and product claims across multiple national markets. The supplied material also highlights demand from premium foodservice and hospitality channels in Gulf countries, particularly the United Arab Emirates and Saudi Arabia. South America presents additional opportunities through expanding consumption of packaged foods, dairy products, and confectionery. According to Borregaard’s company assessment, lignin-based bio-vanillin offers traceability and a lower carbon footprint than fossil-based alternatives. These attributes may influence procurement decisions that prioritize supply reliability, origin documentation, and sustainability requirements.
Competitive Landscape
Market Concentration
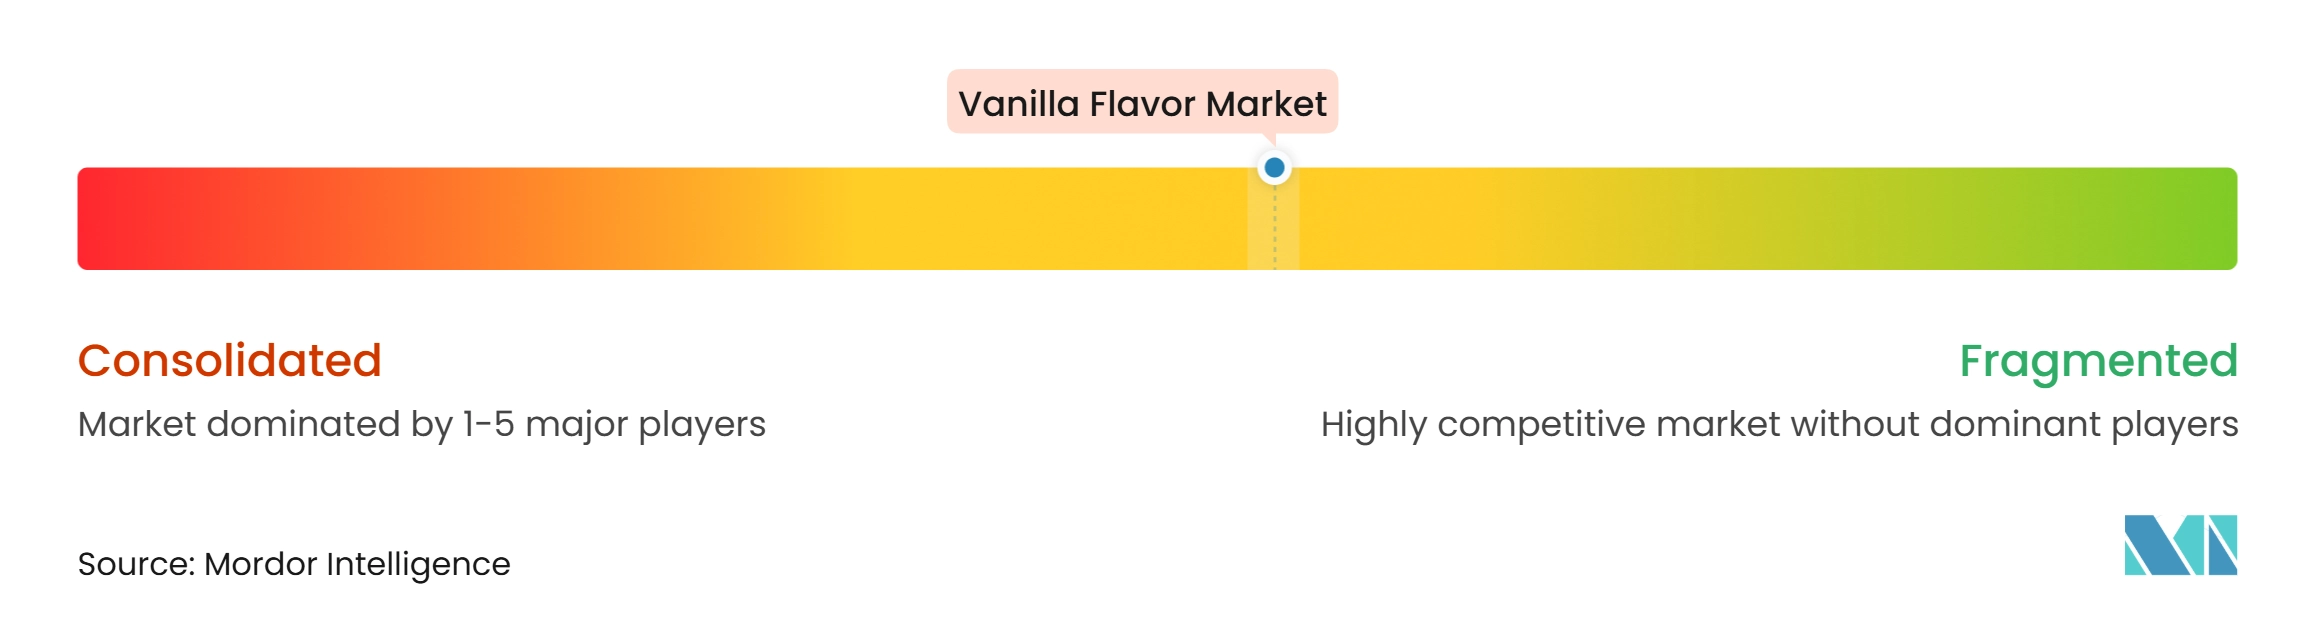
The vanilla flavor market includes global flavor houses, vanilla specialists, and bio-based vanillin producers. Givaudan, IFF, Symrise, and dsm-firmenich compete through flavor development capabilities, customer relationships, sourcing networks, and application support. Nielsen-Massey Vanillas, PROVA, Eurovanille, and Heilala Vanilla focus more specifically on vanilla origin, extraction, and premium product positioning. This supplier mix provides food manufacturers with options ranging from standardized, high-volume vanillin to traceable vanilla extracts. Competitive positioning depends on supply continuity, sensory performance, labeling support, and application-specific guidance. The supplied information does not provide the combined market share of leading companies; therefore, the market concentration score cannot be linked to a verified market share threshold.
dsm-firmenich states that it is the second-largest processor of vanilla beans and purchases 10–15% of the world’s vanilla bean supply. The company also cites a partner network in Madagascar, Uganda, and Indonesia that supports supply risk management and traceability. This integrated approach connects curing, extraction, and flavor formulation within a single value chain. IFF competes through customized vanilla design and reformulation support across food and beverage applications. These strategies make technical service and access to vanilla origins important competitive factors, in addition to production scale.
Bio-based vanillin suppliers offer an additional competitive route. Borregaard describes lignin-based bio-vanillin as a renewable and traceable alternative to fossil-based vanillin while emphasizing reliable production conditions. For 2025, Borregaard projects high biovanillin deliveries in the fourth quarter and improved full-year BioSolutions results compared with 2024. Specialized suppliers can compete through origin specificity and premium positioning, while larger flavor houses can combine multi-origin sourcing with formulation infrastructure. The vanilla flavor market will continue to favor suppliers that provide customers with clear options for flavor profile, labeling, reliability, and cost. The market concentration score remains unassigned because the supplied information does not provide the combined market share required under the scoring framework.
Vanilla Flavor Industry Leaders
-
Givaudan SA
-
International Flavors & Fragrances Inc. (IFF)
-
Symrise AG
-
dsm-firmenich AG
-
Kerry Group plc
- *Disclaimer: Major Players sorted in no particular order
Vanilla Flavor Market Companies Covered in this Report
- Givaudan SA
- International Flavors & Fragrances Inc. (IFF) (IFF)
- Symrise AG
- dsm-firmenich AG
- McCormick & Company, Inc.
- Kerry Group plc
- ADM (Archer Daniels Midland Company)
- Sensient Technologies Corporation
- Nielsen-Massey Vanillas, Inc.
- PROVA SAS
- Eurovanille
- Virginia Dare
- Heilala Vanilla Limited
- Rodelle Inc.
- Adams Extract & Spice, LLC
- Lochhead Manufacturing Company
- Borregaard AS
- Syensqo SA
- Synthite Industries Ltd.
- Tharakan and Company
Recent Industry Developments in Vanilla Flavor Market
- July 2026: LBB Specialties became Borregaard’s authorized distributor for BioVanillin in the United States and Canada. The agreement expanded access to wood-based vanillin made from Norway spruce, offering formulators a renewable ingredient with 90% lower carbon emissions than petroleum-derived vanillin.
- March 2026: Lallemand launched Hevani, a natural vanillin ingredient produced through precision fermentation using yeast and renewable glucose feedstock. The ingredient offered manufacturers a 98%-pure, climate-independent alternative to conventional vanillin and vanilla beans for bakery, confectionery, and dairy formulations at commercial scale.
- June 2025: Flavorchem introduced The Art of Vanilla, a premium ingredient portfolio featuring organic, clean-label, and sustainably produced extracts. It also highlighted zero-waste extraction and complementary taste-modulation solutions, giving food and beverage manufacturers additional formulation options across dairy, bakery, and beverage applications.
Global Vanilla Flavor Market Report Scope
Vanilla flavor is a sweet, warm, and aromatic taste and scent derived primarily from the bean pods of the tropical vanilla orchid (Vanilla planifolia or Vanilla tahitensis) or replicated through chemical synthesis. The vanilla flavor market report is segmented by type, form, application, and geography. By type, the market is segmented into natural and synthetic. By form, the market is segmented into liquid, powder, and paste. By Application, the market is segmented into bakery and confectionery, dairy products, savory foods, soups, pastas and noodles, beverages, and other applications. By geography, the market is segmented into North America, Europe, Asia-Pacific, South America, Middle East and Africa. The market forecasts are provided in terms of value (USD) and volume.
Segmentation Overview
| Natural |
| Synthetic |
| Liquid |
| Powder |
| Paste |
| Bakery and Confectionery |
| Dairy Products |
| Savory Foods |
| Soups, Pastas, and Noodles |
| Beverages |
| Other Applications |
| North America | United States |
| Canada | |
| Mexico | |
| Rest of North America | |
| Europe | United Kingdom |
| Germany | |
| France | |
| Italy | |
| Spain | |
| Sweden | |
| Belgium | |
| Poland | |
| Netherlands | |
| Rest of Europe | |
| Asia-Pacific | China |
| Japan | |
| India | |
| Thailand | |
| Singapore | |
| Indonesia | |
| South Korea | |
| Australia | |
| Rest of Asia-Pacific | |
| South America | Brazil |
| Argentina | |
| Colombia | |
| Peru | |
| Chile | |
| Rest of South America | |
| Middle East and Africa | United Arab Emirates |
| South Africa | |
| Saudi Arabia | |
| Nigeria | |
| Egypt | |
| Morocco | |
| Turkey | |
| Rest of Middle East and Africa |
| By Type | Natural | |
| Synthetic | ||
| By Form | Liquid | |
| Powder | ||
| Paste | ||
| By Application | Bakery and Confectionery | |
| Dairy Products | ||
| Savory Foods | ||
| Soups, Pastas, and Noodles | ||
| Beverages | ||
| Other Applications | ||
| By Geography | North America | United States |
| Canada | ||
| Mexico | ||
| Rest of North America | ||
| Europe | United Kingdom | |
| Germany | ||
| France | ||
| Italy | ||
| Spain | ||
| Sweden | ||
| Belgium | ||
| Poland | ||
| Netherlands | ||
| Rest of Europe | ||
| Asia-Pacific | China | |
| Japan | ||
| India | ||
| Thailand | ||
| Singapore | ||
| Indonesia | ||
| South Korea | ||
| Australia | ||
| Rest of Asia-Pacific | ||
| South America | Brazil | |
| Argentina | ||
| Colombia | ||
| Peru | ||
| Chile | ||
| Rest of South America | ||
| Middle East and Africa | United Arab Emirates | |
| South Africa | ||
| Saudi Arabia | ||
| Nigeria | ||
| Egypt | ||
| Morocco | ||
| Turkey | ||
| Rest of Middle East and Africa | ||
Key Questions Answered in the Report
What is the projected value of the vanilla flavor market by 2032?
The vanilla flavor market is forecast to reach USD 998.61 million by 2032, growing at a 5.24% CAGR from 2027.
Which vanilla flavor type has the largest share?
Synthetic vanilla flavoring held 72.34% of the market in 2026 because high-volume producers value consistent quality and reliable supply.
Which application is expected to grow fastest?
Dairy products are expected to grow at a 7.56% CAGR through 2032, supported by ice cream, high-protein products, and plant-based beverages.
Why is vanilla used in high-protein products?
Vanilla can soften bitter, metallic, fibrous, or beany notes and can support perceived sweetness and creaminess in complex formulations.