US Non Fuel Grade Alcohol Market Size and Share
Market Overview
| Study Period | 2021 - 2031 |
|---|---|
| Forecast Data Period | 2026 - 2031 |
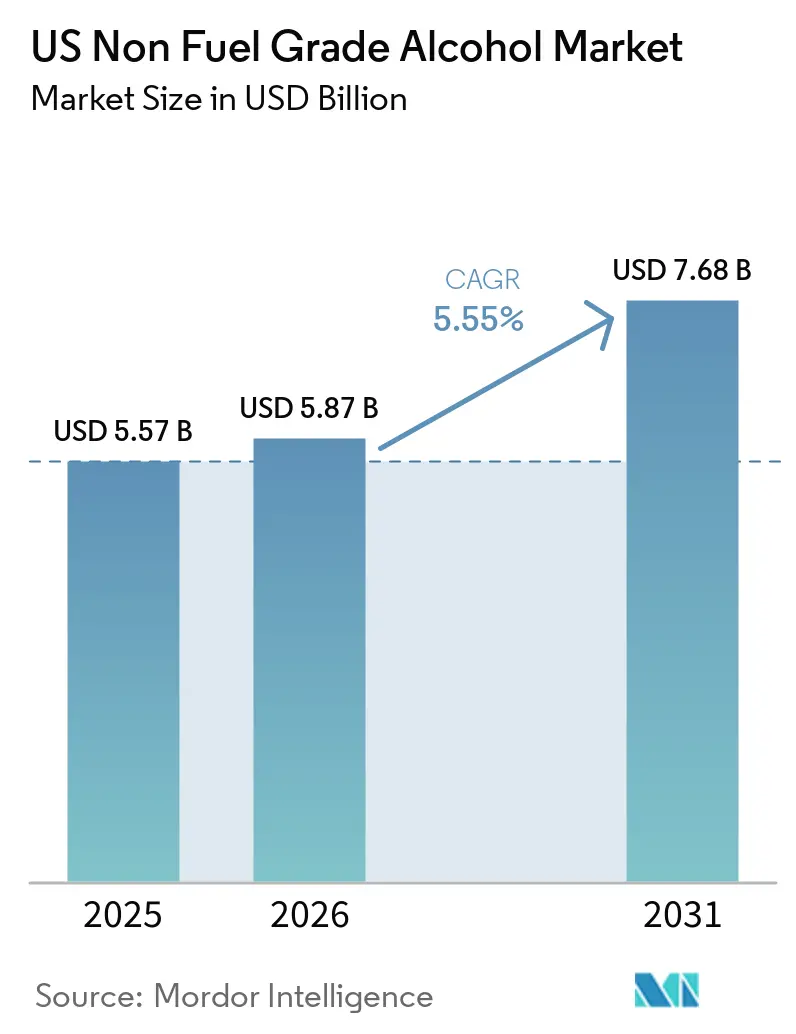
| Base Year Market Size (2025) | USD 5.57 Billion |
| Market Size (2026) | USD 5.87 Billion |
| Market Size (2031) | USD 7.68 Billion |
| Growth Rate (2026 - 2031) | 5.55% CAGR |
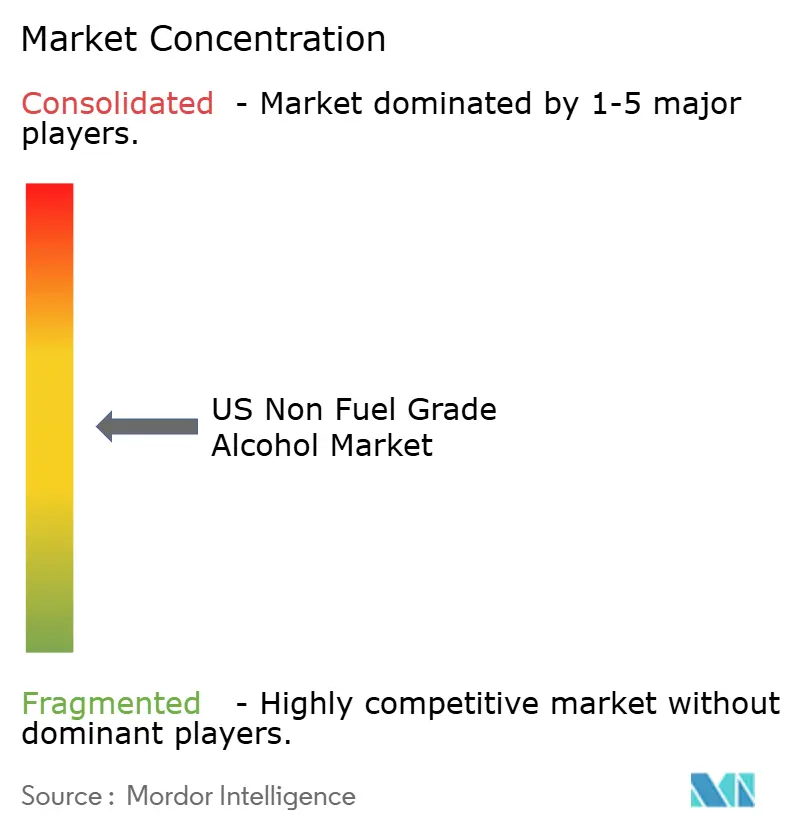
| Market Concentration | Medium |
Major Players
*Disclaimer: Major Players sorted in no particular order Image © Mordor Intelligence. Reuse requires attribution under CC BY 4.0. |
|
US Non Fuel Grade Alcohol Market Analysis by Mordor Intelligence
The US non-fuel grade alcohol market was valued at USD 5.57 billion in 2025 and reached USD 5.87 billion in 2026, with projections indicating growth to USD 7.68 billion by 2031 at a CAGR of 5.55% during 2026–2031. Unlike fuel-grade ethanol, this market's growth is driven by factors such as purity certification, regulatory compliance, and application-specific performance, rather than blending mandates or renewable obligation targets. Three key factors are shaping the market: the increasing premiumization of distilled spirits and ready-to-drink (RTD) beverages, the expansion of domestic pharmaceutical manufacturing with a focus on traceable solvent sourcing, and growing consumer and regulatory demand in the food and personal care industries for bio-based, clean-label inputs.
Key Report Takeaways
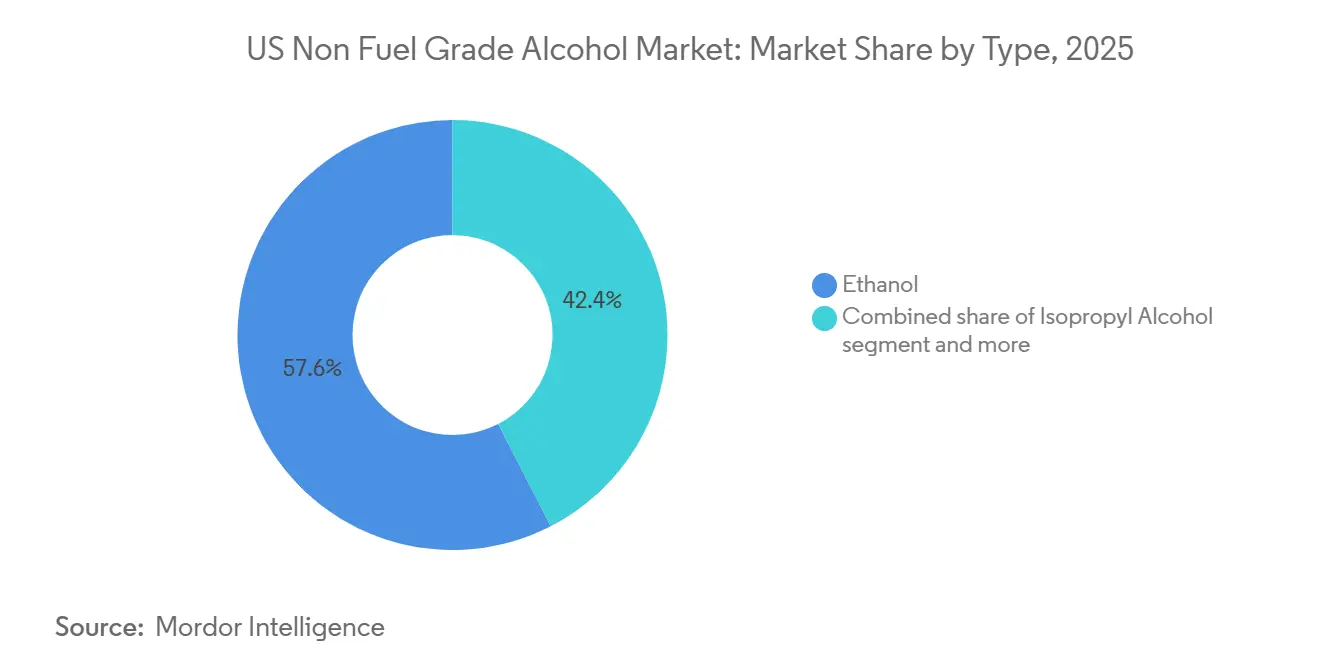
- By type, the ethanol segment accounted for 57.56% of 2025 revenue, while isopropyl alcohol will post a 6.94% CAGR through 2031.
- By grade, food grade led with 36.81% in 2025; pharmaceutical grade recorded the fastest 7.13% CAGR to 2031.
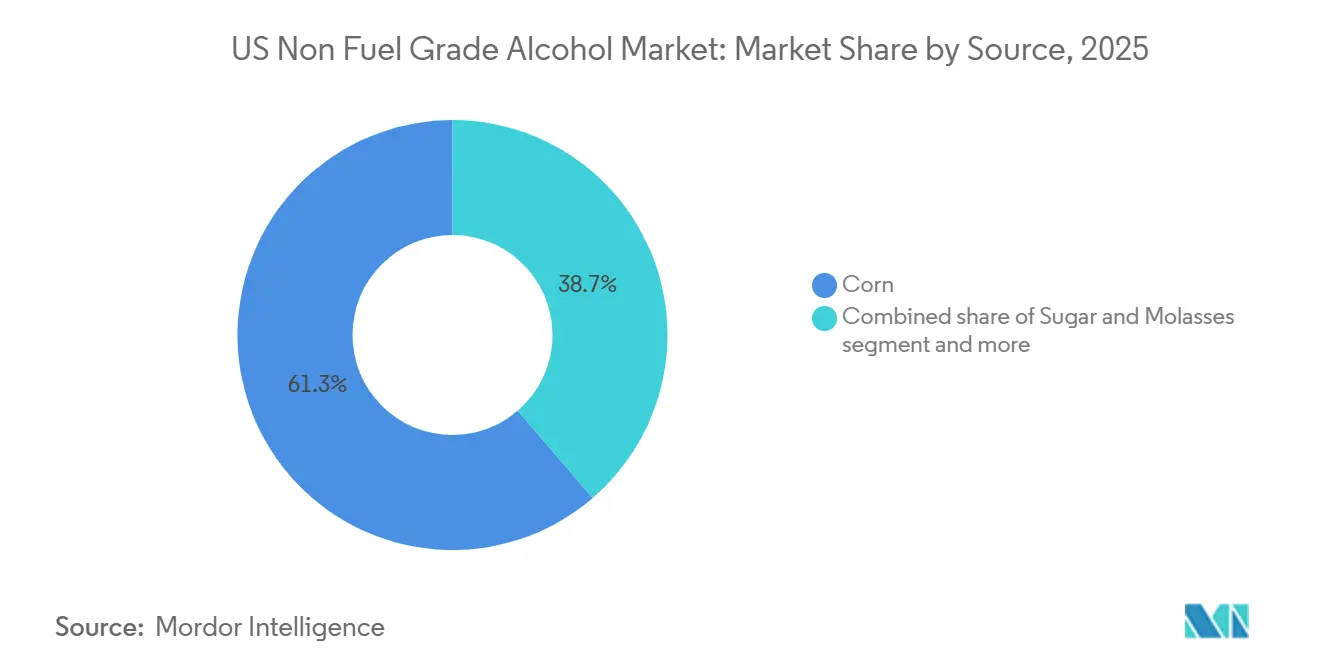
- By source, corn accounted for 61.31% of 2025 demand, whereas sugar and molasses are forecast to grow at a 7.06% CAGR through 2031.
- By application, food and beverages accounted for 32.24% of 2025 sales, while pharmaceuticals will expand at a 7.18% CAGR through 2031.
Note: Market size and forecast figures in this report are generated using Mordor Intelligence’s proprietary estimation framework, updated with the latest available data and insights as of January 2026.
US Non Fuel Grade Alcohol Market Trends and Insights
Drivers Impact Analysis*
| Driver | (~) % Impact on CAGR Forecast | Geographic Relevance | Impact Timeline |
|---|---|---|---|
| Premiumization of craft and specialty alcohol products | +1.0% | National, concentrated in Midwest, Kentucky, New York, California | Short term (≤ 2 years) |
| Expansion of personal care and cosmetics formulations | +0.8% | Coastal markets – Northeast, California, Texas | Medium term (2-4 years) |
| Increasing adoption in food and beverage processing applications | +0.9% | National, with early gains in Midwest and Southeast | Short term (≤ 2 years) |
| Rising pharmaceutical and nutraceutical manufacturing activity | +1.1% | Northeast (NJ, PA, NY), Indiana, NC – national spill-over | Medium term (2-4 years) |
| Increasing demand for bio-based solvents and green chemistry | +0.7% | National, early gains in Midwest ethanol corridor and Gulf Coast | Medium term (2-4 years) |
| Tightening preference for renewable feedstocks and lower-carbon processing | +0.6% | Midwest corn belt, commercial spillover to Gulf Coast | Long term (≥ 4 years) |
| Source: Mordor Intelligence | |||
Premiumization of craft and specialty alcohol products
The premiumization of craft and specialty alcohol products has become a significant growth driver in the U.S. non-fuel alcohol market. Manufacturers are increasingly incorporating high-purity alcohols into premium beverages, artisanal flavor extracts, specialty ingredients, and high-end food applications. Consumers are prioritizing products that deliver superior quality, authenticity, and enhanced sensory experiences, prompting brands to focus on premium formulations and higher-grade alcohol ingredients. This trend has boosted the demand for food-grade and specialty alcohols, enabling product differentiation and premium positioning within the food and beverage industry. This growth driver is further reinforced by shifting consumer spending preferences. In 2024, 67% of global consumers reported a willingness to pay more for higher-quality products, while 63% expressed readiness to pay a premium for convenience [1]Source: CMS, "National Health Expenditures; Aggregate and Per Capita Amounts", cms.gov.
Expansion of personal care and cosmetics formulations
The growth of personal care and cosmetics formulations is a key factor driving the U.S. non-fuel alcohol market. Alcohols such as ethanol and isopropyl alcohol are extensively used in products like perfumes, deodorants, skincare items, hair care formulations, and cosmetic sprays. These alcohols function as solvents, preservatives, and carriers, contributing to product stability, texture, and performance. This trend is bolstered by increasing consumer spending on beauty and personal care products. In 2025, consumer expenditure on cosmetics and personal care products reached approximately EUR 38.3 billion, highlighting robust global demand for beauty and grooming solutions [2]Source: NZMP, "Three consumer trends to track in 2025", nzmp.com. As brands continue to develop new formulations emphasizing efficacy, convenience, and premium experiences, the demand for non-fuel alcohols as critical formulation components is anticipated to remain strong, driving market growth within the personal care and cosmetics industry.
Increasing adoption in food and beverage processing applications
The growing use of non-fuel alcohols in food and beverage processing applications is driving market growth in the United States. These alcohols serve various functions, including acting as solvents, preservatives, processing aids, and extraction agents. Ethanol, in particular, is extensively utilized in flavor extraction, food ingredient processing, beverage production, and preservation due to its effectiveness, regulatory approval, and compatibility with food-grade formulations. As manufacturers focus on developing innovative food and beverage products with improved taste, quality, and shelf life, the demand for high-purity non-fuel alcohols is anticipated to rise. Furthermore, the expansion of processed foods, premium beverages, and specialty ingredient formulations continues to reinforce the importance of non-fuel alcohols within the food and beverage value chain.
Increasing demand for bio-based solvents and green chemistry
The growing demand for bio-based solvents and green chemistry is a key factor driving the U.S. non-fuel alcohol market. Industries are increasingly prioritizing renewable and environmentally sustainable alternatives to petroleum-based chemicals. Alcohols, such as ethanol, are widely utilized as bio-based solvents in sectors including pharmaceuticals, personal care products, food processing, coatings, and industrial applications. This is due to their lower environmental impact and alignment with sustainability goals. Additionally, consumer preference for sustainable products is reinforcing this trend. In 2025, 49% of Americans reported purchasing an environmentally friendly product within the previous month, up from 43% in August [3]Source: Trellis, Survey: Nearly half of U.S. consumers say they buy sustainable products", trellis.net. The increasing demand for eco-friendly products is encouraging manufacturers to incorporate bio-based ingredients and adopt greener production methods, thereby boosting the use of non-fuel alcohols as renewable solvents across diverse consumer and industrial applications.
Restraints Impact Analysis*
| Restraint | (~) % Impact on CAGR Forecast | Geographic Relevance | Impact Timeline |
|---|---|---|---|
| Feedstock price volatility in corn, grains, and sugar inputs | -0.6% | Midwest production corridor, national cost pass-through | Short term (≤ 2 years) |
| Complex regulatory and quality compliance requirements | -0.4% | National – all production and end-use geographies | Medium term (2-4 years) |
| Competition from alternative solvents and synthetic ingredients | -0.5% | National, concentrated in industrial and cosmetics segments | Medium term (2-4 years) |
| High capital and operating costs associated with high-purity alcohol production | -0.4% | Midwest (ethanol), Gulf Coast (IPA/butanol), Northeast (pharma) | Long term (≥ 4 years) |
| Source: Mordor Intelligence | |||
Feedstock price volatility in corn, grains, and sugar inputs
Feedstock price volatility in corn, grains, and sugar inputs serves as a significant restraint on the U.S. non-fuel alcohol market. The production of ethanol and other fermentation-based alcohols is highly dependent on agricultural raw materials. Prices of these inputs are influenced by factors such as weather conditions, crop yields, input costs, trade policies, and supply-demand imbalances. These fluctuations can substantially impact production costs and profit margins for manufacturers, introducing uncertainty throughout the value chain. Increasing feedstock costs can undermine the cost competitiveness of non-fuel alcohols, especially in price-sensitive applications like food processing, industrial solvents, and personal care products. Furthermore, unpredictable raw material pricing complicates procurement planning and long-term supply agreements, restricting manufacturers' ability to sustain stable pricing and operational efficiency. Consequently, feedstock price volatility continues to pose a persistent challenge for market participants dependent on agricultural inputs.
Complex regulatory and quality compliance requirements
Complex regulatory and quality compliance requirements pose a significant challenge to the U.S. non-fuel alcohol market. Manufacturers must comply with stringent standards related to production, handling, purity, labeling, and end-use applications. Non-fuel alcohols used in food, beverage, pharmaceutical, and personal care products are subject to strict oversight by regulatory agencies, necessitating ongoing monitoring, documentation, testing, and certification to meet safety and quality standards. Adhering to these regulatory requirements increases operational complexity and compliance costs, particularly for manufacturers serving multiple end-use industries with diverse specifications. Companies are required to invest in quality assurance systems, testing infrastructure, and regulatory expertise to sustain market access and maintain customer trust. These additional costs and administrative demands can hinder scalability, prolong product approval processes, and create entry barriers for smaller producers, thereby constraining overall market growth.
*Our forecasts treat driver/restraint impacts as directional, not additive. The impact forecasts reflect baseline growth, mix effects, and variable interactions.
Segment Analysis
By Type: Ethanol Dominates; IPA Advances in High-Value Purity Tiers
In 2025, ethanol held the largest share of the U.S. non-fuel alcohol market at 57.56%, driven by its widespread use in pharmaceuticals, food and beverage processing, personal care products, and industrial solvent applications. Its leading position is attributed to robust bio-based production capacity, broad regulatory acceptance, and its versatile functionality as a solvent, preservative, and chemical feedstock. The scalability of ethanol production and its integration into both consumer and industrial value chains have solidified its status as the dominant non-fuel alcohol in the U.S. market.
Conversely, isopropyl alcohol represented a 6.94% share of the market in 2025, primarily due to its essential role in disinfectants, sanitizers, pharmaceuticals, electronics cleaning, and industrial applications. Its rapid evaporation rate and strong antimicrobial properties make it particularly suitable for hygiene and precision cleaning purposes. Although its market size is smaller compared to ethanol due to its more specialized applications, demand remains supported by increasing hygiene standards, healthcare consumption, and industrial cleaning needs across various end-use sectors.


By Grade: Food Grade Anchors Revenue; Pharma Grade Leads Growth
In 2025, the food-grade segment held the largest share of the U.S. non-fuel alcohol market at 36.81%, primarily due to its extensive application in food processing, beverage production, flavor extraction, and as a processing aid in packaged food products. This dominance is attributed to strong demand from the food and beverage industry, where ethanol is commonly used for formulation, preservation, and extraction purposes. The segment also benefits from established regulatory approvals and consistent demand across large-scale food manufacturing operations.
In comparison, the pharmaceutical-grade segment accounted for a 7.13% share in 2025, driven by its essential role in drug formulation, antiseptics, sanitizers, and other medical applications requiring high purity standards. Growth in this segment is supported by increasing healthcare consumption, heightened hygiene awareness, and the expansion of pharmaceutical manufacturing activities. However, its market share remains smaller than that of food grade due to its narrower range of applications and stricter compliance requirements, which limit scalability across broader industrial uses.
By Source: Corn Underpins Supply; Sugar and Molasses Gains Share
In 2025, corn represented the largest share of the U.S. non-fuel alcohol market at 61.31%, attributed to its widespread availability, established agricultural supply chain, and cost-effective fermentation processes. The scalability of corn-based ethanol production in the U.S. is supported by extensive corn cultivation, advanced processing infrastructure, and strong integration within the biofuel and industrial alcohol value chain. This dominance is further reinforced by a consistent supply of raw materials and mature production technologies that deliver high yields and economic efficiency.
In comparison, sugar and molasses accounted for a 7.06% share in 2025, primarily due to their use as alternative carbohydrate feedstocks in fermentation-based alcohol production. These feedstocks offer benefits such as easier fermentability and suitability for specific specialty applications. However, their share remains limited because of lower domestic availability in the U.S. and a higher reliance on imports. Consequently, sugar and molasses are niche feedstocks, utilized selectively in certain industrial and specialty alcohol production processes.
By Application: Food and Beverages Lead; Pharmaceuticals Fastest Growing
In 2025, the food and beverages segment held the largest share of the U.S. non-fuel alcohol market at 32.24%. This dominance was attributed to the extensive use of ethanol as a processing aid, solvent, and preservative in food manufacturing and beverage production. The segment's growth is supported by significant demand from the packaged food, flavor extraction, and beverage industries, where alcohol is essential for formulation, preservation, and ingredient processing. Additionally, established regulatory acceptance and the expanding processed food sector further bolster its position in the market.
In comparison, the pharmaceuticals segment accounted for a 7.18% share in 2025. This segment's growth is driven by the use of high-purity alcohols in drug formulation, antiseptics, sanitizers, and other medical-grade applications. Factors such as increasing healthcare demand, heightened hygiene awareness, and the expansion of pharmaceutical manufacturing activities in the U.S. contribute to its development. However, its market share remains smaller due to the specialized and controlled usage requirements, which limit volume consumption compared to the broader food and beverages segment.
Geography Analysis
The US non-fuel grade alcohol market is geographically divided between a production-focused Midwest and a consumption-driven coastal region. The Midwest serves as the core of national supply, with PADD 2 hosting 177 out of the nation's 191 ethanol plants as of January 2025. These plants have a combined capacity of 17,463 million gallons per year, representing 94.5% of the total US capacity, according to the US Energy Information Administration (2025). States such as Iowa, Illinois, Nebraska, Indiana, Ohio, and South Dakota dominate fermentation-based alcohol production, leveraging proximity to corn supplies, established rail and truck logistics networks, and years of advancements in conversion efficiency.
The Gulf Coast region, including Texas, Louisiana, and neighboring Gulf states, is the primary production center for petrochemical-derived alcohol grades. This area specializes in the production of isopropyl alcohol (IPA) and butanol through propylene-based processes. These petrochemical hubs play a significant role in meeting demand for industrial-grade alcohol, thanks to well-established infrastructure and access to raw materials.
The Northeast, led by states like New Jersey, Pennsylvania, and New York, along with emerging biotech and pharmaceutical hubs in North Carolina and Indiana, serves as the main consumption area for pharmaceutical-grade alcohol. These regions house US Contract Development and Manufacturing Organization (CDMO) clusters and biopharmaceutical manufacturing facilities, driving demand for USP-certified, traceable pharmaceutical-grade solvents. The co-location of these facilities with key consumption zones ensures efficient procurement and supply chain operations.
Competitive Landscape
The US non-fuel grade alcohol market is moderately concentrated. Integrated grain processors such as ADM, Cargill, and Valero supply high-volume commodity food-grade ethanol, while specialty-grade producers like Greenfield Global, MGP Ingredients, and Grain Processing Corporation compete based on purity certification, grade variety, and supply reliability. In the IPA and butanol segments, petrochemical companies including ExxonMobil, Dow, INEOS, and LyondellBasell maintain dominance, benefiting from Gulf Coast propylene integration, which provides a feedstock cost advantage.
The certified bio-based pharmaceutical-grade ethanol segment is experiencing rapid demand growth driven by CDMO and hospital formulary requirements for domestically produced, USP-compliant, low-carbon ethanol. This segment remains underserved due to limited dedicated specialty supply. Additionally, the RTD co-packing channel is emerging as a significant B2B demand segment for large volumes of food-grade ethanol outside traditional spirits distilleries. Large commodity ethanol producers, however, have yet to fully commercialize this opportunity at scale.
Disruption risk from smaller fermentation-technology entrants exists but is moderated by the high capital requirements for USP- or FCC-grade purification equipment and the need for FDA CGMP site qualification. These factors act as barriers to rapid scaling, limiting the immediate impact of new entrants in the market. As a result, established players continue to hold a competitive advantage in meeting the growing demand for specialty-grade alcohol products.
US Non Fuel Grade Alcohol Industry Leaders
-
Cargill, Incorporated
-
Eastman Chemical Company
-
Dow Inc.
-
Eastman Chemical Company
-
Exxon Mobil Corporation
- *Disclaimer: Major Players sorted in no particular order

Recent Industry Developments
- March 2026: INEOS Acetyls and Sandpiper Chemicals came into a strategic partnership in the low-carbon methanol sector, focusing on the development of a USD 1.7 billion integrated production facility in Texas City, USA. The partnership aims to construct a large-scale plant with a production capacity of approximately 1.1 million tonnes per annum of low-carbon methanol. The facility will utilize natural gas combined with advanced carbon capture and storage (CCS) technology to significantly reduce carbon intensity.
- September 2025: Green Plains Inc. entered into an agreement with Freepoint Commodities to monetize 45Z Clean Fuel Production Tax Credits generated from its 2025 ethanol production in Nebraska. These credits are associated with low-carbon intensity ethanol output from three facilities and are being transferred through a structured tax credit purchase agreement under the framework of the U.S. Inflation Reduction Act.
- March 2025: ExxonMobil announced the expansion of its Baton Rouge chemical complex to commence production of 99.999% ultra-high-purity isopropyl alcohol (IPA) tailored for next-generation semiconductor manufacturing. This development marks a significant upgrade of its existing IPA portfolio, transitioning from traditional industrial and sanitizer-grade alcohol to a highly specialized material essential for advanced chip fabrication, where even microscopic impurities can affect performance.


US Non Fuel Grade Alcohol Market Report Scope
| Ethanol |
| Isopropyl Alcohol |
| Methanol |
| Butanol |
| Benzyl Alcohol |
| Others |
| Food Grade |
| Pharmaceutical Grade |
| Industrial Grade/Chemical Grade |
| Corn |
| Sugar and Molasses |
| Grains (Wheat, Barley, Rye) |
| Fruits |
| Others |
| Food and Beverages |
| Pharmaceuticals |
| Cosmetics and Personal Care |
| Chemical Solvent |
| Others |
| By Type | Ethanol |
| Isopropyl Alcohol | |
| Methanol | |
| Butanol | |
| Benzyl Alcohol | |
| Others | |
| By Grade | Food Grade |
| Pharmaceutical Grade | |
| Industrial Grade/Chemical Grade | |
| By Source | Corn |
| Sugar and Molasses | |
| Grains (Wheat, Barley, Rye) | |
| Fruits | |
| Others | |
| By Application | Food and Beverages |
| Pharmaceuticals | |
| Cosmetics and Personal Care | |
| Chemical Solvent | |
| Others |


Key Questions Answered in the Report
Which type held the largest share of the U.S. non-fuel alcohol market in 2025?
Ethanol led the market with a 57.56% share due to its broad industrial and consumer applications.
Which grade dominated the market in 2025?
Food grade accounted for the largest share at 36.81%, driven by demand from food and beverage processing.
What was the leading source for non-fuel alcohol production in 2025?
Corn dominated with a 61.31% share, supported by abundant domestic availability and established fermentation infrastructure.
Which application segment was the fastest growing from 2026–2031?
Pharmaceuticals recorded the highest growth with a CAGR of 7.18%, driven by increasing healthcare and pharmaceutical manufacturing demand.
Page last updated on:


