
United States Urban Micro-Warehousing Market Size and Share
Market Overview
| Study Period | 2020 - 2031 |
|---|---|
| Forecast Data Period | 2026 - 2031 |
| Base Year Market Size (2025) | USD 5.01 Billion |
| Market Size (2026) | USD 5.58 Billion |
| Market Size (2031) | USD 9.33 Billion |
| Growth Rate (2026 - 2031) | 10.84 % |
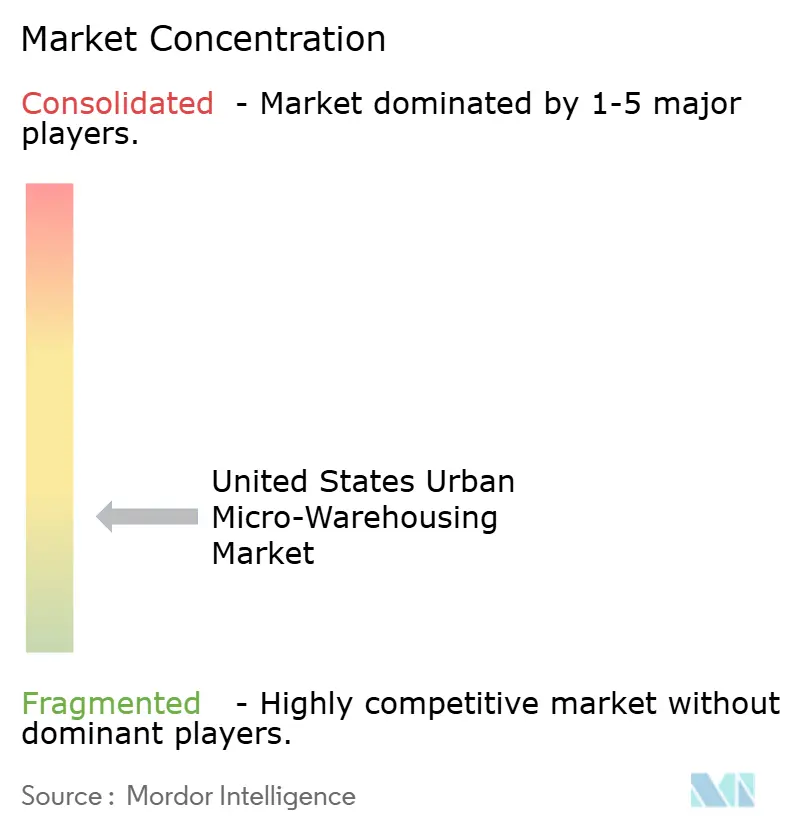
| Market Concentration | Low |
Major Players *Disclaimer: Major Players sorted in no particular order Image © Mordor Intelligence. Reuse requires attribution under CC BY 4.0. | |
United States Urban Micro-Warehousing Market Analysis by Mordor Intelligence
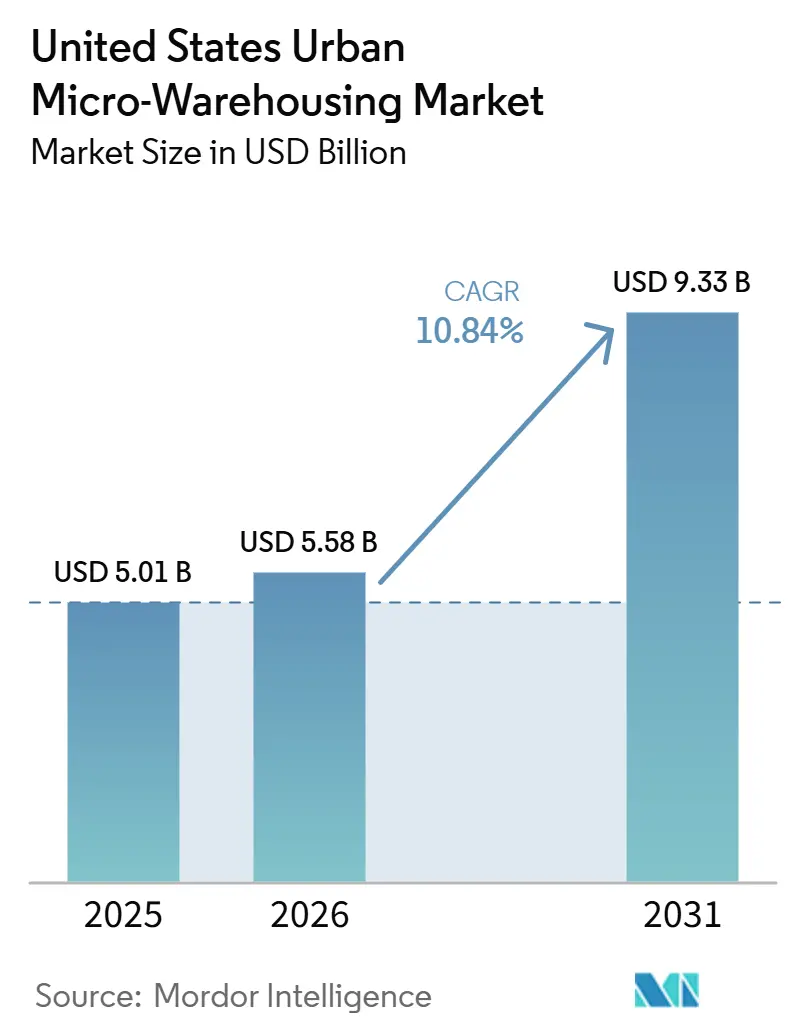
The United States urban micro-warehousing market size was valued at USD 5.01 billion in 2025 and is estimated to grow from USD 5.58 billion in 2026 to reach USD 9.33 billion by 2031, at a CAGR of 10.84% during the forecast period (2026-2031).
Demand is rising because same-day and same-hour delivery have shifted from premium services to normal consumer expectations, which is forcing retailers and 3PLs to place inventory closer to dense urban demand. United States e-commerce sales reached USD 302.3 billion in Q1 2026, keeping fulfillment networks under pressure and increasing the value of compact urban nodes that can shorten delivery distances and speed up order cycles. Another major change came from the permanent suspension of the de minimis administrative exemption for non-postal imports, which is pushing more inventory to be held domestically instead of shipped unit by unit from overseas. The United States urban micro-warehousing market is also attracting investment into automation, brownfield conversion, and site-level energy resilience because operators need faster throughput, reliable operations, and usable sites inside constrained city corridors. Competition remains fragmented, and the strongest opportunities sit with operators that can combine access to scarce urban sites, flexible fulfillment formats, and disciplined capital deployment while the broader freight cycle remains mixed[1]“May 2026 Freight Transportation Services Index TSI Fell 1.3% from April 2026 and Fell 0.3% from May 2025,” Bureau of Transportation Statistics, bts.gov.
Key Report Takeaways
- By facility type, micro-fulfillment centers held 38.14% of the United States urban micro-warehousing market share in 2025, while dark store-based fulfillment is projected to expand at a 17.75% CAGR through 2031.
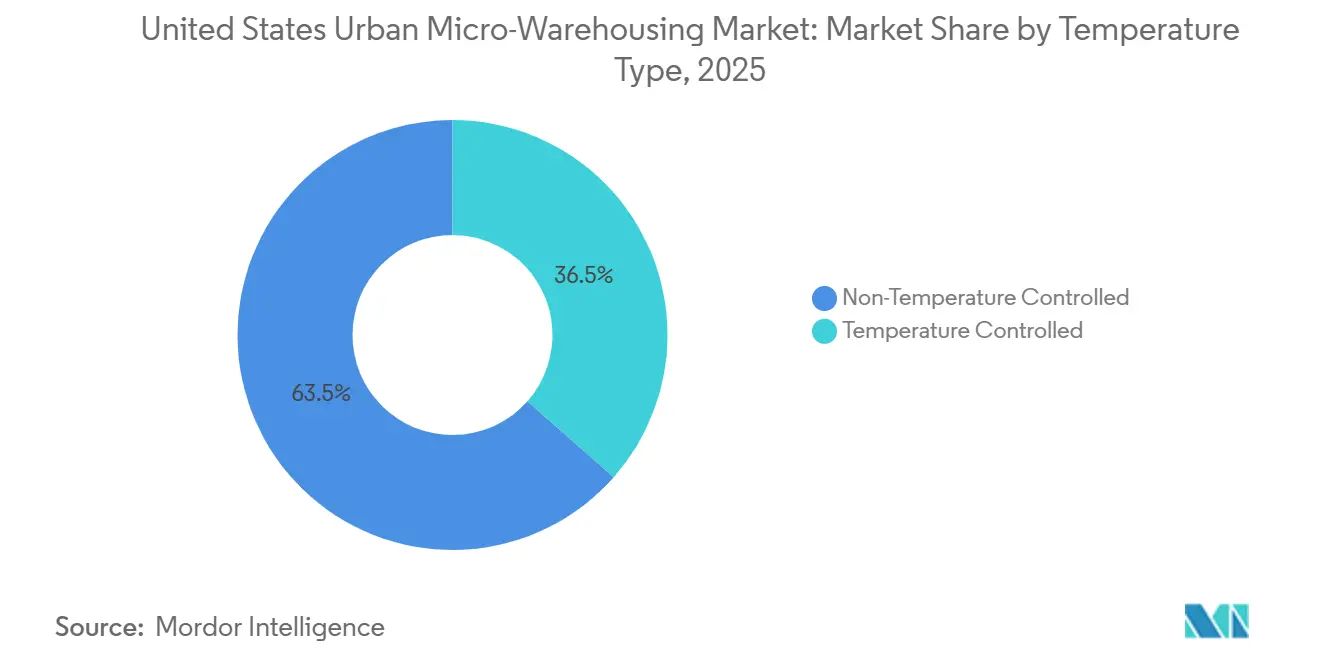
- By temperature type, non-temperature-controlled facilities accounted for 63.5% share of the United States urban micro-warehousing market size in 2025, while temperature-controlled facilities are forecast to grow at a 14.41% CAGR through 2031.
- By automation level, semi-automated facilities led the United States urban micro-warehousing market with 44.02% market share in 2025, while fully automated facilities are projected to grow at a 19.71% CAGR through 2031.
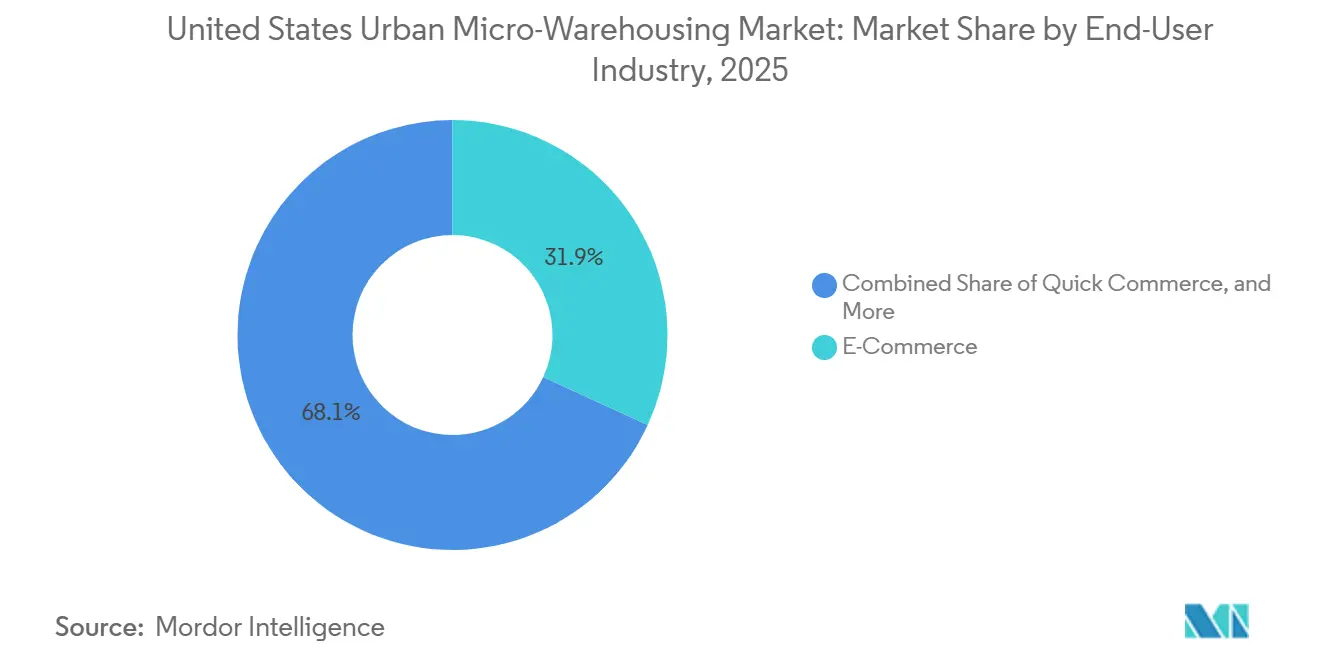
- By end-user industry, e-commerce accounted for 31.88% of the United States urban micro-warehousing market size in 2025, while quick commerce is expected to record the highest CAGR at 18.47% through 2031.
- By geography, the West captured 27.21% of the United States urban micro-warehousing market share in 2025, while the Northeast is forecast to grow at a 14.89% CAGR through 2031.
Note: Market size and forecast figures in this report are generated using Mordor Intelligence’s proprietary estimation framework, updated with the latest available data and insights as of January 2026.
United States Urban Micro-Warehousing Market Trends and Insights
Drivers Impact Analysis*
| Driver | (~) % Impact on CAGR Forecast | Geographic Relevance | Impact Timeline |
|---|---|---|---|
| Same-Day and Same-Hour Delivery Economics | +2.5% | National, highest density in Los Angeles, New York, Seattle, and Chicago | Short term (≤ 2 years) |
| Brownfield Conversion of Underused Urban Industrial Space | +1.8% | Northeast and Midwest industrial corridors, with spillover to Southeast | Medium term (2-4 years) |
| Grocery and Quick Commerce Network Density Expansion | +2.1% | National, densest in top-10 MSAs and coastal metros | Short term (≤ 2 years) |
| Labor Scarcity in Dense Metropolitan Warehousing Markets | +1.2% | National, most acute in Los Angeles, New York City, Bay Area, and Chicago | Medium term (2-4 years) |
| De-Minimis Pressure and In-Market Stocking Optimization | +1.5% | National, particularly affecting DTC brands across all major metro markets | Short term (≤ 2 years) |
| Micro-Grid and Site-Level Energy Resilience for Automated Facilities | +0.9% | West, especially California and Texas, and the Northeast corridor | Medium term (2-4 years) |
| Source: Mordor Intelligence | |||
Same-Day and Same-Hour Delivery Economics
Speed to consumer has become one of the clearest operating priorities in the United States urban micro-warehousing market. Retailers and 3PLs now need inventory within city limits or very close to them if they want to support tighter delivery windows without absorbing higher line-haul and parcel costs. The pressure is visible in broader digital retail demand, with United States e-commerce sales reaching USD 302.3 billion in Q1 2026, up 9.7% year over year[2]“EPA Awards USD 267 Million to Clean Up and Reuse Contaminated Sites,” United States Environmental Protection Agency, epa.gov. That scale makes a centralized fulfillment model less attractive for high-frequency urban orders because longer shipping zones can weaken margin on lower-ticket baskets. The United States urban micro-warehousing market benefits from compact urban nodes, which let operators shorten delivery radii, increase order cut-off flexibility, and improve inventory availability for same-day orders. As these service levels become standard rather than premium, the economics of distributed stocking become easier to justify across a broader range of retailers.
Brownfield Conversion of Underused Urban Industrial Space
Brownfield conversion is becoming one of the most practical paths to expansion in the United States urban micro-warehousing market. In May 2025, the EPA announced USD 267 million in Brownfields Grants for site assessment, cleanup, and revolving loan funds, which directly lowers part of the remediation barrier that has kept many urban infill sites dormant. The EPA also noted that its Brownfields Program has leveraged more than USD 42 billion in cleanup and redevelopment since its inception, supporting the case that public funding can unlock larger private investment in logistics. In constrained urban corridors, these parcels often represent one of the few remaining routes to add small logistics capacity without waiting for rare greenfield supply. The United States urban micro-warehousing market, therefore, favors operators that can manage cleanup timelines, local approvals, and redevelopment sequencing rather than relying only on conventional leasing strategies. This is especially relevant where older industrial districts still sit close to dense residential demand and major transport links.
Grocery and Quick Commerce Network Density Expansion
Grocery and rapid-delivery formats are adding another strong layer of demand to the United States urban micro-warehousing market. Quick commerce is the fastest-growing end-use vertical in the report, and its growth is steering investment toward dark stores and compact fulfillment nodes that can support very short delivery windows. The operating logic differs from that of large regional grocery fulfillment centers because store-adjacent or neighborhood nodes can operate with shorter delivery distances and faster assortment changes. This matters most for high-velocity perishables, convenience products, and repeat-purchase baskets that depend more on local proximity than on broad inventory depth. As order density increases in a neighborhood, delivery routing becomes more efficient, and the cost to serve each order decreases. The United States urban micro-warehousing market gains from this model because every successful node makes it easier to justify the next node in another dense urban pocket.
Labor Scarcity in Dense Metropolitan Warehousing Markets
Labor scarcity in dense metros continues to shape the operating model of the United States urban micro-warehousing market. Warehousing employment in the New York metro area stood at 29,900 in May 2026, supporting the view that tight labor availability remains a live issue in one of the country’s highest-demand logistics corridors. When hiring is difficult or wage pressure rises, operators are more willing to invest in systems that reduce repetitive floor labor and improve pick consistency[3]“EPA Region 7 Presents USD 6M to City of KCMO for Brownfields Grants,” United States Environmental Protection Agency, epa.gov. This does not remove labor from the process, but it changes where labor is used and raises the value of supervisory, technical, and exception-handling roles. The United States urban micro-warehousing market, therefore, sees labor scarcity working in 2 directions at once, constraining operations in the near term while strengthening the case for semi-automated and fully automated formats over time. The effect is strongest in large coastal and gateway metros where both demand intensity and labor costs are high.
Restraints Impact Analysis*
| Restraint | (~) % Impact on CAGR Forecast | Geographic Relevance | Impact Timeline |
|---|---|---|---|
| High Urban Real Estate Friction and Zoning Constraints | -1.8% | National, most severe in New York City, Los Angeles, Bay Area, and Portland | Long term (≥ 4 years) |
| Fire Code, Safety, and Insurance Cost Escalation for High-Density Automation | -1.2% | National, California most acute following 2025 wildfire losses | Medium term (2-4 years) |
| Limited SKU Economics for Low-Throughput Urban Sites | -0.8% | National, primarily affects Tier 2 and Tier 3 MSAs | Medium term (2-4 years) |
| Local Traffic, Curbside, and Last-Mile Delivery Bottlenecks | -1.0% | New York City, Chicago, Los Angeles, Seattle, Boston | Short term (≤ 2 years) |
| Source: Mordor Intelligence | |||
High Urban Real Estate Friction and Zoning Constraints
Real estate friction remains one of the clearest constraints on the United States urban micro-warehousing market. The most attractive delivery zones are often the same places where land is scarce, entitlements are difficult to obtain, and nearby residential uses raise opposition to new logistics projects. This makes site access a competitive advantage in itself because not every operator can wait through long approval cycles or absorb extended pre-development costs. The constraint is most acute in large coastal metros where demand is dense, but industrial land is already tightly held and rarely becomes available in small, well-located parcels. The United States urban micro-warehousing market can still grow under these conditions, but expansion tends to favor brownfield redevelopment, retrofit strategies, and incumbents with deeper local relationships. That raises entry costs and narrows the pool of players that can build meaningful urban networks at speed.
Fire Code, Safety, and Insurance Cost Escalation for High-Density Automation
Fire protection complexity is a significant restraint on the United States urban micro-warehousing market, especially in facilities that feature dense racking, automation equipment, and cold-chain infrastructure. NFPA has highlighted the emerging hazards tied to modern warehouses, and those hazards become harder to manage when layouts are customized, vertical storage is dense, and suppression access is more complicated[4]“Emerging Hazards and Fire Protection Solutions in Warehouses,” NFPA Blog, nfpa.org. The result is that some highly automated designs face a longer review path and more engineering work before they are considered insurable or operationally sound. This matters even more in cold-chain environments because temperature control, equipment density, and facility layout can widen the gap between gross operating potential and net project yield. The United States urban micro-warehousing market, therefore, rewards operators that bring fire engineering into site planning early rather than treating it as a late-stage compliance exercise. Smaller entrants can struggle because the extra design work and approval time create a cash-flow burden before the site is fully productive.
*Our forecasts treat driver/restraint impacts as directional, not additive. The impact forecasts reflect baseline growth, mix effects, and variable interactions.
Segment Analysis
By Facility Type: MFCs Lead, Dark Stores Drive the Next Demand Wave
Micro-fulfillment centers accounted for 38.14% of the United States urban micro-warehousing market share in 2025, which made them the largest facility format in the market. Their lead comes from broad usefulness across e-commerce, grocery, and FMCG flows, giving operators a format that can work across multiple demand streams. Dark-store-based fulfillment is the fastest-growing facility type, with a 17.75% CAGR through 2031, as quick commerce and dedicated e-grocery models require inventory to be closer to neighborhoods. This part of the United States urban micro-warehousing market is gaining ground because dark stores can be deployed in compact footprints and built around high-frequency baskets rather than broad regional assortment. Retail store-based fulfillment and hybrid facilities make up the remaining share and are becoming more relevant as physical retailers seek ways to use back-of-house space more productively.
The strategic split within this segment is between flexibility and capital intensity. MFCs support a wider range of categories, which helps operators balance demand variability across seasons and order profiles. Dark stores work best where order density is already proven, because their economics improve when a tight delivery radius produces repeat purchases and predictable replenishment. Hybrid facilities sit in the middle and give operators a way to test automation or add local capacity without moving immediately into a fully specialized format. That is why the United States urban micro-warehousing market continues to support more than one facility format rather than converging on a single operating model. Operators that match facility type to basket size, service promise, and neighborhood density are more likely to protect margins as networks scale.
By Temperature Type: Cold-Chain Converts Compete with Lower-Risk Ambient Nodes
Non-temperature-controlled facilities accounted for 63.5% of the United States urban micro-warehousing market size in 2025, keeping ambient nodes at the core of the market. Apparel, consumer electronics, and FMCG remain the largest urban e-commerce categories, so a large part of current demand still favors simpler facility designs and lower operating risk. Temperature-controlled sites are growing faster, at a 14.41% CAGR through 2031, because grocery delivery, pharmaceutical cold-chain needs, and meal-kit fulfillment require dedicated refrigerated capacity closer to city demand. This part of the United States' urban micro-warehousing market is expanding as operators move from general retail fulfillment into more time- and temperature-sensitive categories. A visible signal came in November 2025, when Lineage broke ground on a fully automated cold storage facility in the Dallas Metroplex, reinforcing that institutional players are still adding automation-led cold-chain capacity.
The challenge is that cold-chain expansion requires greater operational discipline and higher design complexity than ambient space. Fire protection, energy use, and equipment reliability matter more because failure carries a faster and more direct inventory-loss risk. The segment is also seeing larger capital moves, such as Americold Realty Trust’s May 2026 USD 1.3 billion joint venture with EQT covering 12 United States temperature-controlled facilities. FDA cold-chain rules for pharmaceutical storage and USDA requirements for food-grade operations further shape site design and process control in this segment. As a result, the United States urban micro-warehousing market continues to treat cold-chain as a strong growth pocket, but also as one that favors operators with deeper balance sheets, compliance capability, and technical operating discipline.


By Automation Level: Semi-Automated Dominates Today, Full Automation Closes the Gap
Semi-automated facilities accounted for 44.02% of the United States urban micro-warehousing market share in 2025, making them the current operating center of the market. They offer a practical middle ground because robotics-assisted workflows can increase throughput and accuracy without forcing every site to adopt the full complexity of fixed, high-density automation. Fully automated facilities are growing faster, at a 19.71% CAGR through 2031, as tight urban labor conditions and high service-level demands make a stronger case for deeper mechanization. The shift is supported by labor realities in key metros, including the New York area, where warehousing employment remained tight relative to demand in May 2026. Manual operations remain relevant, especially during ramp-up periods and in secondary markets where order volume has not yet reached a stable automation threshold.
The segment is also shaped by building constraints, not only by software and equipment costs. Fully automated sites need stronger electrical infrastructure, suitable floor-load ratings, and enough clear height to support denser storage and mechanical systems. That narrows the list of viable retrofit assets inside older urban industrial stock, which is one reason semi-automated formats still dominate current deployment. Over time, the United States urban micro-warehousing industry is likely to keep moving toward more intelligent slotting, tighter inventory synchronization, and more adaptive workflows even when full automation is not installed in every node. The United States urban micro-warehousing market therefore appears to be moving through an intermediate phase where operators seek labor efficiency and throughput gains without locking every site into the same capital stack. The winning model is less about chasing the highest automation label and more about matching automation depth to site constraints, basket mix, and local demand maturity.
By End-User Industry: E-Commerce Anchors Demand While Quick Commerce Accelerates
E-commerce accounted for 31.88% of the United States urban micro-warehousing market share in 2025, making it the largest demand base. Its lead is being reinforced by the suspension of the de minimis exemption because brands that once shipped direct from overseas now need domestic inventory positions that can still support fast delivery. Quick commerce is the fastest-growing end-use segment, with a 18.47% CAGR through 2031, underscoring how strongly sub-30-minute and very short-window delivery models are reshaping urban node demand. Grocery retail and FMCG remain important because they bring recurring purchase patterns that improve throughput predictability and raise the value of local inventory positioning. This part of the United States urban micro-warehousing market is expanding as each additional high-frequency use case increases the utilization of urban facilities across more hours of the day.
The next layer of growth is coming from higher-value and service-critical categories. Pharmaceuticals and healthcare are emerging because urban micro-warehousing can support same-day prescription fulfillment and rapid delivery of selected medical supplies in dense population centers. Fashion and lifestyle, consumer electronics, and food and beverage each remain meaningful because local inventory can cut delivery time and improve customer experience in categories where speed can influence conversion. Industrial and B2B distribution is still the smallest part of the segment mix, but it can be one of the more defensible pockets because business buyers often place a premium on reliability and order certainty. The United States urban micro-warehousing market benefits when these end-use categories overlap within the same metro because a shared urban network can spread fixed costs across multiple revenue streams. That multi-category demand base is one reason the market’s growth is not tied to a single retail format alone.

Geography Analysis
The West held a 27.21% share of the United States urban micro-warehousing market size in 2025, making it the leading region in terms of current revenue. That lead reflects the concentration of e-commerce activity along the California coast and the Pacific Northwest, where population density, import-linked supply chains, and digital retail penetration create steady last-mile demand. Los Angeles and Seattle remain 2 of the most important regional nodes because both combine dense consumer demand with established logistics infrastructure and limited room for easy industrial expansion. The operating environment remains difficult due to site scarcity, stricter siting requirements, and higher operating risk, which can slow new infill projects in key Western markets. Even so, the United States urban micro-warehousing market continues to favor the West because the delivery-density economics remain strong enough to support both existing networks and selective new capacity.
The Northeast is the fastest-growing region, with a 14.89% CAGR through 2031, reflecting its very high consumer concentration and short-distance delivery potential. New York remains central to that growth because it generates very large package volumes and keeps pressure on operators to shorten inventory distance from the end customer. Tight industrial supply and elevated rents make new-build options difficult, so retrofits and smaller-format conversions remain more practical than large greenfield additions in many submarkets. Brownfield pathways also matter more in this region because they offer one of the few realistic routes to add local logistics capacity inside already built-out corridors. The EPA’s funding programs support that route, including its broader May 2025 Brownfields Grants and its separate USD 6 million grant award to Kansas City for redevelopment activity that illustrates the wider public funding mechanism behind site reuse. For the United States urban micro-warehousing market, that means the Northeast can grow quickly even without abundant new land, provided operators can unlock older sites and adapt them for modern fulfillment use.
The Southwest is an emerging geography within the United States urban micro-warehousing market because lower land costs and more permissive zoning support additional node development. Dallas-Fort Worth and Phoenix are important to this pattern because they offer room for expansion while still serving large metropolitan demand bases and broader regional flows. The Southeast and Midwest also gain from site remediation support and freight connectivity, and Americold’s August 2025 opening of an import-export hub in Kansas City shows how temperature-controlled logistics infrastructure is deepening outside the coastal markets. Across the Southwest and other heat-exposed regions, energy resilience is becoming a more material site-planning issue, which is why DOE-backed microgrid frameworks are relevant for future automated urban nodes.
Competitive Landscape
The United States urban micro-warehousing market remains fragmented, with no single operator controlling a dominant share across facility types, metros, and end-use categories. Competition comes from national 3PLs, fulfillment technology platforms, and specialist cold-chain operators, all trying to secure usable urban capacity in a limited site environment. This keeps the market open, but it also means scale alone is not enough because operators still need strong site selection, service reliability, and local execution. Multi-tenant capabilities matter because they help spread occupancy risk and enable operators to serve multiple demand streams from the same urban footprint. The United States urban micro-warehousing market, therefore, rewards companies that combine network density with enough flexibility to serve e-commerce, grocery, and selected higher-compliance categories within the same metro.
Recent strategic moves show that the competitive race is being shaped by technology, service bundling, and selective capital partnerships. GXO launched GXO IQ in 2025 and introduced an enhanced GXO Direct solution in the United States in June 2025, which tied multi-tenant warehousing more closely to order orchestration and commerce support services. Americold Realty Trust and EQT announced a USD 1.3 billion joint venture in May 2026, which gives Americold additional balance-sheet flexibility while keeping day-to-day management in place across 12 temperature-controlled facilities. Lineage also continued to invest in automation-led cold-chain infrastructure, including its November 2025 Dallas Metroplex project and its April 2025 United States cold-storage expansion plans tied to Tyson Foods. These moves show that competition in the United States urban micro-warehousing market is increasingly shaped by who can pair physical footprint growth with operating systems, automation, and capital discipline.
White space still exists where urban B2B distribution overlaps with pharmaceutical cold-chain needs because few operators are built to serve both high service reliability and higher compliance requirements in the same local node. The market also favors companies that can combine brownfield redevelopment capability, site-level energy resilience, and early fire-protection planning into a repeatable operating model. Those capabilities are harder to copy quickly than basic leased space, especially in dense metros where site availability is already constrained. The United States urban micro-warehousing industry is therefore competitive, but not commoditized, because execution quality and site readiness still separate stronger operators from the rest. The United States urban micro-warehousing market is likely to stay fragmented through the forecast period, with advantage concentrating around firms that can scale without losing local operating precision.
United States Urban Micro-Warehousing Industry Leaders
DHL Group
GXO Logistics
Ryder System, Inc.
Kuehne+Nagel
GEODIS
- *Disclaimer: Major Players sorted in no particular order

Recent Industry Developments
- May 2026: Americold Realty Trust and EQT announced a USD 1.3 billion cold storage joint venture, with EQT acquiring a 70% stake in 12 US temperature-controlled facilities totaling 124 million cubic feet. Americold retains a 30% interest and day-to-day management, while expected to receive approximately USD 1.1 billion in net cash proceeds to reduce debt.
- May 2026: Amazon expanded its 30-minute "Amazon Now" delivery service to Atlanta, Dallas-Fort Worth, Philadelphia, and Seattle, operating through a network of micro-fulfillment centers stocked with 3,500 SKUs. Amazon delivered over 500 million same-day units in 2026 across 85+ Same Day Fulfillment Centers.
- May 2026: NFI Industries opened a new fulfillment center in Eastvale, California, expanding e-commerce last-mile capacity in Southern California, a submarket with constrained industrial supply and sustained 3PL demand driven by nearshoring and port-proximate distribution growth.
- January 2026: Stord acquired Shipwire, the AI fulfillment platform and subsidiary of CEVA Logistics, adding 12 fulfillment locations, approximately 60 employees, and access to CEVA's global network spanning more than 170 countries.


United States Urban Micro-Warehousing Market Report Scope
| Dark Store-Based Fulfillment |
| Micro-Fulfillment Center (MFC)-Based Fulfillment |
| Retail Store-Based Fulfillment |
| Hybrid Facility and Others |
| Temperature Controlled |
| Non-Temperature Controlled |
| Manual Operations |
| Semi-Automated Facilities |
| Fully Automated Facilities |
| E-commerce |
| Quick Commerce |
| Grocery Retail |
| FMCG |
| Food and Beverage |
| Pharmaceuticals and Healthcare |
| Consumer Electronics and Household Appliances |
| Fashion and Lifestyle (Accessories, Apparel, Footwear) |
| Industrial and B2B Distribution |
| Others |
| Northeast |
| Southeast |
| Midwest |
| Southwest |
| West |
| By Facility Type | Dark Store-Based Fulfillment |
| Micro-Fulfillment Center (MFC)-Based Fulfillment | |
| Retail Store-Based Fulfillment | |
| Hybrid Facility and Others | |
| By Temperature Type | Temperature Controlled |
| Non-Temperature Controlled | |
| By Automation Level | Manual Operations |
| Semi-Automated Facilities | |
| Fully Automated Facilities | |
| By End-User Industry | E-commerce |
| Quick Commerce | |
| Grocery Retail | |
| FMCG | |
| Food and Beverage | |
| Pharmaceuticals and Healthcare | |
| Consumer Electronics and Household Appliances | |
| Fashion and Lifestyle (Accessories, Apparel, Footwear) | |
| Industrial and B2B Distribution | |
| Others | |
| By Region | Northeast |
| Southeast | |
| Midwest | |
| Southwest | |
| West |


Key Questions Answered in the Report
What is the 2031 outlook for urban micro-warehousing in the United States?
The United States urban micro-warehousing market is forecast to reach USD 9.33 billion by 2031 from USD 5.58 billion in 2026, growing at a 10.84% CAGR over 2026-2031.
What is driving demand for smaller urban fulfillment nodes?
Same-day delivery expectations, rising e-commerce volume, and the move toward domestic inventory stocking after de minimis rule changes are the main forces supporting demand.
Which facility format currently leads this space?
Micro-fulfillment centers led with 38.14% share in 2025 because they work across e-commerce, grocery, and FMCG flows with more flexibility than other formats.
Which segment is expanding the fastest by end use?
Quick commerce is the fastest-growing end-use segment, with an 18.47% CAGR through 2031, reflecting stronger demand for very short delivery windows in dense urban areas.
Why is automation becoming more important in city-based warehousing?
Semi-automated facilities already held 44.02% share in 2025, and fully automated sites are growing at 19.71% CAGR because operators need higher throughput and labor efficiency in expensive urban markets.
Which region is strongest today and which region is growing fastest?
The West led with 27.21% share in 2025, while the Northeast is projected to grow fastest at a 14.89% CAGR through 2031 due to dense demand and short delivery distances.
Page last updated on:





