
United States Urban Logistics Market Size and Share
Market Overview
| Study Period | 2020 - 2031 |
|---|---|
| Forecast Data Period | 2026 - 2031 |
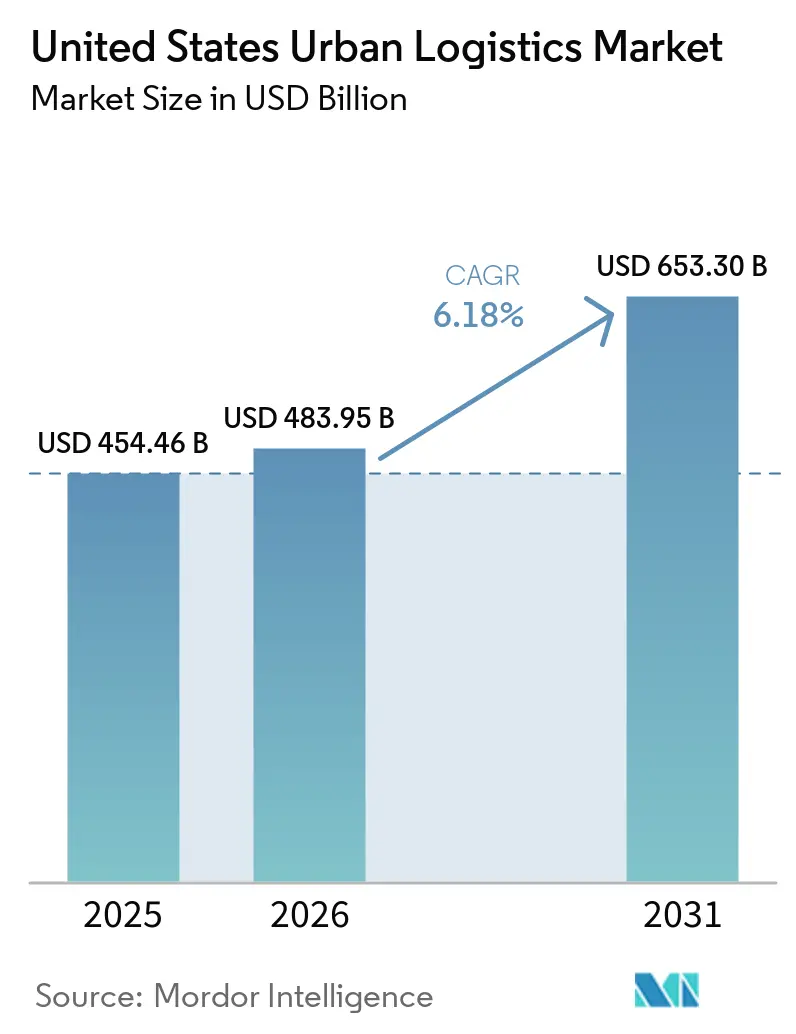
| Base Year Market Size (2025) | USD 454.46 Billion |
| Market Size (2026) | USD 483.95 Billion |
| Market Size (2031) | USD 653.30 Billion |
| Growth Rate (2026 - 2031) | 6.18 % |
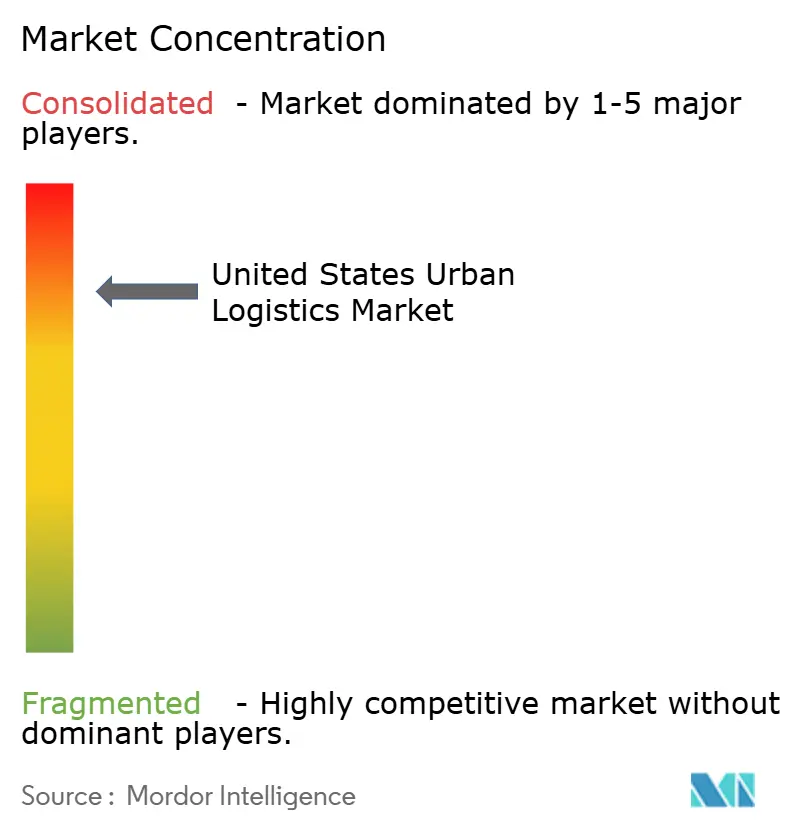
| Market Concentration | High |
Major Players *Disclaimer: Major Players sorted in no particular order Image © Mordor Intelligence. Reuse requires attribution under CC BY 4.0. | |
United States Urban Logistics Market Analysis by Mordor Intelligence
The United States urban logistics market size was valued at USD 454.46 billion in 2025 and is estimated to grow from USD 483.95 billion in 2026 to reach USD 653.30 billion by 2031, at a CAGR of 6.18% during the forecast period (2026-2031).
E-commerce has become a durable part of household spending, which increases parcel density and tightens delivery windows in major cities. Metropolitan population concentration raises the value of facilities located close to demand, while omnichannel retail adds store pickup, returns, and local fulfillment activity. Delivery speed is increasingly part of retailer competition, so operators are investing in local inventory, routing systems, and visibility tools. National carriers are focusing on higher-value healthcare, B2B, and premium services, leaving regional and specialist providers room to take selected general e-commerce volume. Wage costs, curb access, and weak revenue recovery on fast deliveries will remain central limits on profitability in the United States urban logistics market.
Key Report Takeaways
- By service type, transportation services held 40.39% of the United States urban logistics market share in 2025, while the fulfillment services segment is forecast to grow at an 8.10% CAGR through 2031.
- By delivery speed, standard delivery held 71.92% of the United States urban logistics market size in 2025, while the instant and same-day delivery segment is forecast to grow at a 7.27% CAGR through 2031.
- By customer type, B2C held 54.31% of of the United States urban logistics market share in 2025, while C2C is forecast to grow at a 9.05% CAGR through 2031.
- By end-use industry, e-commerce and retail held 43.11% of the United States urban logistics market size in 2025 and is forecast to grow at an 8.82% CAGR through 2031.
- By city, New York accounted for 29.36% of the United States urban logistics market share in 2025, while San Antonio is projected to grow at a 7.65% CAGR through 2031.
Note: Market size and forecast figures in this report are generated using Mordor Intelligence’s proprietary estimation framework, updated with the latest available data and insights as of January 2026.
United States Urban Logistics Market Trends and Insights
Drivers Impact Analysis*
| Driver | (~) % Impact on CAGR Forecast | Geographic Relevance | Impact Timeline |
|---|---|---|---|
| E-Commerce and Omnichannel Order Growth | +1.8% | National, with concentrated effects in New York, Los Angeles, Chicago, and Dallas metro corridors | Long term (≥ 4 years) |
| Rising Expectations for Same-Day and Scheduled Delivery | +1.2% | National, with early density in New York, Los Angeles, Chicago, Austin, and Phoenix | Medium term (2-4 years) |
| Retail Store Networks as Micro-Fulfillment Nodes | +0.7% | National, concentrated in metros with the highest major-retailer store density | Medium term (2-4 years) |
| AI-Powered Routing and Delivery Visibility | +0.6% | National, with faster adoption in high-stop-density corridors including New York, Chicago, and Houston | Short term (≤ 2 years) |
| Municipal Microhubs and Low-Emission Urban Delivery Modes | +0.4% | Dense cities with active freight regulation, including New York, Philadelphia, Portland, and Chicago | Medium term (2-4 years) |
| Recommerce and Higher-Frequency Reverse Flows | +0.5% | National, with strong demand in New York, Los Angeles, and Dallas | Long term (≥ 4 years) |
| Source: Mordor Intelligence | |||
E-Commerce and Omnichannel Order Growth
E-commerce expansion continues to increase the volume available to the United States urban logistics market. United States e-commerce sales reached USD 326.7 billion in the first quarter of 2026 and represented 16.9% of total retail sales[1]. That level makes online retail a lasting part of consumption instead of a supplementary channel, and it means that urban providers must plan for regular residential parcel activity across a wider range of product types, neighborhood income levels, and order values. Retailers are linking store, curbside, and app orders with shared inventory systems, which helps them respond to local availability changes and reduce the risk that separate sales channels promise stock that is no longer accessible. A store can now act as a pickup point, a return site, and a local stock location during the same day. The resulting flows require carriers to handle warehouse-to-home, store-to-vehicle, return-to-network, and peer-to-peer movements within the same urban area.
Rising Expectations for Same-Day and Scheduled Delivery
The expected delivery speed in the United States urban logistics market is rising faster than city infrastructure can adapt. Amazon delivered nearly 70% more same-day items in 2025 than in 2024, which raised customer expectations across retail categories[2]. Fast delivery requires stock to be positioned close to consumers and changes the economics of facility location. Retailers that cannot support short delivery windows can face a disadvantage in acquiring and retaining customers, particularly when competing retailers can make stock availability and estimated arrival time visible before checkout and provide convenient local return options after delivery. The shift also increases demand for small local facilities, precise inventory planning, and reliable delivery visibility. Scheduled delivery remains important where consumers and businesses value a defined arrival window over immediate fulfillment.
AI-Powered Routing and Delivery Visibility
AI-supported routing is becoming a basic operating capability in the United States urban logistics market. C.H. Robinson stated that its Lean AI Engineer handles 92% of 4PL shipments globally, including order creation, tendering, routing, delivery, exceptions, and carrier payment[3]. The company reported that an early adopter reduced loads by 17% across 20 locations and saved more than USD 1 million annually. These tools can shorten planning cycles and select the most suitable carrier mode for each order. They also preserve operating knowledge when driver turnover disrupts local routes, since software can capture delivery preferences, recurring access restrictions, service exceptions, and the practical routing choices that otherwise remain with individual dispatchers or drivers. Providers that continue to rely on manual dispatch may find it harder to protect unit economics as delivery density rises.
Retail Store Networks as Micro-Fulfillment Nodes
Retail stores are becoming logistics assets for larger omnichannel chains. Walmart used its network of nearly 4,700 United States stores to support selected sub-30-minute deliveries in 2025[4]. This approach turns existing retail real estate into distributed fulfillment capacity without requiring a separate local lease for every service area. Retailers are also improving pickup and delivery infrastructure inside stores and linking these investments with digital commerce tools. Smaller retailers with limited store networks cannot reproduce the same geographic coverage at equal cost, because they must secure third-party capacity or dedicated facilities in the exact neighborhoods where larger chains already have customer access and local inventory. This difference can widen the fulfillment-speed gap between national chains and brands that depend entirely on third-party networks. For the United States urban logistics market, the issue is not simply how quickly an item moves after an order, but whether the merchant can keep the right assortment available close enough to make a promised service level reliable throughout the day.
Restraints Impact Analysis*
| Restraint | (~) % Impact on CAGR Forecast | Geographic Relevance | Impact Timeline |
|---|---|---|---|
| High Urban Operating Costs and Narrow Delivery Margins | -1.5% | National, most acute in New York, Los Angeles, San Francisco, and Chicago | Long term (≥ 4 years) |
| Driver Availability and Gig-Worker Retention | -0.9% | National, with the sharpest effects in high-cost metro areas | Medium term (2-4 years) |
| Curb Access, Congestion and Delivery-Time Restrictions | -0.6% | Dense cities with active curb regulation, including New York, Chicago, Philadelphia, and Atlanta | Medium term (2-4 years) |
| Data-Sharing, Privacy and Platform-Interoperability Constraints | -0.4% | National, with compliance complexity concentrated in California, New York, and states with active privacy rules | Long term (≥ 4 years) |
| Source: Mordor Intelligence | |||
High Urban Operating Costs and Narrow Delivery Margins
Urban delivery margins remain narrow because carriers face higher labor, real estate, and service costs. Parcel carriers raised general rates in 2025 and 2026 while extending charges for residential, peak-period, and oversize deliveries. Fast delivery providers need local facilities within city boundaries, where rents can be materially higher than at suburban warehouses. This cost structure makes sub-hour delivery harder to sustain without enough route density, especially when orders are dispersed across buildings with different access rules, delivery reception practices, and parking limitations in the United States urban logistics market. Driver replacement and picking costs add further pressure on each delivery. Operators that cannot automate work or consolidate enough stops will continue to face weaker margins even when volumes grow, as more orders can simply increase the number of costly handoffs, local facility touches, and unsuccessful delivery attempts rather than improve returns.
Driver Availability and Gig-Worker Retention
Driver retention remains an operating risk for urban providers. Dense routes often involve elevator buildings, limited parking, and a high number of stops. These assignments can offer a less favorable pay-to-effort balance than many suburban routes. Experienced drivers may therefore prefer easier assignments, reducing service consistency on difficult urban routes. Proposed courier employment rules in New York City could add compliance costs in a large delivery market. Providers need compensation, route design, and workforce practices that make dense urban work more sustainable, since stable local teams can reduce missed deliveries, repeat stops, and the service variability that affects merchant confidence in the United States urban logistics market.
*Our forecasts treat driver/restraint impacts as directional, not additive. The impact forecasts reflect baseline growth, mix effects, and variable interactions.
Segment Analysis
By Service Type: Transportation Leads While Fulfillment Expands Faster
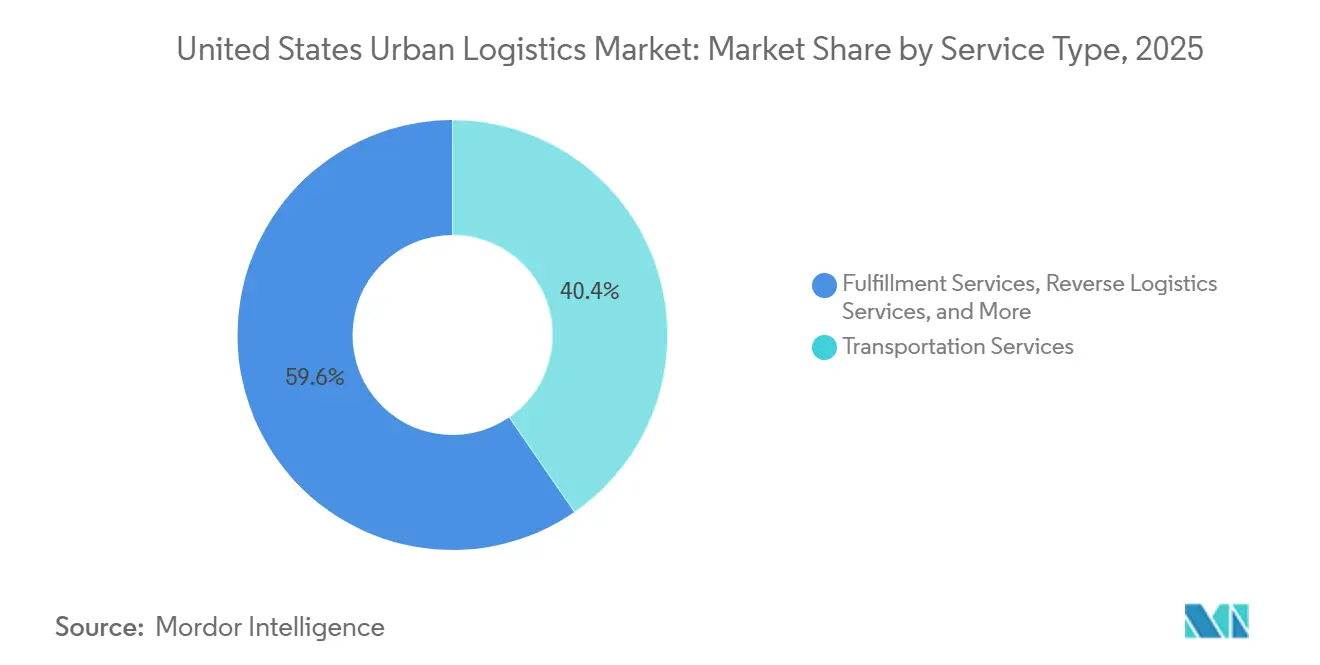
Transportation services held 40.39% of the United States urban logistics market share in 2025. Physical parcel and freight movement remains necessary across every local fulfillment model. Each e-commerce order, return parcel, and omnichannel transaction adds transportation activity. The fulfillment services segment is the fastest-growing service at an 8.10% CAGR through 2031. Retailers and brands are moving more inventory into urban micro-nodes to reduce the distance between stock and customers. Transportation and fulfillment are sequential activities, rather than substitutes, within the United States urban logistics market. Better inventory placement can increase the number of short transport legs even as it reduces the distance traveled on each leg. Providers that combine both capabilities can manage inventory availability and delivery execution through a single operating model, which can improve response to local stock shortages, delivery exceptions, and unpredictable return volumes in the United States urban logistics market.
Warehousing and urban storage Services provide buffer capacity for same-day and next-day commitments. They allow operators to avoid the permanent placement of every item in the most expensive local facilities. Reverse logistics services are gaining importance as e-commerce returns create recurring flows back into networks. Value-added logistics services include kitting, labeling, co-packing, and returns grading. These services give 3PLs opportunities beyond transportation and storage fees. Pharmaceutical and temperature-sensitive food deliveries also create requirements that can support differentiated services under FDA cold-chain standards. Providers must coordinate packaging, handoffs, documentation, and returns without disrupting tight urban delivery schedules. Integrated service models can therefore reduce the number of transfers and improve accountability for sensitive orders, while providing retailers with a clearer record of where goods are held, processed, and delivered within the United States urban logistics market.

By Delivery Speed: Standard Delivery Retains Scale as Instant Delivery Accelerates
Standard delivery accounted for 71.92% of the United States urban logistics market size by delivery speed in 2025. Scheduled, lower-cost delivery still serves most e-commerce volume. Instant and same-day delivery is forecast to expand at a 7.27% CAGR through 2031. Carriers are investing in dark stores and micro-fulfillment capacity to make rapid delivery workable at scale. Amazon’s 2025 same-day delivery growth demonstrates that customers are using faster options more often. The standard tier can still benefit when shoppers group nonurgent items into fewer planned deliveries. This behavior can improve vehicle utilization when carriers consolidate orders going to the same neighborhood. In the United States urban logistics market, service design must balance rapid fulfillment with the lower cost of planned route density.
Next-day delivery provides a middle option for consumers who need speed but not immediate fulfillment. It also gives retailers a practical service level when their catalog cannot support sub-2-hour delivery. Scheduled delivery has a role in healthcare and industrial uses where timed arrival matters more than speed. AI routing can reduce the operational difference among these delivery tiers. An order promised for the next day can sometimes be fulfilled in hours without changing the stated service level. Pharmaceutical deliveries add chain-of-custody requirements that favor providers with dedicated capabilities. Operators need to manage handoffs and timing carefully when the product has temperature or controlled-substance requirements. These requirements make reliable scheduled service valuable even as faster consumer delivery options expand, because a missed clinical or industrial handoff can carry greater consequences than a delayed general retail parcel in the United States urban logistics market.
By Customer Type: B2C Scale Coexists with C2C’s Different Operating Needs
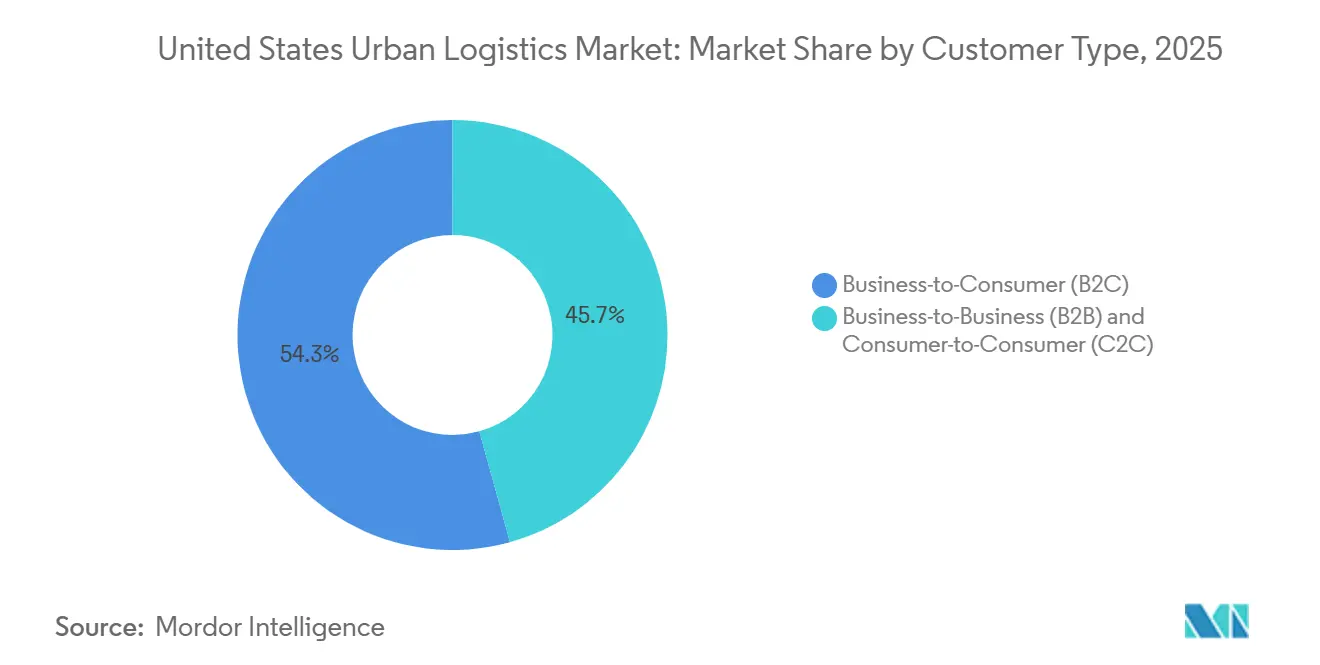
B2C held 54.31% of the United States urban logistics market share in 2025. This segment benefits from established retailer-to-household fulfillment flows. C2C is forecast to grow at a 9.05% CAGR through 2031. DHL reported that 52% of consumers have sold items through online marketplaces, making more households recurring parcel senders. Resale platforms, social commerce, and peer-to-peer apps generate shipments from dispersed residential origins. This expands volume but makes route density and capacity planning less predictable. Carriers need collection points and flexible pickup options because parcels do not originate from a small group of retail facilities. In the United States urban logistics market, this shifts some infrastructure spending toward neighborhood access rather than only high-capacity distribution sites.
C2C parcels differ from traditional retail shipments in their size, weight, and pickup location. Many senders favor out-of-home drop-off points and parcel lockers. This preference supports kiosk networks and retail counter integrations in cities. B2B delivery provides a steadier base of commercial restocking, industrial supply, and scheduled service activity. Contracted B2B volumes can help operators plan routes in dense business districts. Together, the three customer models require a mix of flexible pickup infrastructure and dependable commercial service. Their different demand patterns also require providers to match vehicle capacity, pickup timing, and customer communication to each type of shipment. A network built only for doorstep retail delivery may not serve peer-to-peer and commercial demand equally well, since collection, drop-off, and business receiving patterns call for different local access points in the United States urban logistics market.
By End-Use Industry: E-Commerce and Retail Lead Volume and Growth
E-commerce and retail held 43.1% of the United States urban logistics market size in 2025 and is projected to grow at an 8.82% CAGR through 2031. Its broad product range includes electronics, apparel, groceries, pharmaceuticals, and home goods. Retailers are shifting some stock from centralized distribution centers to local forward-deployed nodes. Food and beverage deliveries require temperature control and precise delivery windows. Healthcare and pharmaceuticals are gaining priority for national carriers.
Consumer electronics need careful packaging, signature confirmation, and loss prevention. Fashion and apparel produce substantial return volumes that increase reverse-logistics needs. Automotive parts and industrial and manufacturing contribute recurring B2B demand through just-in-time delivery requirements. These activities are important near manufacturing corridors in Houston, Chicago, and nearby metropolitan areas. Specialized handling, temperature control, and compliant pharmaceutical services can support stronger pricing than general freight. The United States urban logistics industry, therefore, rewards providers that can meet specific end-use requirements without losing speed or delivery reliability. Providers can use these capabilities to offer contract-based services that are less exposed to general parcel price competition.
Geography Analysis
New York held 29.36% of the United States urban logistics market share in 2025, supporting the Northeast’s position as the country’s most logistics-intensive region. Residential density and high parcel volumes create sustained demand for local delivery capacity. Philadelphia supports the wider Northeast network and is improving its delivery environment. Philadelphia is working to accommodate commercial delivery growth through its approach to loading access and street management. Aging streets, limited curbs, and building access remain operational constraints. These conditions increase the need for smaller vehicles, cargo bikes, and handcart operations, which can improve access but require carefully located microhubs and clear loading rules within the United States urban logistics market.
San Antonio is forecast to lead city growth at a 7.65% CAGR through 2031. Its growth reflects population expansion and its role as a cross-border logistics hub near the Laredo trade corridor. Dallas benefits from a central position that supports national ground routing and route density. Houston connects port-driven imports to urban redistribution across the Gulf Coast. These Sun Belt cities offer infrastructure opportunities before demand reaches mature Northeast levels, although providers still need enough local order density to support fast service without carrying underused facilities in the United States urban logistics market.
Los Angeles and Chicago combine established logistics scale with complex operating conditions. Los Angeles needs dense urban micro-fulfillment capacity and longer suburban routes because of its ports and geographic spread. Chicago benefits from its position in national ground transit and can support cross-market consolidation. Across the country, municipal rules on curb use, low-emission zones, and driver classification are creating a patchwork that favors providers with local regulatory knowledge. Providers must incorporate those local requirements into facility choice, fleet design, driver scheduling, and delivery timing, instead of treating regulatory compliance as a separate administrative task after routes are already designed.
Competitive Landscape
The United States urban logistics market is moderately concentrated among national carriers and fragmented across regional operators. Large incumbents protect their networks through coverage, technology investment, and specialized service offerings. UPS and FedEx signaled a 2026 focus on higher-value healthcare, industrial, and B2B activity instead of lower-yield general e-commerce volume. This strategy creates openings for regional carriers that can serve selected lanes at a competitive cost, especially where they have established local driver networks, flexible pickup arrangements, and customer relationships that support dense daily delivery activity. OnTrac expanded its marketplace seller program into additional high-volume northeastern and southern areas in the second quarter of 2026. The move positioned the company to capture e-commerce volume that national carriers may no longer pursue under previous pricing.
Technology is a major differentiator in urban delivery competition. ShipBob introduced Intelligent Inventory Placement in August 2026 to analyze order geography, SKU sales, and seasonal demand, then recommend inventory redistribution across its fulfillment network. The company’s approach places more weight on inventory planning than on the warehouse area alone.
C.H. Robinson’s Lean AI Engineer provides another example of automation across shipment execution. These systems can support faster decisions, fewer unnecessary loads, and better use of local capacity, while giving merchants more consistent information on inventory position, delivery status, and the operational choices required when an order cannot follow its original plan. Healthcare delivery is a strategic area for providers seeking higher-value urban business. Amazon Pharmacy is expanding same-day prescription delivery to 4,500 United States cities by the end of 2026. Zipline is expanding its United States healthcare delivery operations, including Cleveland Clinic prescription delivery in Ohio and a planned Tampa-area partnership for 2027.
United States Urban Logistics Industry Leaders
-
United Parcel Service, Inc.
-
FedEx Corporation
-
Ryder System, Inc.
-
XPO, Inc.
-
GXO Logistics, Inc.
- *Disclaimer: Major Players sorted in no particular order
Recent Industry Developments
- August 2026: ShipBob formally launched Intelligent Inventory Placement (IIP), an AI-driven layer within its Merchant Dashboard that automatically analyzes order geography, SKU sell-through rates, and seasonal demand curves to recommend and execute inventory redistribution across 40-plus global fulfillment centers. The tool is available at no additional fee through Q1 2027, after which ShipBob plans a performance-based pricing model.
- June 2026: C.H. Robinson launched its Lean AI Engineer, an autonomous logistics intelligence platform handling 92% of 4PL shipments globally from order creation through carrier payment without human intervention. One early adopter reduced total loads by 17% across 20 locations for an annual saving of over USD 1 million by reorganizing pickup sequences to serve multiple delivery locations per truck run.
- April 2026: ShipMonk launched its first single-category, apparel-specific warehouse in Louisville, Kentucky. The 406,000-square-foot facility, known as “KY2,” is designed to support the full operational lifecycle of apparel orders, including managing size- and style-driven SKU complexity, processing fit-related returns, and handling soft goods at scale.
- January 2026: OnTrac and ShipStation expanded their partnership to enable faster, seven-day e-commerce shipping nationwide. The partnership integrates ShipStation’s technology and API with OnTrac’s delivery network, providing ShipStation customers with a wider range of shipping options to meet their business requirements.
United States Urban Logistics Market Report Scope
| Transportation Services |
| Warehousing and Urban Storage Services |
| Fulfillment Services |
| Reverse Logistics Services |
| Value-Added Logistics (VAL) Services |
| Instant and Same-Day Delivery |
| Next-Day Delivery |
| Scheduled Delivery |
| Standard Delivery |
| Business-to-Business (B2B) |
| Business-to-Consumer (B2C) |
| Consumer-to-Consumer (C2C) |
| E-commerce and Retail |
| Food and Beverage |
| Healthcare and Pharmaceuticals |
| Consumer Electronics |
| Fashion and Apparel |
| Automotive Parts |
| Industrial and Manufacturing |
| Others |
| New York |
| Los Angeles |
| Chicago |
| Houston |
| Phoenix |
| Philadelphia |
| San Antonio |
| San Diego |
| Dallas |
| Rest of Cities |
| By Service Type | Transportation Services |
| Warehousing and Urban Storage Services | |
| Fulfillment Services | |
| Reverse Logistics Services | |
| Value-Added Logistics (VAL) Services | |
| By Delivery Speed | Instant and Same-Day Delivery |
| Next-Day Delivery | |
| Scheduled Delivery | |
| Standard Delivery | |
| By Customer Type | Business-to-Business (B2B) |
| Business-to-Consumer (B2C) | |
| Consumer-to-Consumer (C2C) | |
| By End-Use Industry | E-commerce and Retail |
| Food and Beverage | |
| Healthcare and Pharmaceuticals | |
| Consumer Electronics | |
| Fashion and Apparel | |
| Automotive Parts | |
| Industrial and Manufacturing | |
| Others | |
| By City | New York |
| Los Angeles | |
| Chicago | |
| Houston | |
| Phoenix | |
| Philadelphia | |
| San Antonio | |
| San Diego | |
| Dallas | |
| Rest of Cities |
Key Questions Answered in the Report
What is the forecast growth rate for United States urban logistics?
The sector is forecast to grow at a 6.18% CAGR from 2026 to 2031, reaching USD 653.30 billion by 2031. E-commerce volumes, local inventory positioning, and stronger expectations for dependable delivery windows support this outlook.
Which service is growing fastest in urban logistics?
Fulfillment services is forecast to grow at an 8.10% CAGR through 2031 as inventory moves closer to urban consumers. The shift supports shorter delivery legs but increases the need for well-managed local facilities and transport connections.
Why is same-day delivery expanding in United States cities?
Rising customer expectations and local inventory networks are making fast delivery a more common retail service. Retailers use stores, micro-fulfillment capacity, and better routing to offer faster delivery while controlling operating costs.
Which customer group will grow fastest through 2031?
C2C is forecast to grow at a 9.05% CAGR, supported by resale platforms and peer-to-peer shipments. The segment creates new demand for lockers, counter drop-offs, and flexible neighborhood collection options.
What end-use sector has the highest growth outlook?
E-Commerce and retail is forecast to expand at an 8.82% CAGR through 2031. Its product mix ranges from groceries and apparel to electronics and pharmaceuticals, each with different handling and delivery requirements.
What issues constrain urban delivery profitability?
Labor availability, local facility costs, congestion, and limited curb access can narrow delivery margins. Providers also face pressure to price rapid services carefully when consumer willingness to pay does not cover the full cost.