
United States Sustainable Tourism Market Size and Share
Market Overview
| Study Period | 2022 - 2031 |
|---|---|
| Forecast Data Period | 2026 - 2031 |
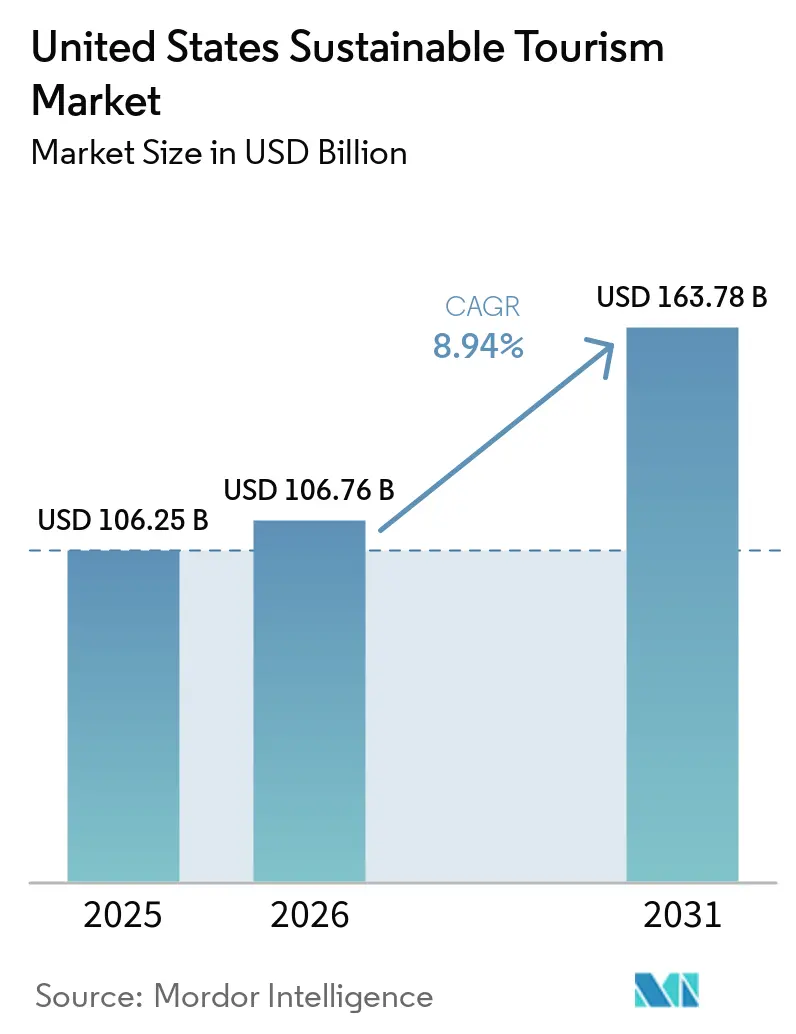
| Base Year Market Size (2025) | USD 106.25 Billion |
| Market Size (2026) | USD 106.76 Billion |
| Market Size (2031) | USD 163.78 Billion |
| Growth Rate (2026 - 2031) | 8.94 % |
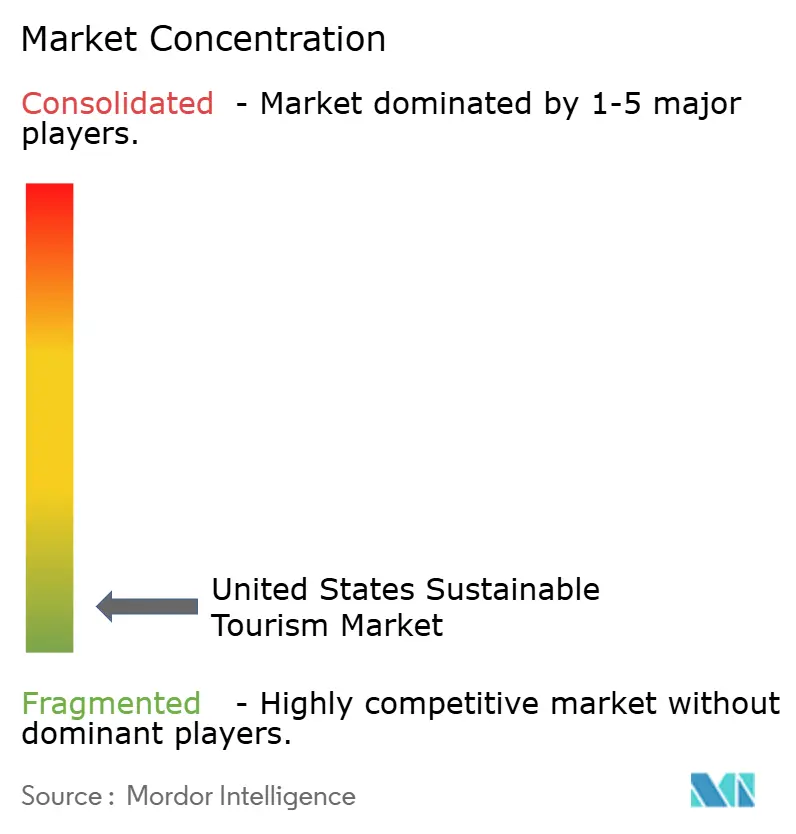
| Market Concentration | Low |
Major Players *Disclaimer: Major Players sorted in no particular order Image © Mordor Intelligence. Reuse requires attribution under CC BY 4.0. | |
United States Sustainable Tourism Market Analysis by Mordor Intelligence
The United States Sustainable Tourism Market was valued at USD 106.25 billion in 2025 and is estimated to grow from USD 106.76 billion in 2026 to reach USD 163.78 billion by 2031, at a CAGR of 8.94% during the forecast period (2026–2031). Domestic visitor spending reached USD 1.54 trillion in 2025, representing 87% of total travel expenditure, highlighting strong home-market demand despite weaker inbound travel. The outdoor recreation economy contributed USD 696.7 billion, or 2.4% of United States GDP, in 2024, reflecting significant nature-linked travel demand beyond protected parks[1]. International visitor arrivals declined 5.5% to 68.3 million in 2025, while international visitor spending dropped 4.6% to USD 176 billion. The market relied on domestic resilience as inbound demand awaited recovery. Operators focusing on verified sustainability credentials, conservation-linked itineraries, and direct customer engagement are positioned to benefit as sustainable travel filters gain visibility on major booking platforms in 2026.
Key Report Takeaways
- By tourism type, ecotourism led with 34.31% of the United States Sustainable Tourism Market share in 2025, while wellness tourism is projected to grow at a 9.76% CAGR through 2031.
- By service type, accommodation held 38.74% of the United States Sustainable Tourism Market share in 2025, while activities and experiences are projected to expand at a 9.57% CAGR through 2031.
- By booking channel, Online Travel Agencies (OTAs) accounted for 42.91% of the United States Sustainable Tourism Market share in 2025, while direct booking (Hotels / Resorts / Operators) is projected to record the fastest CAGR of 9.06% through 2031.
- By traveler type, domestic travelers held 68.72% of the United States Sustainable Tourism Market share in 2025, while international travelers are projected to expand at a 10.12% CAGR through 2031.
- By geography, the West held 32.81% of the United States Sustainable Tourism Market share in 2025, while the South is projected to grow at a 9.93% CAGR through 2031.
Note: Market size and forecast figures in this report are generated using Mordor Intelligence’s proprietary estimation framework, updated with the latest available data and insights as of January 2026.
United States Sustainable Tourism Market Trends and Insights
Drivers Impact Analysis*
| Drivers | (~) % Impact on CAGR Forecast | Geographic Relevance | Impact Timeline |
|---|---|---|---|
| Rising eco-conscious traveler demand | +2.8% | National, concentrated in the West & Northeast | Short term (≤ 2 years) |
| Federal and state sustainability support | +1.5% | National, with early gains in Western States, Hawaii | Medium term (2-4 years) |
| Digital discovery of certified stays and low-impact itineraries | +1.2% | National, urban gateway markets first | Short term (≤ 2 years) |
| Loyalty incentives for greener traveler behavior | +0.8% | National, concentrated among Millennial/Gen Z cohorts | Short term (≤ 2 years) |
| Regenerative and community-based product expansion | +1.0% | South, West, rural and indigenous destinations | Medium term (2-4 years) |
| Sustainable rail, EV, and low-carbon mobility build-out | +0.7% | Northeast Corridor, Pacific Northwest, West | Medium term (2-4 years) |
| Source: Mordor Intelligence | |||
Rising eco-conscious traveler demand
Sustainability preferences are shaping travel choices across age groups, creating a durable demand base for the United States sustainable tourism market. Booking.com reported that most travelers consider sustainable travel important, with significant bookings at sustainability-certified properties. Baby Boomers and Gen X travelers often adopt practical, sustainable behaviors, such as off-peak travel and local shopping, highlighting an under-targeted spending demographic. Deloitte found that younger travelers prioritize sustainability ratings for hotels and airlines, but Booking.com data shows older travelers also book certified options when clearly presented[2]. Extreme weather is influencing trip planning, with many travelers considering weather risks when choosing destinations and altering or canceling trips. This trend is driving demand toward operators demonstrating resilience, seasonality planning, and clear destination guidance.
Federal and state sustainability support
Federal infrastructure changes and state-level policies are reducing barriers to sustainable product development in the United States tourism market. The Department of the Interior plans to modernize national park access in 2026 with digital passes, expanded motorcycle access, and differentiated pricing for residents and non-residents, expected to significantly boost park maintenance funding. Hawaii’s climate impact fee, effective the same year, will add a small charge to lodging costs, generating substantial revenue for climate adaptation and wildfire prevention. The United States Green Building Council’s LEED v5, launched in 2025, prioritizes decarbonization, offering hospitality operators a clearer framework for capital access, compliance, and sustainability branding. These initiatives are improving investment prospects in the sustainable tourism market by enhancing funding transparency, formalizing building standards, and linking climate-related spending to the travel economy.
Digital discovery of certified stays and low-impact itineraries
Digital discovery is driving demand in the United States sustainable tourism market, with certification data, itinerary tagging, and AI planning tools shaping traveler decisions. Expedia Group introduced an Activity Planner at Explore 2026, enabling travelers to describe trips in natural language and receive bookable itineraries. This enhances the visibility of operators with structured content and sustainability attributes. The company also launched the Trails Fund, supporting restoration projects and linking destination recovery to the booking ecosystem. An expanded partnership with AllTrails strengthened connections between outdoor activities and lodging bookings, streamlining access for activity-focused destinations. As platforms improve search logic and itinerary automation, uncertified or poorly tagged inventory risks losing visibility, while verified operators gain a competitive edge in travel planning.
Loyalty incentives for greener traveler behavior
Loyalty systems in the United States sustainable tourism market are shifting from basic discounts and points to rewarding environmentally conscious choices and certified stays. Booking.com data indicates that travelers seeking sustainability-certified accommodations book earlier and cancel less often, enhancing revenue reliability for certified operators. Green Key Global, in partnership with the American Hotel & Lodging Association and the Hotel Association of Canada, launched "Green Key Ready" as an entry-level program to help smaller hotels access sustainability certifications[3]. Booking.com supported this by offering hotel partners a discount on Green Key certification, signaling a shift toward making certifications a standard feature rather than an optional add-on. Hotels without credible certifications risk losing repeat bookings, loyalty-driven demand, and visibility in major distribution networks.
Restraints Impact Analysis*
| Restraints | (~) % Impact on CAGR Forecast | Geographic Relevance | Impact Timeline |
|---|---|---|---|
| Premium pricing and ROI payback gaps | -1.2% | National, most acute in rural and wilderness destinations | Short term (≤ 2 years) |
| Certification fragmentation and greenwashing risk | -0.9% | National, amplified in key OTA markets | Medium term (2-4 years) |
| Public-lands crowding and destination carrying-capacity stress | -0.7% | West (Utah, Wyoming, California), South (Tennessee) | Short term (≤ 2 years) to Medium term (2-4 years) |
| Insurance and climate-risk exposure in fragile destinations | -0.6% | Coastal Southeast, Pacific Southwest, Hawaiian Islands | Long term (≥ 4 years) |
| Source: Mordor Intelligence | |||
Premium pricing and ROI payback gaps
Higher room rates in the United States sustainable tourism market often fail to boost booking confidence among mainstream travelers. Sustainable lodging properties generally charge more than conventional ones, requiring suppliers to provide clear differentiation to justify the cost. LEED-certified buildings tend to perform better economically, achieving higher market sales prices per square foot and rent rates. However, smaller operators in gateway and rural destinations face challenges with the extended capital recovery period for green retrofits, compounded by tighter margins and limited financing options. Pricing challenges vary, as luxury eco-lodges encounter less resistance, while budget and mid-market sustainable properties must appeal to cost-conscious travelers at checkout.
Certification fragmentation and greenwashing risk
Certification challenges continue to hinder the United States sustainable tourism market, as operators and travelers face multiple frameworks with inconsistent recognition and enforcement. The market operates within standards like LEED, Green Key, Green Globe, GSTC-aligned programs, and ENERGY STAR, creating a complex environment for small operators. Booking platforms have tightened badge systems due to criticism of self-reported criteria, increasing reliance on third-party verification over supplier claims. Independent properties often bear high compliance costs, making certification's commercial benefits uncertain despite growing consumer interest. Green Key membership and GSTC-aligned pathways offer the most viable options for operators seeking recognition across OTA searches, corporate travel screenings, and international traveler expectations.
*Our forecasts treat driver/restraint impacts as directional, not additive. The impact forecasts reflect baseline growth, mix effects, and variable interactions.
Segment Analysis
By Tourism Type: Ecotourism Anchors Volume as Wellness Reshapes Spend Profile
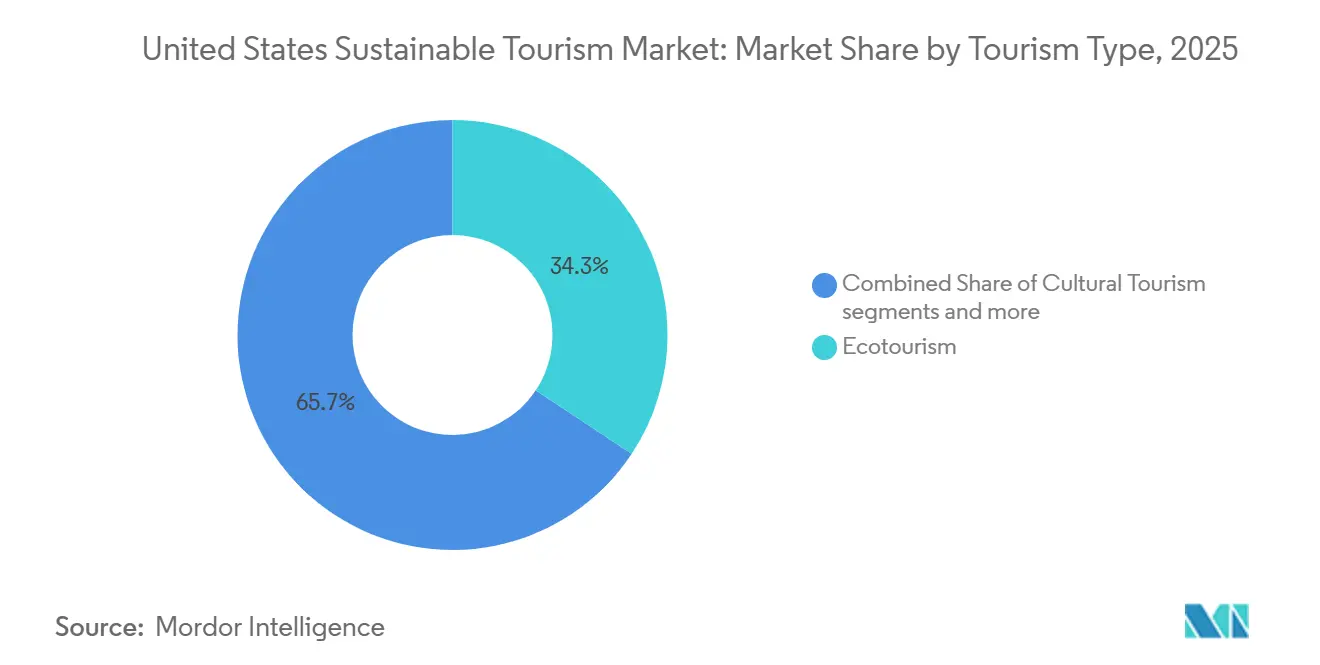
Ecotourism accounted for 34.31% of the United States sustainable tourism market in 2025, making it the largest segment. It benefits from activities like wildlife observation and conservation-focused itineraries, which are integral to the country’s outdoor visitor economy. In 2025, United States national parks recorded 323 million recreation visits and over 13 million overnight stays, highlighting strong demand for ecotourism products[4]. The outdoor recreation economy contributed USD 696.7 billion in value added in 2024, supporting guides, park lodgings, concessionaires, and regional nature-based operators. Cultural and adventure tourism also drive sustainable spending through heritage interpretation, indigenous narratives, and backcountry activities.
Wellness tourism is projected to grow at a 9.76% CAGR through 2031, making it the fastest-growing segment in the United States sustainable tourism market. The United States wellness economy reached USD 2.1 trillion in 2024, growing at 7.9% annually from 2019 to 2024, reflecting mainstream demand. A 2026 wellness travel survey showed that 64% of wellness-focused travelers surveyed had planned a retreat that year, with retreats surpassing spa treatments, supplements, and gym memberships in wellness spending. This shift aligns wellness tourism with nature-based healing, slower itineraries, and low-density settings, complementing conservation-focused destinations. Growth extends beyond traditional spa resorts to retreat-led, nature-integrated formats closely tied to ecotourism supply.

By Service Type: Accommodation Dominates as Experiential Products Capture New Spend
Accommodation represented 38.74% of the United States sustainable tourism market in 2025, making it the largest service type. Sustainable lodging serves as a key touchpoint for travelers, introducing eco-certifications, energy standards, and conservation messages. LEED-certified properties achieved a 21.4% higher average market sales price per square foot and an 11% increase in rent rates. Green Key Ready expanded certification for smaller hotels in 2025, while the Greater Miami Convention & Visitors Bureau introduced certification incentives for member hotels, broadening the supply pipeline. Accommodation maintains the largest share due to its high-ticket value and clear certification visibility, despite transportation and food & beverage playing supporting roles.
Activities and experiences are projected to grow at a 9.57% CAGR through 2031, the fastest among service types in the United States sustainable tourism sector. This reflects a shift toward guided, conservation-linked, and educational experiences. The REI Co-op and Intrepid Travel partnership launched in January 2026, offering nearly 90 small-group adventures to REI’s 25 million members, demonstrating how outdoor membership platforms can scale demand. Experience-led offerings require less fixed capital than accommodations, providing regional operators with flexible growth opportunities when supported by permits, guides, and local narratives. As travelers increasingly choose outdoor, cultural, and stewardship activities, the service mix in the United States sustainable tourism market is shifting toward higher-frequency add-on spending alongside core stays.
By Booking Channel: OTAs Dominate but Direct Relationships Outgrow
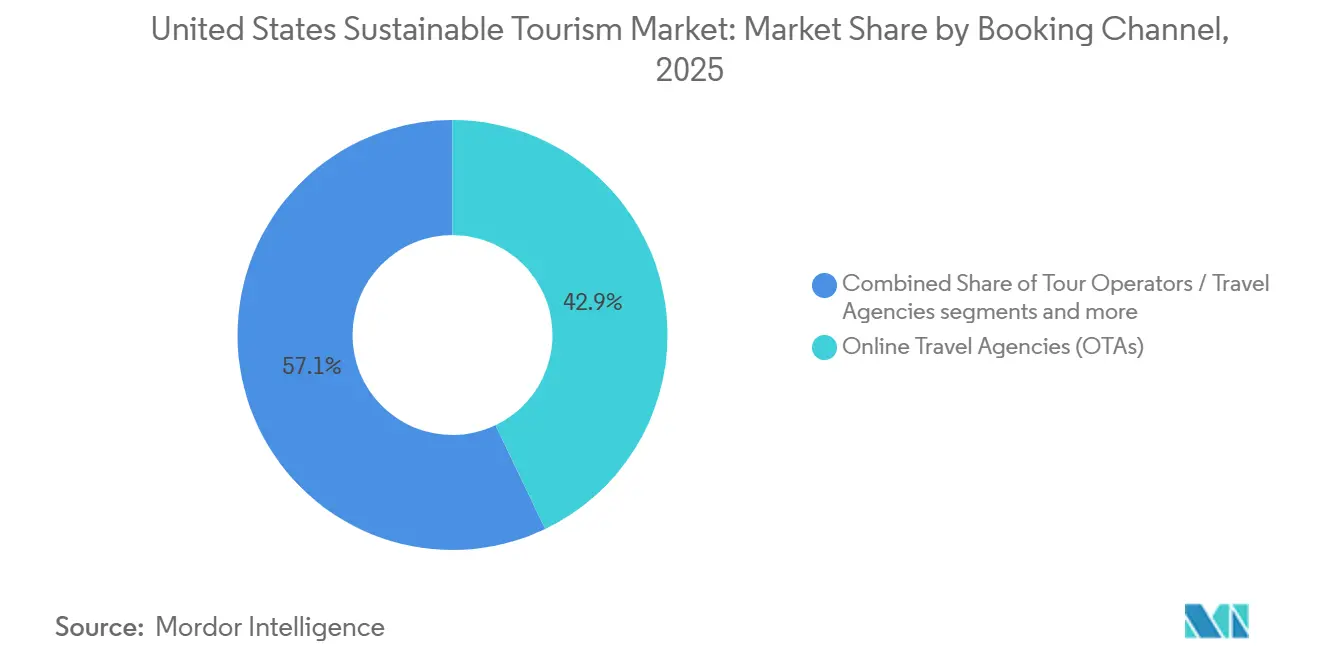
Online Travel Agencies (OTAs) accounted for 42.91% of the United States sustainable tourism market in 2025, making them the largest booking channel. They serve as a key platform for discovering certified properties, packaged itineraries, and sustainability attributes. Booking.com facilitated 100 million room nights at sustainability-certified properties in 2025, highlighting their role in promoting sustainable stays. Expedia’s 2026 Activity Planner enhances OTA relevance by converting trip intent into bookable plans, benefiting operators with well-organized inventories. Tour operators and Destination Management Companies (DMCs) remain essential for complex trips, such as wilderness and heritage travel, where algorithmic solutions are insufficient.
Direct bookings are projected to grow at a 9.06% CAGR through 2031, the fastest among booking channels. This growth reflects efforts by park concessionaires, eco-lodges, and specialist operators to reduce commission reliance and improve guest communication. Xanterra Travel Collection, serving around 3 million annual visitors at national parks, has implemented direct booking systems to reduce intermediary dependence. Direct channels also allow certified operators to explain conservation practices, visitor behavior, and seasonal conditions, ensuring sustainability claims translate into actionable guest behavior. A hybrid model is expected, with OTAs driving discovery and direct bookings fostering repeat guest relationships.
By Traveler Type: Domestic Travelers Drive Volume as International Segment Accelerates
Domestic travelers accounted for 68.72% of the United States sustainable tourism market in 2025, reflecting a strong focus on local and regional travel. Domestic visitor spending represented 87% of total United States travel expenditure that year. In May 2025, a survey found that 60% of Americans preferred outdoor travel over urban destinations for summer, highlighting the popularity of nearby nature trips. In May 2026, findings showed that 86% of Gen Z and Millennial travelers had taken at least one national park or nature trip in the prior year, indicating strong outdoor demand among younger domestic travelers. Domestic travel remains a stabilizing factor, less affected by visa issues, geopolitical changes, and long-haul airfare constraints compared to inbound travel.
International travelers made up 31.28% of the 2025 volume and are projected to grow at a 10.12% CAGR through 2031, making them the fastest-growing segment. International arrivals to the United States fell 5.5% to 68.3 million in 2025, with visitor spending dropping 4.6% to USD 176 billion, leaving room for recovery. The FIFA World Cup 2026 is expected to attract 1.24 million international visitors, offering opportunities for sustainable operators to combine urban event traffic with nearby park and cultural experiences. International sustainable travelers typically stay longer and spend more per trip when clear certification standards are in place, emphasizing the importance of credible eco-labeling. Although smaller in volume, the international segment offers higher per-trip value for operators effectively promoting sustainability as a trusted booking factor.
Geography Analysis
The West accounted for 32.81% of the United States sustainable tourism market share in 2025, making it the largest regional contributor. Its dense concentration of national parks, conservation corridors, and outdoor destinations drives demand for ecotourism, adventure activities, and park-adjacent lodging. Hawaii led in outdoor recreation GDP share at 6.1% in 2024. Zion and Yellowstone National Parks recorded 4.98 million and 4.76 million visits, respectively, in 2025. However, climate and insurance challenges in wildfire-prone and water-stressed areas require operators to adopt resilience strategies to protect occupancy and pricing.
The South is projected to grow at a 9.93% CAGR through 2031, making it the fastest-growing regional segment and a key driver of the United States sustainable tourism market. Growth spans Appalachian ecotourism, Gulf Coast conservation projects, and outdoor activities in Tennessee, Georgia, and Texas. Great Smoky Mountains National Park, with 11.5 million visits in 2025, anchors eco-travel demand. In May 2026, investments in trails and outdoor recreation were reported to support tourism and economic growth in the Tennessee River Valley. The South’s diversification across nature, heritage, and community-led formats strengthens its position as a sustainable travel hub.
The Northeast and Midwest, though smaller, are gaining relevance through rail connectivity, urban sustainability, and nature-adjacent destinations. Amtrak’s low-emission fleet enhances rail travel in the Northeast Corridor. Acadia National Park attracted over 4 million visitors in 2025, highlighting the region’s potential. The Midwest benefits from Great Lakes ecotourism, lakeshore visits, and domestic leisure trends. These regions are becoming viable alternatives to crowded western destinations.
Competitive Landscape
The United States sustainable tourism market is fragmented, with major operators competing through distinct strategies. Booking Holdings, Expedia Group, and Airbnb focus on discovery, traffic, and itinerary diversity, while Marriott and Hilton leverage branded lodging portfolios and operational systems. Airbnb expanded its platform by adding independent hotels, car rentals, and grocery delivery, aiming to capture a larger share of travel spending. Hilton reported growth in its room development pipeline, showcasing the scale advantage of large hotel groups. Marriott announced new luxury deals, reflecting continued investment in hospitality formats that accommodate sustainability upgrades more effectively than smaller assets.
Specialized operators differentiate themselves through park access, conservation efforts, small-group travel, and direct guest engagement. Xanterra Travel Collection expanded its presence by acquiring a hotel near a major national park gateway. REI Co-op and Intrepid Travel launched a partnership offering small-group adventure trips, aligning with sustainable travel demand. Expedia introduced the Trails Fund, linking its brand to destination restoration and sustainability efforts. These actions demonstrate that factors like local access and trusted certifications remain critical in shaping competition within the market.
Opportunities exist in areas where large platforms fail to address traveler trust issues. Packaging for shoulder seasons near high-traffic park gateways can enhance visitor value through better capacity management. Certification discovery remains a challenge, as travelers struggle to compare eco-labels across channels and property types. Operators who simplify standards, combine lodging with meaningful experiences, and maintain direct guest connections are likely to gain market share. This dynamic explains why regional specialists and niche brands continue to thrive, even as larger travel groups expand their ecosystems.
United States Sustainable Tourism Industry Leaders
-
Booking Holdings Inc.
-
Expedia Group, Inc.
-
Airbnb, Inc.
-
Marriott International, Inc.
-
Hilton Worldwide Holdings Inc.
- *Disclaimer: Major Players sorted in no particular order
Recent Industry Developments
- May 2026: Expedia launched the Expedia Trails Fund, committing USD 4.3 million to 11 conservation projects with The Conservation Fund, The Nature Conservancy, and Trust for Public Land, benefiting over 1 million annual visitors to destinations like Yellowstone's Paradise Valley and Hawaii's Kealakekua Bay.
- May 2026: Airbnb expanded its platform by adding independent hotels, car rentals, and grocery delivery. This move into ground transportation increases competition with Booking Holdings and Expedia for the travel budgets of sustainable travelers.
- February 2026: Amtrak introduced its Airo fleet at a press event in Washington, DC. The first Airo trainsets will serve the Amtrak Cascades route in Fall 2026. The Airo locomotive reduces particulate emissions by 90% in diesel operations, with 83 trainsets planned for nationwide deployment.
- January 2026: The Department of the Interior announced a modernization of national park access, including digital passes, resident/non-resident pricing, and expanded motorcycle access. Effective January 1, 2026, these changes are expected to generate over USD 90 million annually for park maintenance.
United States Sustainable Tourism Market Report Scope
| Ecotourism |
| Cultural Tourism |
| Adventure Tourism |
| Wellness Tourism |
| Transportation |
| Accommodation |
| Food & Beverage |
| Activities & Experiences |
| Online Travel Agencies (OTAs) |
| Direct Booking (Hotels / Resorts / Operators) |
| Tour Operators / Travel Agencies |
| Destination Management Companies (DMCs) |
| Domestic Travelers |
| International Travelers |
| Northeast |
| Midwest |
| South |
| West |
| By Tourism Type | Ecotourism |
| Cultural Tourism | |
| Adventure Tourism | |
| Wellness Tourism | |
| By Service Type | Transportation |
| Accommodation | |
| Food & Beverage | |
| Activities & Experiences | |
| By Booking Channel | Online Travel Agencies (OTAs) |
| Direct Booking (Hotels / Resorts / Operators) | |
| Tour Operators / Travel Agencies | |
| Destination Management Companies (DMCs) | |
| By Traveler Type | Domestic Travelers |
| International Travelers | |
| By Region | Northeast |
| Midwest | |
| South | |
| West |
Key Questions Answered in the Report
What is the 2031 outlook for sustainable travel in the United States?
The United States sustainable tourism market is projected to reach USD 163.78 billion by 2031 from USD 106.76 billion in 2026, growing at a CAGR of 8.94%.
Which tourism type leads current demand in the United States?
Ecotourism leads with 34.31% share in 2025, supported by strong national park visitation and the scale of the outdoor recreation economy.
Which segment is growing the fastest through 2031?
Wellness tourism is forecast to expand at a 9.76% CAGR, reflecting stronger demand for retreat-led and nature-integrated travel formats.
Why do OTAs still matter so much for sustainable travel bookings?
OTAs held 42.91% share in 2025, and platforms such as Booking.com and Expedia are making certified inventory easier to find through badges, AI planning, and itinerary tools.
What is driving regional growth in the South?
The South is projected to grow at a 9.93% CAGR through 2031 because it is adding product depth across Appalachian ecotourism, Gulf Coast conservation travel, and outdoor recreation corridors.
How concentrated is competition among major operators?
Competition is widely dispersed, with the top 5 operators accounting for only 16.8% of 2025 revenue, which leaves room for regional and niche operators to scale.