
United States Sporting Goods Market Size and Share
Market Overview
| Study Period | 2021 - 2031 |
|---|---|
| Forecast Data Period | 2026 - 2031 |
| Base Year Market Size (2025) | USD 32.06 Billion |
| Market Size (2026) | USD 33.91 Billion |
| Market Size (2031) | USD 45.41 Billion |
| Growth Rate (2026 - 2031) | 6.01 % |
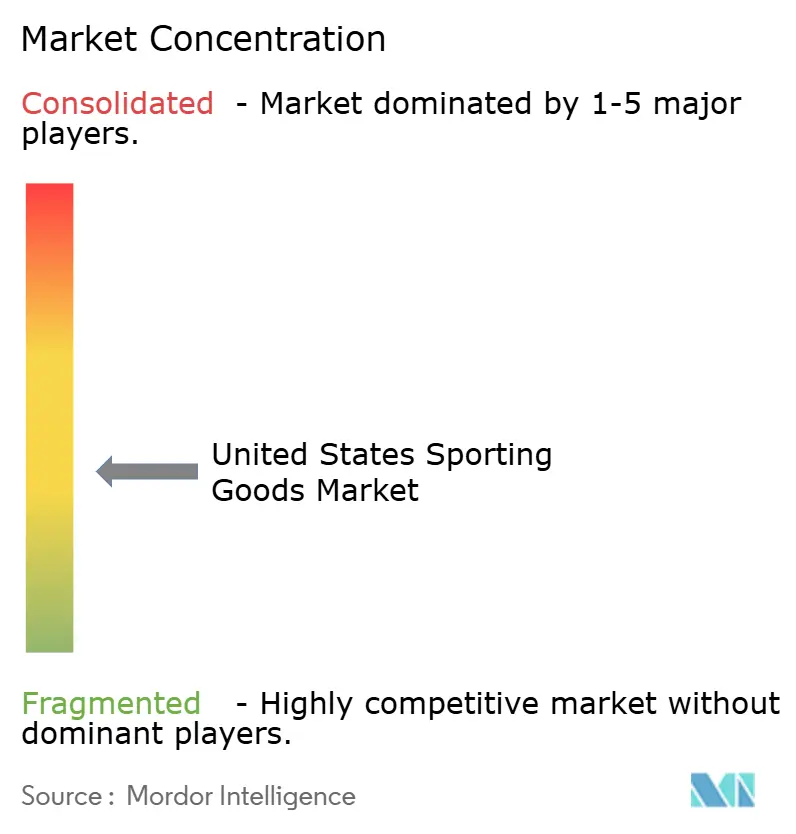
| Market Concentration | Medium |
Major Players *Disclaimer: Major Players sorted in no particular order Image © Mordor Intelligence. Reuse requires attribution under CC BY 4.0. | |
United States Sporting Goods Market Analysis by Mordor Intelligence
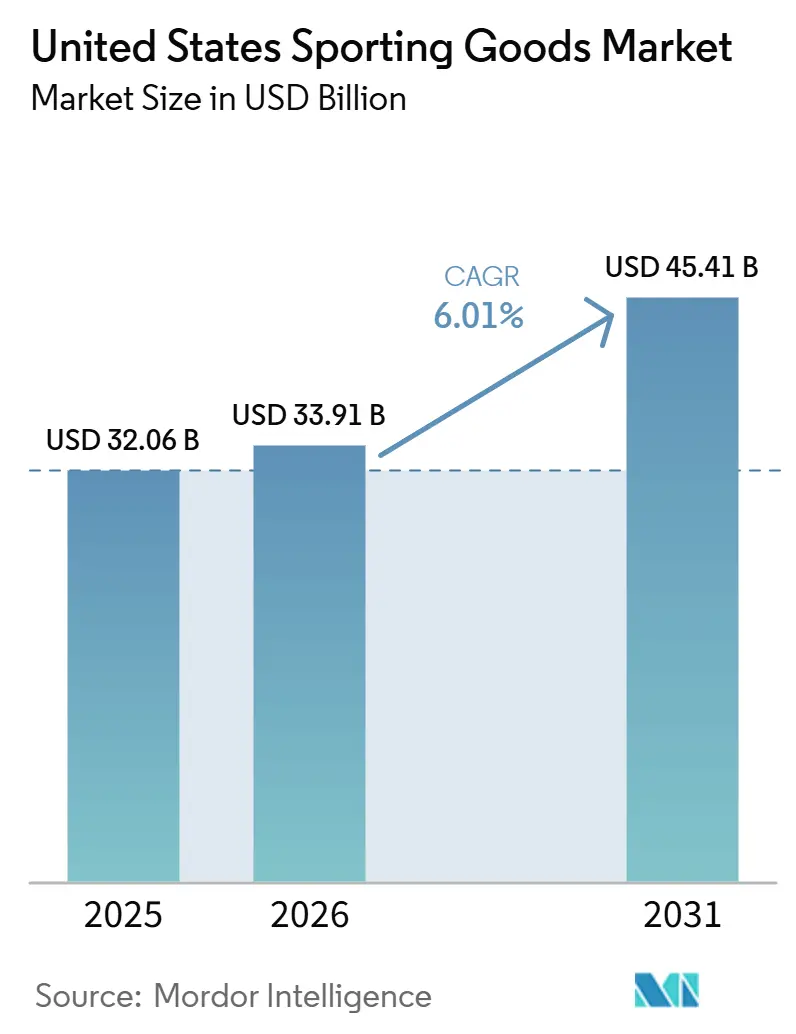
The United States sporting goods market size was valued at USD 32.1 billion in 2025 and is estimated to grow from USD 33.9 billion in 2026 to reach USD 45.4 billion by 2031, at a 6% CAGR during the forecast period from 2026 to 2031. The United States sporting goods market is supported by broad participation growth rather than a short-lived buying cycle. Participation depth is also expected to strengthen, with 250 million Americans participating in at least one sport, fitness, or leisure activity in 2025, pushing the participation rate above 80% for the first time in SFIA tracking[1]. Fitness facility usage is also reinforcing recurring replacement demand, with HFA expected to report 81 million US gym memberships in 2025 and membership penetration reaching 26.1% of the population[2]. Near-term pressure remains concentrated on trade costs, as the Federal Reserve noted that Chinese-origin goods recorded 8.5% year-on-year price increases by December 2025 and that tariff pass-through to consumers was at least 30%. Even so, the United States sporting goods market continues to benefit from institutional equipment purchases, ongoing footwear replacement, and expanding participation in sports such as pickleball.
Key Report Takeaways
- By product type, Equipment accounted for the largest share of the United States sporting goods market, at 42.5% in 2025, while Accessories is projected to grow at the fastest CAGR of 7.1% during 2026–2031.
- By sports type, Outdoor Sports accounted for the largest share of the United States sporting goods market, at 67.3% in 2025, while Adventure Sports is projected to grow at the fastest CAGR of 7.4% during 2026–2031.
- By end user, Men accounted for the largest share of the United States sporting goods market, at 57.4% in 2025, while Women are projected to grow at the fastest CAGR of 7.8% during 2026–2031.
- By distribution channel, Offline Retail Stores accounted for the largest share of the United States sporting goods market, at 68.6% in 2025, while Online Retail Stores are projected to grow at the fastest CAGR of 7.8% during 2026–2031.
Note: Market size and forecast figures in this report are generated using Mordor Intelligence’s proprietary estimation framework, updated with the latest available data and insights as of January 2026.
United States Sporting Goods Market Trends and Insights
Drivers Impact Analysis*
| Driver | (~) % Impact on CAGR Forecast | Geographic Relevance | Impact Timeline |
|---|---|---|---|
| Sustained participation in fitness and recreation | +1.8% | National, with stronger demand density in major metro areas | Long term (≥ 4 years) |
| Expansion of pickleball and emerging sports participation | +1.0% | National, with strong traction in suburban and Sun Belt communities | Medium term (2-4 years) |
| Growth in athletic footwear replacement cycles | +0.9% | National, especially in running, gym, and outdoor activity corridors | Medium term (2-4 years) |
| Institutional spending on school and commercial fitness equipment | +0.7% | National, with visible support from school and public wellness programs | Long term (≥ 4 years) |
| Dtc and omnichannel acceleration | +1.1% | National, with stronger benefits in markets where digital and store networks overlap | Short term (≤ 2 years) |
| Product innovation in connected and premium equipment | +0.9% | National, strongest in premium consumer and commercial demand pockets | Medium term (2-4 years) |
| Source: Mordor Intelligence | |||
Sustained Participation in Fitness and Recreation
The United States sporting goods market is benefiting from a larger active consumer base. SFIA projects that 250 million Americans will participate in at least one sport, fitness, or leisure activity in 2025. Team sports alone are expected to surpass 90 million participants, increasing demand for equipment, footwear, and related accessories across age groups. SFIA also expects the inactive share to fall below 20% for the first time, expanding the long-term addressable customer base for the United States sporting goods market. The Bureau of Economic Analysis indicates that personal consumption expenditures on membership clubs and participant sports centers may reach USD 85 billion in 2025, up from USD 81.5 billion in 2024, showing that spending continues to shift toward active recreation channels. This demand base remains important because recurring activity typically drives recurring replacement cycles rather than one-time purchases in the United States sporting goods market.
Expansion of Pickleball and Emerging Sports Participation
Pickleball has emerged as one of the clearest growth drivers in the United States sporting goods market. SFIA also projects that 24.3 million Americans will play pickleball in 2025, up 22.8% from the previous year and up 479% from 2020[3]. Growth is not limited to casual trial, as both occasional and core participation are increasing simultaneously, supporting repeat spending on paddles, footwear, balls, and protective products. SFIA is also expected to add padel and disc golf to its participation tracking in 2026, signaling that the United States sporting goods market continues to create new equipment demand pockets beyond current mainstream categories.
Growth in Athletic Footwear Replacement Cycles
Athletic footwear remains one of the most dependable replacement-driven categories in the United States sporting goods market. According to SFIA, US athletic footwear wholesale sales stood at USD 24.1 billion in 2025, increasing 7.4% year-on-year. Running footwear reached USD 7.1 billion, fitness and workout shoes reached USD 2.5 billion, and outdoor or adventure footwear also recorded strong gains, indicating broad-based demand rather than concentration in a single sport. This trend is significant because consumers replace footwear more frequently than most hard goods, particularly as participation increases in running, training, hiking, and court sports. The United States sporting goods market also continues to benefit as brands use product positioning and premium features to shorten repurchase cycles and sustain value growth.
Institutional Spending on School and Commercial Fitness Equipment
Institutional buying is creating a steadier base for the United States sporting goods market. SFIA wholesale data for 2025 indicate broad-based growth in institutional fitness equipment, even as parts of the consumer home category declined. This shift is moving more demand toward schools, universities, fitness facilities, and other organized settings, where buyers plan replacement and upgrade cycles more systematically. HFA reported 81 million gym memberships in 2025, which helps explain why suppliers serving commercial facilities remain better positioned than those that rely solely on home-use demand. The United States sporting goods market also benefits as public institutions and recreation operators redesign fitness spaces around strength, movement, and multi-use training rather than focusing only on cardio equipment.
Restraints Impact Analysis*
| Restraint | (~) % Impact on CAGR Forecast | Geographic Relevance | Impact Timeline |
|---|---|---|---|
| Tariff and trade policy volatility | -1.2% | National, with sharper pressure on import-reliant channels and coastal logistics networks | Short term (≤ 2 years) |
| Price sensitivity and private label substitution | -0.8% | National, especially in value-seeking household segments | Medium term (2-4 years) |
| Softness in consumer home fitness demand | -0.5% | National, especially in households that already bought major equipment earlier | Medium term (2-4 years) |
| Inventory overhang and promotion intensity | -0.4% | National, strongest in footwear and apparel categories with higher markdown exposure | Short term (≤ 2 years) |
| Source: Mordor Intelligence | |||
Tariff and Trade Policy Volatility
Trade costs remain the clearest near-term drag on the United States sporting goods market. The Federal Reserve reported that Chinese-origin goods are expected to register an 8.5% year-on-year price increase by December 2025. The same Federal Reserve note stated that tariff pass-through to consumers would reach at least 30% from April to December 2025, indicating that higher landed costs are moving to retail shelves. Nike also noted an expected USD 986 million recovery tied to prior tariff impacts, highlighting that the issue is material at the company level and not limited to policy discussions. The United States sporting goods market remains exposed, as many product lines still depend on Asian sourcing for footwear, equipment, and accessories.
Price Sensitivity and Private Label Substitution
Household trade-down behavior is limiting pricing power in the United States sporting goods market. PLMA reported that US private label sales across consumer categories rose by nearly 4% to a record USD 271 billion. PLMA also noted that the price gap between private labels and national brands has widened by 38% since 2019, increasing the appeal of lower-cost alternatives as budgets tighten. This trend matters for sporting goods because manufacturers can more easily replicate performance apparel, accessories, and basic equipment lines than high-specification or regulated products. As a result, the United States sporting goods market rewards brands that defend premium pricing through design, materials, product utility, and stronger customer loyalty. Companies that combine differentiated products with targeted promotions and value-oriented assortments are better positioned to retain consumers without materially diluting brand equity.
*Our forecasts treat driver/restraint impacts as directional, not additive. The impact forecasts reflect baseline growth, mix effects, and variable interactions.
Segment Analysis
By Product Type: Equipment Scale Anchors the Market, Accessories Gain Ground Fast
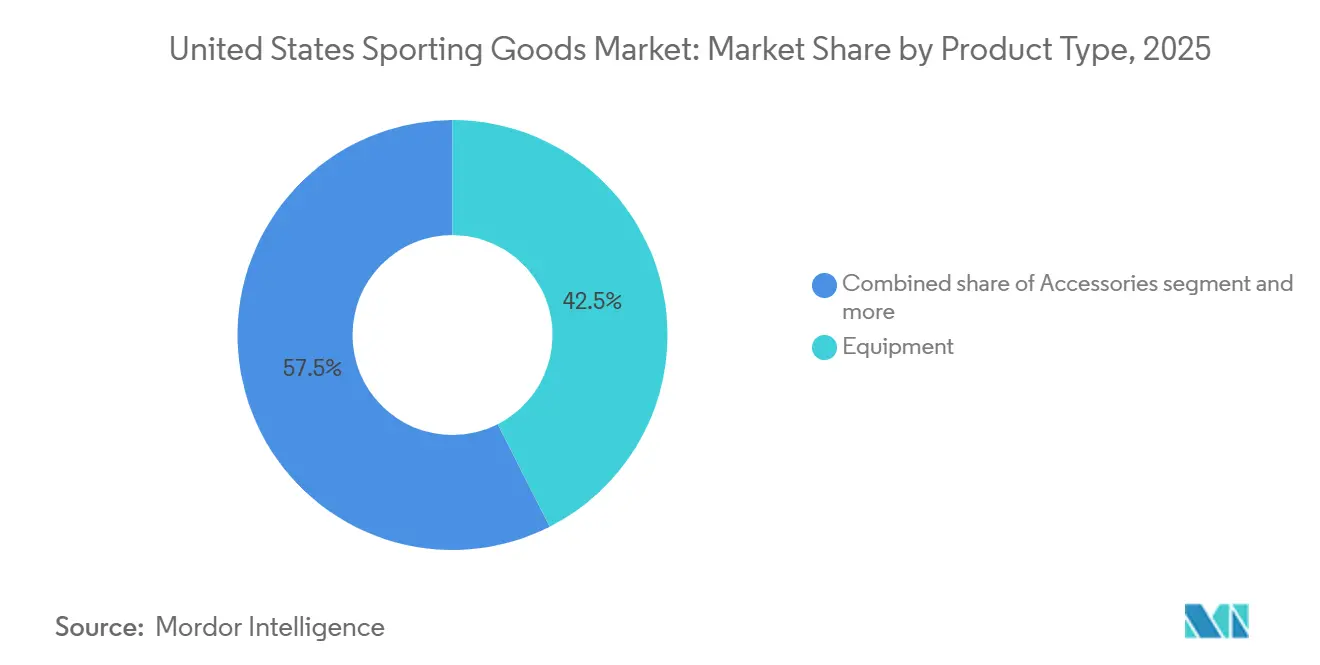
Equipment is expected to account for 42.5% of the United States sporting goods market by value in 2025, making it the largest product type in the category mix. The segment benefits from its position as the primary purchase category across team sports, racquet sports, golf, fitness, and several outdoor activities. SFIA expects baseball and softball equipment wholesale sales to grow by 7.9% in 2025, indicating that demand for hard goods remains active in organized sports. Institutional fitness equipment is also expected to record broad gains in 2025, helping sustain the Equipment segment’s base even as some home-use demand softens. Equipment, therefore, remains central to the United States sporting goods market share, as it supports both participation-led spending and commercial procurement.
Accessories is expected to be the fastest-growing product type in the United States sporting goods market, with a forecast CAGR of 7.1% from 2026 to 2031. Shorter replacement cycles, lower ticket sizes, and a broader range of use cases across hydration, monitoring, resistance training, eyewear, and sport-specific add-ons support this growth. The segment also benefits when consumers delay major purchases but continue to seek performance improvements through smaller-ticket items. Protective categories retain value because safety expectations create a quality floor, especially in youth-oriented activities. Sports bags and related carry products also benefit from broader daily use, enabling the segment to capture both athletic and lifestyle spending in the United States sporting goods market.

By Sports Type: Outdoor Scale Leads, Adventure Sports Grow the Fastest
Outdoor Sports is projected to account for 67.3% of the United States sporting goods market size in 2025, making it the dominant sports type by a wide margin. This position reflects the wide range of activities included in the category, such as trail running, cycling, fishing, camping, tennis, and golf. The Outdoor Industry Association's 2026 participation study is expected to report participation gains among children, adults aged 65 and older, and Hispanic participants, indicating that demand is broadening across several demographic groups. This broad user base is expected to support continued spending on footwear, apparel, equipment, and accessories across multiple seasons. Therefore, Outdoor Sports provides the scale foundation for the United States sporting goods market.
Adventure Sports is the fastest-growing sports type in the United States sporting goods market, with a projected CAGR of 7.4% through 2031. Categories such as climbing, mountaineering, whitewater sports, and backcountry sports typically require more specialized products, giving suppliers stronger pricing support than more standardized segments. This requirement also makes the category less vulnerable to low-cost substitution, as technical performance and safety play a larger role in purchase decisions. The segment remains smaller than Outdoor Sports, but it has higher value intensity because many products are purpose-built rather than interchangeable. This combination makes Adventure Sports an important premium growth pocket within the United States sporting goods market.
By End User: Men Lead the Base, Women Drive the Strongest Growth
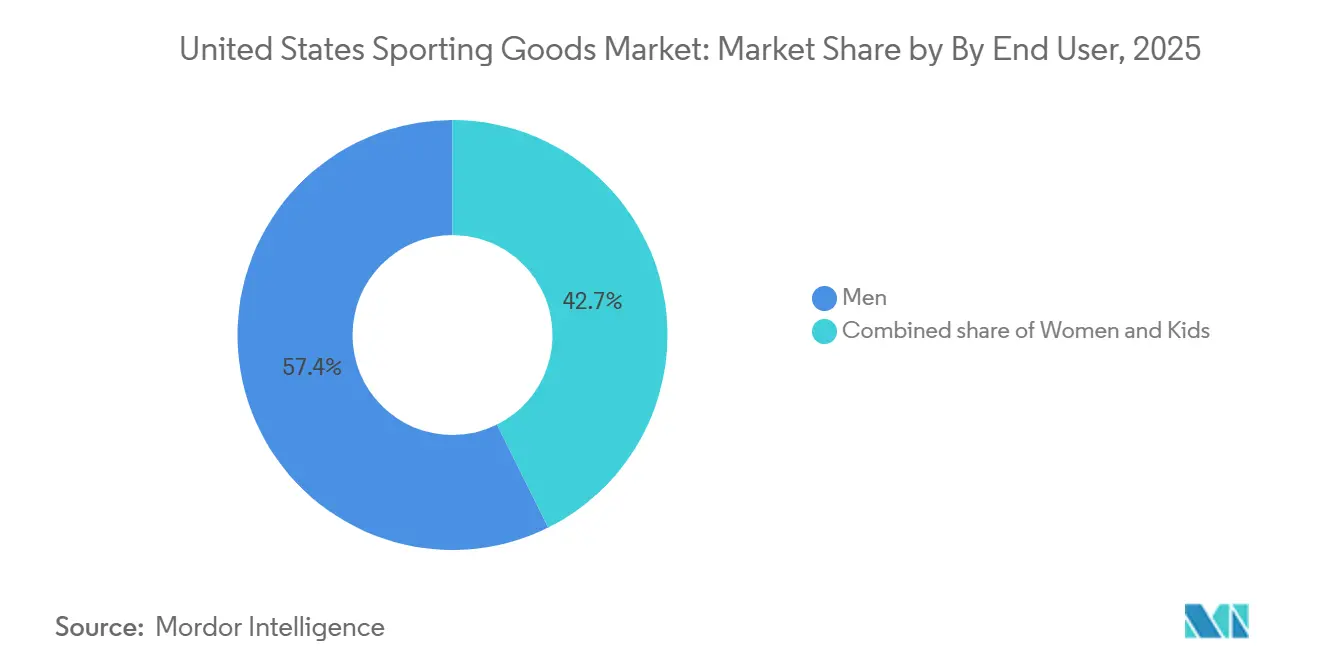
Men are expected to account for 57.4% of spending in the United States sporting goods market in 2025, making them the largest end-user segment by value. The segment remains broad, as men have strong representation across footwear, equipment-intensive activities, team sports, and training formats. This scale reflects both participation and replacement demand, particularly in footwear and equipment categories with high usage frequency. The existing spending base also supports many large brands and retailers with strong male-oriented assortments. As a result, men are expected to remain the anchor segment for current revenue in the United States sporting goods market.
Women are projected to record the fastest CAGR of 7.8% from 2026 to 2031 in the United States sporting goods market. NCAA data showed 242,341 women student-athletes in 2024 to 2025, up 14% from a decade earlier, indicating a larger long-term participation pipeline. Growth in this segment is strongest when brands design products specifically for women rather than adapting men’s designs. Nike’s SKIMS Studio Stretch collection is expected to launch in May 2026, while Lululemon continues to expand its women’s performance offerings, showing that major brands are investing in the segment through product design and brand architecture. This positions women as the most important growth vector in the United States sporting goods market, even though men still account for the larger current revenue base.
By Distribution Channel: Offline Stores Keep Scale, Online Retail Expands Faster
Offline retail stores are projected to account for 68.6% of the distribution share in the United States sporting goods market in 2025, maintaining their position as the dominant channel. Physical stores remain important because customers often seek fit support, product trials, expert guidance, and same-day fulfillment before purchasing higher-value sporting goods. Dick’s Sporting Goods is expected to operate 35 House of Sport locations after opening 16 stores in 2025, highlighting continued investment in store-led experiential formats. Dick’s also announced a partnership with Lids that is set to expand to more than 100 Dick’s locations by late summer 2026, reinforcing the role of stores in cross-category merchandising. As a result, offline retail is expected to continue leading the United States sporting goods market share, as store presence remains closely linked to conversion across many equipment and footwear purchases.
Online retail stores are expected to record the fastest CAGR of 7.8% from 2026 to 2031 in the United States sporting goods market. Convenience, product discovery, broader assortments, and stronger links between digital engagement and brand-owned ecosystems are supporting this growth. However, Nike’s 20% decline in NIKE Brand Digital during FY2025 indicates that digital growth is not automatic when pricing discipline and product freshness weaken. The strongest model is now a connected channel structure, where online platforms drive traffic and provide product information, while physical stores close sales or support repeat purchases. This channel structure gives online retail the faster growth outlook, even though store-led formats continue to control the larger current base in the United States sporting goods market.
Geography Analysis
The largest demand base in the United States sporting goods market remains concentrated in regions with high participation rates, organized sports activity, and developed fitness infrastructure. BEA reported USD 85 billion in personal consumption expenditures on membership clubs and participant sports centers in 2025, indicating a broad national spending base with stronger demand in mature recreation and fitness corridors. SFIA also showed that team sports participation and organized activity remained strong enough to support equipment- and uniform-related demand through 2025. In this environment, larger established regional markets continue to benefit from the combined demand generated by school sports, fitness membership usage, and outdoor recreation, supporting the United States sporting goods market.
The fastest-moving regional pockets in the United States sporting goods market are benefiting from newer participation trends and retail white space. SFIA reported 24.3 million pickleball participants in 2025, with this growth proving especially relevant for suburban and Sun Belt communities, where new court access can quickly translate into demand for equipment and footwear. Academy Sports also continued to expand into underserved areas and stated that it targets markets often located 20 to 50 miles from the nearest major competitor, supporting faster channel development in less penetrated locations. These conditions make fast-adopting recreation corridors important growth pockets for the United States sporting goods market, even if they are not yet the largest contributors by current value.
The broader geographic picture remains uneven, but the United States sporting goods market continues to have multiple long-term support points. Outdoor Industry Association findings on stronger participation among Hispanic consumers, children, and adults aged 65 and older indicate that future demand will spread across more communities and use cases. HFA’s record 81 million memberships and nearly 7 billion annual facility visits in 2025 also show that active living remains embedded across many local markets. Federal Reserve data on tariff pass-through indicate that import-heavy regions and channels remain more exposed to near-term price pressure. Despite this pressure, the United States sporting goods market continues to draw support from a wide national participation base, organized sports demand, and continued investment by retailers and brands. This combination suggests that regional volatility will persist, but the overall geographic footprint of demand remains broad and durable in the United States sporting goods market.
Competitive Landscape
The United States sporting goods market remains moderately fragmented, although a small group of global brands and large retailers continues to influence several high-value categories. Nike remains one of the most influential players, even as its fiscal 2025 revenue declined 10% to USD 46.3 billion and NIKE Brand Digital fell 20%. This performance shows that brand scale alone is not enough when channel balance, inventory control, and sourcing costs come under pressure. The same pattern creates opportunities for specialty players that can move faster in narrower product areas, such as pickleball, technical outdoor gear, and connected fitness.
Large companies are responding with direct strategic moves rather than relying only on brand recognition. Dick’s Sporting Goods announced its USD 2.5 billion acquisition of Foot Locker, strengthening its ability to cover multiple sports retail formats under a broader platform. Dick’s also expanded its House of Sport concept and deepened its partnership with Lids, indicating a clear push toward experience-led retail and category expansion. Adidas continued to use product engineering as a competitive tool through launches such as the BB.01 and the Supernova Rise 3 Adaptive, supporting differentiation through materials and design. Under Armour also emphasized innovation through the UA Flare and the Bouncy Tee, showing that performance stories and material science continue to influence consumer choice.
The competitive opening in the United States sporting goods market is strongest where demand is expanding faster than supply depth. SFIA’s 22% wholesale growth in pickleball equipment during 2025 shows that some newer categories still have room for both established brands and focused specialists. Women’s performance products also remain a valuable growth area because the segment is expanding faster than the overall market and rewards purpose-built design. Peloton’s Commercial Series launch adds another layer of pressure in institutional fitness, especially as the company tries to rebuild share in connected and commercial formats. At the same time, CPSIA compliance continues to set a minimum quality threshold in youth-oriented categories, limiting the extent to which cost-only competition can succeed in safety-sensitive sporting goods.
United States Sporting Goods Industry Leaders
-
Nike, Inc.
-
Adidas AG
-
Dick’s Sporting Goods, Inc.
-
Under Armour, Inc.
-
Lululemon Athletica Inc.
- *Disclaimer: Major Players sorted in no particular order
Recent Industry Developments
- July 2026: Under Armour introduced the UA Flare, powered by Liquid Baselayer technology and DESMA direct-injection construction, bringing a second-skin adaptive fit to performance footwear for the first time.
- June 2026: Dick’s Sporting Goods partnered with Lids to open dedicated Lids headwear shops inside more than 100 Dick’s locations by late summer 2026, starting with 46 operational locations across California, Colorado, New York, and Texas.
- May 2026: Under Armour launched the Bouncy Tee, which incorporates NEOLAST fiber blended with Pima cotton to provide adaptive stretch and long-lasting shape retention.
- April 2026: Under Armour launched the Shadow Elite 4 football boot at EUR 270 (approximately USD 291; a million-equivalent value is not applicable because this is a unit product price rather than an aggregate market value). The boot features 3D-printed plate components and precision traction geometry.
United States Sporting Goods Market Report Scope
| Equipment |
| Protective Gears |
| Sports Bags |
| Accessories |
| Outdoor Sports |
| Indoor Sports |
| Adventure Sports |
| Other Sports |
| Women |
| Men |
| Kids |
| Offline Retail Stores |
| Online Retail Stores |
| By Product Type | Equipment |
| Protective Gears | |
| Sports Bags | |
| Accessories | |
| By Sports Type | Outdoor Sports |
| Indoor Sports | |
| Adventure Sports | |
| Other Sports | |
| By End User | Women |
| Men | |
| Kids | |
| By Distribution Channel | Offline Retail Stores |
| Online Retail Stores |
Key Questions Answered in the Report
What is the 2031 outlook for United States sporting goods demand?
The United States sporting goods market is forecast to reach USD 45.4 billion by 2031, rising from USD 33.9 billion in 2026 at a 6% CAGR.
Which product category leads current revenue in the United States sporting goods space?
Equipment leads with 42.5% of 2025 value, supported by demand across team sports, fitness, golf, racquet sports, and organized recreation.
Which channel is growing faster between stores and e-commerce?
Online Retail Stores are projected to grow faster at 7.8% CAGR, but Offline Retail Stores still held the larger 68.6% share in 2025.
Which end-user group offers the best growth potential through 2031?
Women show the strongest growth outlook with a forecast 7.8% CAGR, while Men remain the largest spending group at 57.4% in 2025.