
United States Plastic Waste Management Services Market Size and Share
Market Overview
| Study Period | 2020 - 2031 |
|---|---|
| Forecast Data Period | 2026 - 2031 |
| Base Year Market Size (2025) | USD 6.55 Billion |
| Market Size (2026) | USD 6.80 Billion |
| Market Size (2031) | USD 8.23 Billion |
| Growth Rate (2026 - 2031) | 3.89 % |
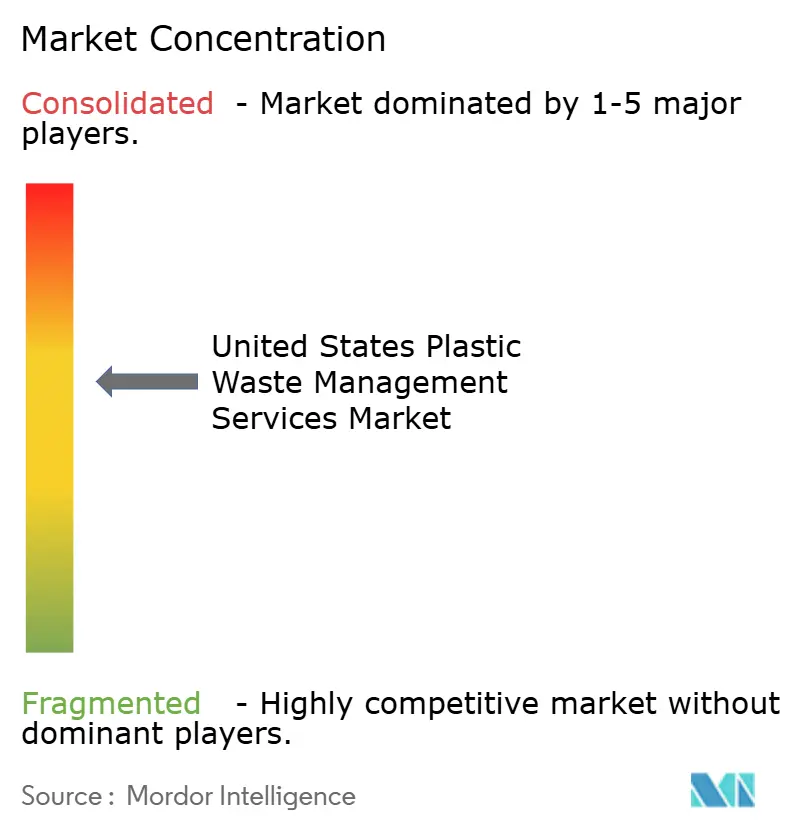
| Market Concentration | Medium |
Major Players *Disclaimer: Major Players sorted in no particular order Image © Mordor Intelligence. Reuse requires attribution under CC BY 4.0. | |
United States Plastic Waste Management Services Market Analysis by Mordor Intelligence
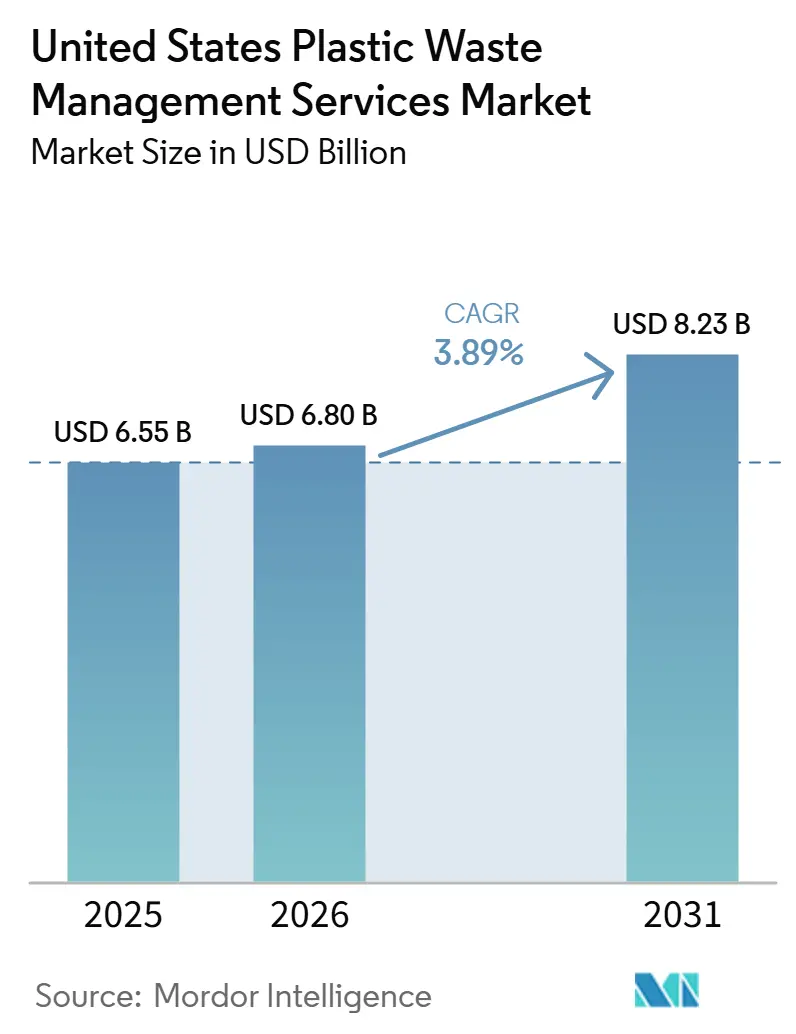
The United States Plastic Waste Management Services Market size is projected to expand from USD 6.55 billion in 2025 and USD 6.80 billion in 2026 to USD 8.23 billion by 2031, registering a CAGR of 3.89% between 2026 to 2031.
The United States plastic waste management services market is being shaped by higher disposal costs, tighter state packaging rules, and rising private investment in recycling assets that can process more material with better yield. Rising landfill tipping fees are making diversion more viable in many regions, while mandatory recycled-content laws are giving recovered resin a firmer demand base than in earlier cycles, which relied more on commodity pricing. The United States plastic waste management services market is also becoming more uneven by geography because infrastructure spending is clustering in states with active extended producer responsibility programs, which is lifting capacity and service quality faster in those regions. Competition in the United States plastic waste management services market spans large integrated haulers, municipal systems, and specialized recyclers, and the business model is moving toward fee-based contracts that reduce direct exposure to swings in secondary resin prices. The main constraint on the United States plastic waste management services market remains the gap between policy targets and physical readiness, because the EPA still sees a multibillion-dollar infrastructure need and flexible packaging remains difficult to recover at scale.
Key Report Takeaways
- By source, industrial led with 41.2% revenue share in 2025, while commercial is forecast to expand at a 4.7% CAGR through 2031.
- By service provider, public and municipal systems held 44.9% of the United States plastic waste management services market share in 2025, while private waste management companies are projected to record the fastest 5.9% CAGR through 2031.
- By service type, collection, transportation, sorting, and segregation accounted for 42.8% of the United States plastic waste management services market size in 2025, while disposal and treatment is advancing at a 5.3% CAGR through 2031.
Note: Market size and forecast figures in this report are generated using Mordor Intelligence’s proprietary estimation framework, updated with the latest available data and insights as of January 2026.
United States Plastic Waste Management Services Market Trends and Insights
Drivers Impact Analysis*
| Driver | (~) % Impact on CAGR Forecast | Geographic Relevance | Impact Timeline |
|---|---|---|---|
| Mandatory Recycled Content Requirements for Plastic Packaging | +1.2% | National, with concentrated compliance activity in California, New Jersey, Maine and Washington | Medium term (2-4 years) |
| Escalating Landfill Tipping Fees Improving Recycling Economics | +1.0% | National, most acute in Northeast and Pacific Coast states, where average fees exceed USD 100 per ton | Short term (≤ 2 years) |
| Growing Investments by Integrated Waste Companies in Recycling Capacity | +0.7% | National, with major project concentrations in the Midwest, Southeast, and Pacific Northwest | Medium term (2-4 years) |
| Growth in Public-Private Partnerships for Municipal Recycling Operations | +0.6% | National, notable activity in the Mid-Atlantic, Southeast, and Mountain West | Medium term (2-4 years) |
| Increasing Industrial Plastic Scrap Recovery from Manufacturing | +0.5% | Midwest manufacturing belt and Southeast automotive and industrial corridors | Long term (≥ 4 years) |
| Increasing Demand for Closed-Loop Packaging Supply Chains | +0.4% | National, led by consumer-packaged goods hubs in California, Texas, and the Midwest | Long term (≥ 4 years) |
| Source: Mordor Intelligence | |||
Mandatory Recycled Content Requirements for Plastic Packaging
State recycled-content laws are creating a firmer demand floor for recovered resin in the United States plastic waste management services market, as they move demand beyond voluntary packaging pledges. By August 2025, 5 states had enacted minimum post-consumer recycled content laws for plastic packaging, and Maine moved to a 25% requirement for plastic beverage containers effective January 1, 2026. California is also pushing a broad packaging shift under SB 54, which requires all single-use packaging to be recyclable or compostable by 2032 and is already influencing brand redesigns and supplier choices. A 2024 UC Berkeley study cited by APR found that a 40% national recycled content requirement by 2050 could cut United States plastic waste by 50%, lower virgin plastic production by 44%, and reduce greenhouse gas emissions by 17%, which helps explain why long-range infrastructure planning is now leaning more heavily toward recovery capacity. Compliance systems are also becoming more formal as states use verification tools such as APR certification approaches and CalRecycle rulemaking structures, which support more bankable demand conditions for sorting and reprocessing projects.
Escalating Landfill Tipping Fees Improving Recycling Economics
The United States plastic waste management services market is benefiting from rising disposal costs, which improve the relative economics of diversion even when recycled commodity prices are weak. In states with waste-to-energy capacity, the average fee reached USD 71.3 per ton, compared with USD 55.6 per ton in states without that infrastructure, indicating that disposal pressure is strongest in denser coastal systems. That pressure is helping the United States plastic waste management services market move toward fee-for-service pricing, as operators can more directly justify processing charges against avoided disposal costs. Waste Connections stated in its annual filing that it increased recycling collection and processing fees to reflect actual costs better.
Growing Investments by Integrated Waste Companies in Recycling Capacity
Large operators are widening their lead in the United States plastic waste management services market through sustained capital spending on automated plants and higher-quality sortation systems. WM said it had completed 29 of 39 planned recycling facility projects by Q2 2025. In July 2026, it opened the USD 110 million Denver East Recycling Facility with capacity for more than 175,000 tons annually and more than 30 AI-enabled optical sorting stations. WM also reported more than 22% operating EBITDA growth in its recycling segment in 2025, despite single-stream commodity prices that were nearly 20% lower, indicating that automation and volume gains are starting to offset weaker resin markets. Republic Services opened its Indianapolis Polymer Center in March 2025 as the first of 4 planned Blue Polymers sites, and each facility is designed to produce 175 million pounds of recycled plastic annually, split evenly between PET and polyolefins. This pattern is making the United States plastic waste management services market harder for smaller operators, as scale, automation, and integrated resin output are now more closely tied to margin resilience and contract competitiveness.
Growth in Public-Private Partnerships for Municipal Recycling Operations
Public-private partnership structures are gaining traction in the United States plastic waste management services market because they provide private operators with longer contract visibility and give municipalities access to technology they often cannot fund on their own. In November 2025, the Southeastern Public Service Authority signed a 20-year agreement with Commonwealth Sortation, an AMP affiliate, to process solid waste from 8 communities serving 1.2 million residents, using AI-enabled lines capable of handling 540,000 tons per year. In June 2025, Circular Services was selected by Mecklenburg County to operate 2 material recovery facilities under a 5-year agreement while the county retrofits its main Metrolina site. These partnerships are also improving processing performance by combining public waste collection networks with private-sector expertise in automation, material recovery, and operational efficiency. Longer terms matter because they let automation costs be spread over more years, helping more advanced operators win large municipal work in the United States plastic waste management services market.
Restraints Impact Analysis*
| Restraint | (~) % Impact on CAGR Forecast | Geographic Relevance | Impact Timeline |
|---|---|---|---|
| Capital-Intensive Modernization of Material Recovery Facilities | -1.2% | National, most acute in EPR mandate states, where material stream complexity is highest | Long term (≥ 4 years) |
| Low Recovery Rates for Flexible Films and Multi-Layer Packaging | -0.9% | National, particularly pronounced in CA, OR, and CO, given aggressive diversion mandates | Long term (≥ 4 years) |
| Insufficient Standardization of Accepted Recyclable Plastics | -0.6% | National, cross-municipal inconsistency is most visible in the Northeast and Midwest metro corridors | Medium term (2-4 years) |
| High Transportation Costs for Low-Density Plastic Waste | -0.4% | Rural areas, the Mountain West, and sparsely populated Southern states | Short term (≤ 2 years) |
| Source: Mordor Intelligence | |||
Capital-Intensive Modernization of Material Recovery Facilities
The United States plastic waste management services market still faces a significant capital barrier, as many facilities require major upgrades before policy targets can be met. Project examples clearly show the scale, with Lane County's facility estimated at USD 150 million, Rumpke's Columbus center at USD 100 million, and Atlantic Coast Recycling's Passaic redevelopment at USD 47 million. For smaller public systems and rural municipalities, those investment levels are difficult to absorb without deep grant support or a stable producer responsibility funding stream. Higher financing costs and uncertainty over long-term feedstock volumes further delay investment decisions, particularly for independent recyclers and local government-owned facilities. The problem is also recurring because accepted material lists are changing, so sites upgraded for current streams may need more equipment again within 3 to 5 years as packaging rules expand.
Low Recovery Rates for Flexible Films and Multi-Layer Packaging
Flexible packaging remains one of the hardest bottlenecks in the United States plastic waste management services market because its collection and processing costs stay out of line with most curbside systems. APR stated in October 2025 that flexible plastic packaging accounts for 34% of United States plastic packaging by weight, yet less than 1% is recycled through national programs. Loose film has very low bulk density, at 35 to 55 kg/m3 before densification, and APR estimated curbside collection costs at USD 200 to USD 350 per ton, which makes route economics weak even before sorting losses are considered. Multi-layer packaging adds another barrier because mixed structures with polymer and foil layers do not separate well in conventional mechanical systems, which leaves chemical recycling or energy recovery as the main outlets in many cases. Idaho National Laboratory found that flexible packaging recycling could rise to 22% to 61% by 2050 under more favorable assumptions.
*Our forecasts treat driver/restraint impacts as directional, not additive. The impact forecasts reflect baseline growth, mix effects, and variable interactions.
Segment Analysis
By Source: Industrial Volumes Anchor Revenue, Commercial Activity Accelerates
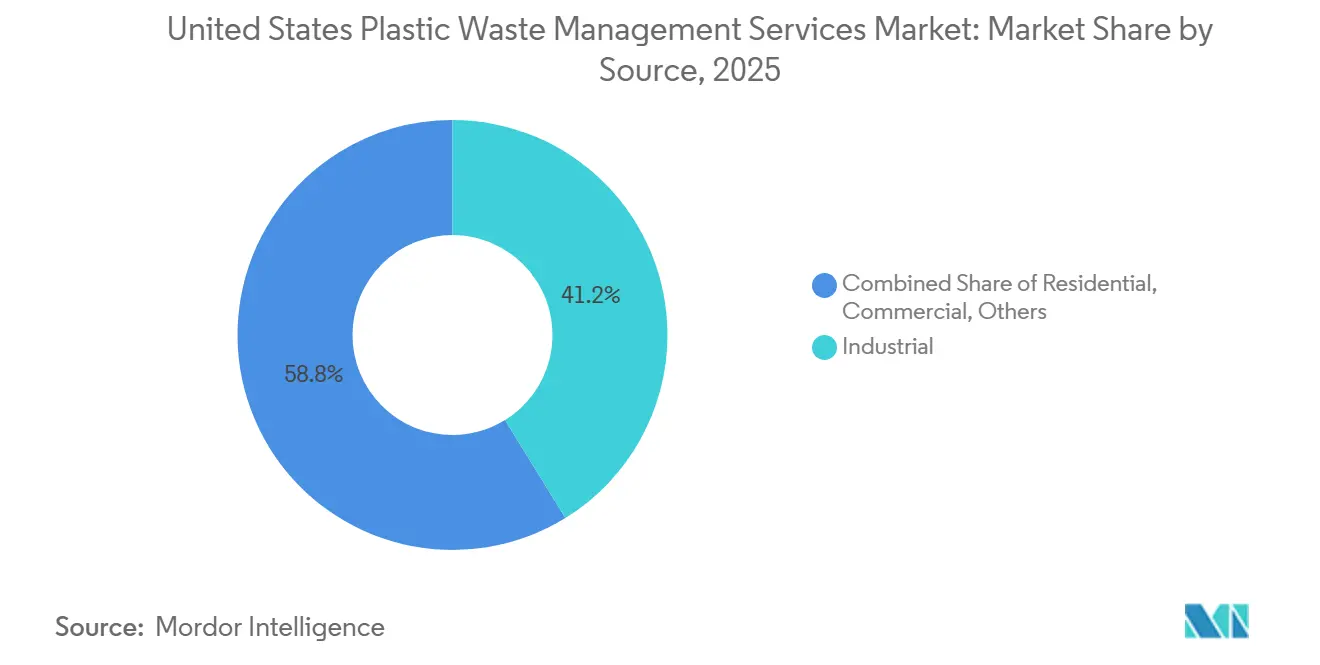
Industrial sources accounted for 41.2% of the United States plastic waste management services market share in 2025, which made them the largest revenue base among source categories. That position reflects the steady flow of post-industrial scrap from automotive, electronics, chemical, and logistics operations, where plastics are generated in concentrated volumes. These streams usually contain cleaner purges, off-spec pellets, film trim, and molded rejects, so they need less sorting and contamination control than post-consumer loads. The cleaner input profile gives service providers better margins and more predictable throughput in the United States plastic waste management services market.
This advantage is evident in current investment patterns: United States Plastics Recovery doubled shredding and granulating capacity at its Lawrenceville, Georgia, site in January 2026 to handle nearly 50 million pounds of post-industrial polymer a year. Commercial sources are the fastest-growing category and are projected to grow at a 4.7% CAGR through 2031, supported by retailers, food service chains, offices, and other clustered generators that lend themselves well to dedicated route planning. Residential volumes remain important, but they bring higher collection and contamination costs because routes are fragmented and sorting behavior varies widely across households. The others segment, which includes institutions, healthcare, and agriculture, remains smaller but is gaining attention as agricultural film accumulation in Midwestern states draws more notice from state agencies and specialist collectors.



By Service Provider: Public Systems Lead, Private Operators Drive Forward Growth
Public and municipal operators accounted for 44.9% of revenue in 2025, keeping them in the lead across provider types, as residential curbside collection and landfill functions remain heavily within local systems. That share shows how embedded government-operated networks remain in the United States plastic waste management services market, especially where collection routes and disposal assets are closely tied to local budgets and rate structures. Municipal systems also benefit from volume aggregation and public authority, which helps them retain a strong role even as sorting complexity rises. At the same time, new compliance demands are putting more strain on public operators because broader-accepted material lists and higher output standards require technology and spending that many systems do not have in-house.
Private waste management companies are forecast to expand at a 5.9% CAGR through 2031, the fastest growth pace among provider groups, reflecting stronger access to capital, greater automation, and longer contract terms. The United States plastic waste management services market is therefore moving toward a split model, in which municipalities often retain collection relationships. At the same time, private firms take over processing, sortation upgrades, and secondary material marketing. That pattern can be seen in the SPSA agreement with Commonwealth Sortation and in Mecklenburg County's selection of Circular Services to operate 2 material recovery facilities under a multiyear arrangement. The smaller others segment, which includes producer responsibility organizations and related compliance entities, is still early in the United States plastic waste management services market, but should gain relevance as state packaging laws mature and more brand owners seek managed compliance channels.
By Service Type: Collection Anchors Revenue, Disposal, and Treatment Services Accelerate
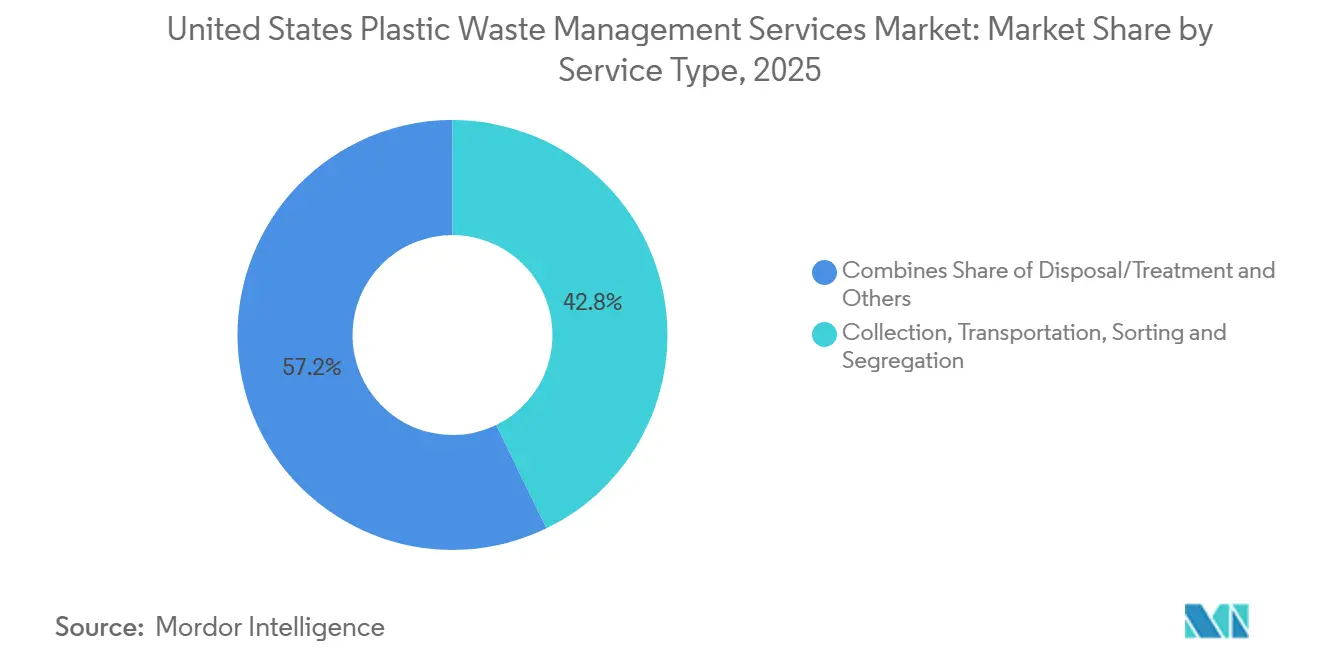
Collection, transportation, sorting, and segregation accounted for 42.8% of revenue in 2025, making upstream handling the largest service block in the United States plastic waste management services market. That result is logical because material quality, contamination rates, and downstream recovery value are all decided early in the chain. When source separation is weak, recycling economics worsen quickly because more labor, more rejects, and lower quality output all reduce value recovery. Growing investments in automated material recovery facilities (MRFs) equipped with optical sorting and AI-enabled quality control are also improving collection efficiency and reducing contamination levels, enhancing the value of recovered plastics.
Disposal and treatment are forecast to post the fastest 5.3% CAGR in the United States plastic waste management services market through 2031, supported by investment in advanced recycling, non-landfill treatment options, and higher demand for compliant handling of difficult streams. Brand owner responses to California SB 54 and Oregon's modernization framework are also raising the value of recycling and resource recovery as preferred pathways over simple disposal. Republic Services' Indianapolis Polymer Center shows how operators are pushing further into vertical integration by turning collected bales into higher-value resin output rather than stopping at bale sales. The consulting, audit, and training category remains smaller, but it is growing as companies and municipalities need more help with state-by-state compliance, operating standards, and reporting.
Geography Analysis
The United States plastic waste management services market shows its strongest regulatory pull in the Pacific Coast and northern New England, where packaging laws, higher service expectations, and earlier infrastructure buildouts are driving activity above the national average. California, Washington, and Oregon now form the most developed state policy stack for plastics management, and that is already shaping supplier behavior, municipal contracting, and private capital placement. Maine added more pressure in January 2026 with a 25% post-consumer recycled content requirement for plastic beverage containers, making the state one of the strictest current markets for packaging content rules. Lane County's planned USD 150 million sortation facility reflects the scale of infrastructure that these policy settings can trigger when public and producer funding conditions align.
The Northeast corridor also remains central to the United States plastic waste management services market because landfill tipping fees are among the highest in the continental United States, which keeps diversion economics comparatively strong. States such as Massachusetts, New York, New Jersey, and Connecticut benefit from that pricing pressure because it makes landfill avoidance more valuable, even during softer cycles for recycled resins. New Jersey's active recycled content law added another demand layer in January 2024, pushing brand owners and recyclers to pay closer attention to local sorting and recovery capacity. The region also faces some of the country's most challenging contamination and standardization issues because dense urban streams often require higher-grade optical sorting to meet reclaimer expectations. NIST noted in its 2024 workshop report that differences between material recovery facility output standards and reclaimer acceptance criteria still create a real friction point for domestic and cross-border plastics trade.
The Midwest and Southeast are becoming the fastest-growing investment zones in the United States plastic waste management services market, as industrial growth, population inflows, and rising commercial volumes are opening new routes and processing opportunities. The Midwest benefits from large post-industrial streams tied to automotive, food processing, and manufacturing corridors, which are better suited to efficient recovery than mixed household waste. The Southeast is drawing more private expansion as Texas, Florida, North Carolina, and Georgia add population and commercial density, even before many of those states adopt tighter policy frameworks. Rural parts of the Mountain West and Plains remain the hardest areas because long transport distances, low-density waste, and limited local sorting capacity continue to erode recovery economics. However, WM's new Denver East facility gives the Mountain West a more meaningful processing anchor than it had before.
Competitive Landscape
The United States plastic waste management services market is moderately concentrated. That second layer includes firms such as Casella Waste Systems, Rumpke, LRS, Balcones Resources, Recology, and PreZero United States, which are often strong within defined local or regional territories. The United States plastic waste management services market is now competing less on simple hauling reach and more on sorting quality, automated throughput, and the ability to turn recovered plastics into higher-value outputs. Operators that can pair route density with AI sorting, better contamination control, and downstream resin production are gaining a clearer edge in contract bids and margin protection. That is why the United States plastic waste management services market is showing a widening gap between automated national firms and smaller operators that still rely more on manual sorting or bale sales.
WM offers one of the clearest examples of that shift because it continued its recycling buildout, completed most of its planned projects by mid 2025, and opened the Denver East facility in July 2026 with advanced optical sorting and major annual capacity. Republic Services made a different but related move by opening the Indianapolis Polymer Center and expanding beyond bale marketing into recycled-resin manufacturing through its Blue Polymers platform. Waste Connections illustrated the pricing side of its strategy when it said the industry had shifted more firmly toward fee-for-service models that better recover processing costs and reduce direct dependence on commodity swings. Together, those actions show that the leading firms in the United States plastic waste management services market are using infrastructure, pricing structures, and vertical integration simultaneously.
International firms and newer specialists are also shaping the field, though usually in narrower lanes than the largest integrated haulers. Veolia North America, FCC Environmental Services, and Remondis Americas bring broader industrial and hazardous-waste operating experience that can support more bundled customer offerings for large accounts. At the same time, Nexus Circular, TerraCycle, and Circular Services are pursuing harder-to-recycle streams, specialized processing models, or dedicated material recovery operations where the biggest networks have not yet built deep reach. The result is that the United States plastic waste management services market still has room for growth in rural recovery, agricultural plastics, flexible film handling, and EPR administration, even as scale advantages at the top continue to strengthen.
United States Plastic Waste Management Services Industry Leaders
Waste Management Inc.
Republic Services
Waste Connections
Veolia North America
GFL Environmental
- *Disclaimer: Major Players sorted in no particular order

Recent Industry Developments
- May 2026: California’s SB 54 regulations took effect on May 1, 2026, requiring producers to achieve a 65% recycling rate for single-use plastic packaging and food service ware by 2032, ensure 100% recyclability or compostability, and deliver a 25% absolute reduction in plastic volume.
- April 2026: Henkel lifted its 2030 post-consumer recycled-content ambition to 35% and introduced 50% PCR in North American liquid laundry bottles.
- February 2026: ExxonMobil brought its third Baytown unit online, lifting total United States advanced recycling capacity to 250 million pounds annually and advancing toward a 450 million pound target by year-end 2026.
- April 2025: WM allocated USD 1.4 billion to deploy 39 new or upgraded MRFs by end-2027, adding 2.8 million tons of sortation capacity equipped with AI and optical separators.


United States Plastic Waste Management Services Market Report Scope
The United States Plastic Waste Management Services Market Report is Segmented by Source (Residential, Commercial, Industrial, and Others), by Service Provider (Public/Municipal, Private Waste Management Companies, and Others), by Service Type (Collection, Transportation, Sorting & Segregation, Disposal / Treatment, and Others). The Market Forecasts are Provided in Terms of Value (USD).
| Residential |
| Commercial (Retail, Office, etc.) |
| Industrial |
| Others (institutional, Agricultural, etc) |
| Public/Municipal |
| Private Waste Management Companies |
| Others - Producer Responsibility Organizations (PROs), etc. |
| Collection, Transportation, Sorting & Segregation | |
| Disposal / Treatment | Landfill |
| Recycling & Resource Recovery | |
| Incineration & Waste-to-Energy | |
| Others (Chemical Treatment, etc.) | |
| Others (Consulting, Audit & Training, etc.) |
| By Source | Residential | |
| Commercial (Retail, Office, etc.) | ||
| Industrial | ||
| Others (institutional, Agricultural, etc) | ||
| By Service Provider | Public/Municipal | |
| Private Waste Management Companies | ||
| Others - Producer Responsibility Organizations (PROs), etc. | ||
| By Service Type | Collection, Transportation, Sorting & Segregation | |
| Disposal / Treatment | Landfill | |
| Recycling & Resource Recovery | ||
| Incineration & Waste-to-Energy | ||
| Others (Chemical Treatment, etc.) | ||
| Others (Consulting, Audit & Training, etc.) | ||


Key Questions Answered in the Report
What is the current size and growth outlook for the United States plastic waste management and recycling market?
The United States plastic waste management and recycling market size was USD 6.55 billion in 2025 and is estimated at USD 6.8 billion in 2026, with a forecast to reach USD 8.23 billion by 2031 at a 3.89% CAGR.
Which end-use applications drive the most recycled plastics demand in the United States?
Packaging leads with 46.30% of demand in 2025, supported by brand programs and state recycled-content rules that lift off-take for food-grade rPET and natural HDPE.
How are state EPR laws changing system economics and operations?
Seven states now require producers to fund collection and processing, standardize accepted materials, and finance market development, thereby improving municipal cost recovery and creating steady demand signals for PCR.
What role will advanced recycling play alongside mechanical recycling?
Mechanical retains the largest share due to scale. At the same time, chemical recycling is set to grow faster as more states treat pyrolysis and solvolysis as manufacturing and as projects near petrochemical hubs reach commercial operation.
Which geographies are most important for feedstock growth and processing capacity?
California and other EPR states, deposit-return states for PET, and the Texas Gulf Coast are central to 2026 feedstock and processing dynamics.
What technologies and investments are improving material quality from curbside streams?
AI-enabled MRFs, optical sorters, and integrated polymer centers with washing and advanced fractionation are lifting bale purity and expanding bottle- and food-grade outputs in 2026.
Page last updated on:





