United States OTT Market Size and Share
Market Overview
| Study Period | 2020 - 2031 |
|---|---|
| Forecast Data Period | 2026 - 2031 |
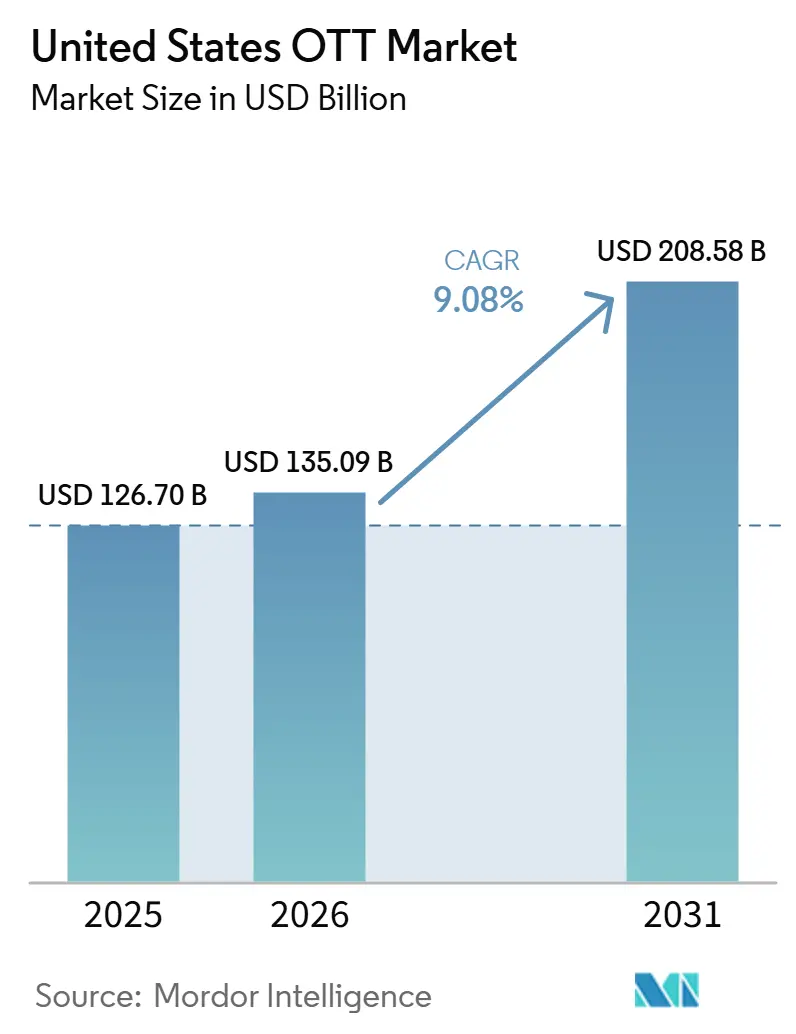
| Base Year Market Size (2025) | USD 126.70 Billion |
| Market Size (2026) | USD 135.09 Billion |
| Market Size (2031) | USD 208.58 Billion |
| Growth Rate (2026 - 2031) | 9.08% CAGR |
| Market Concentration | High |
Major Players *Disclaimer: Major Players sorted in no particular order Image © Mordor Intelligence. Reuse requires attribution under CC BY 4.0. | |
United States OTT Market Analysis by Mordor Intelligence
The United States OTT market size reached USD 135.09 billion in 2026 and is projected to climb to USD 208.58 billion by 2031, advancing at an 9.08% CAGR. Accelerating cord-cutting, ubiquitous fiber and 5G rollouts, and the rapid mainstreaming of ad-supported tiers that now rival pure subscriptions are reshaping video consumption. Smart-television penetration tops 88% in US households, shifting viewing back to the living room, where advertisers prize co-viewing and larger screens. Exclusive sports rights are fragmenting across digital platforms, drawing younger fans away from legacy pay-TV bundles. Meanwhile, consolidation led by Netflix’s USD 72 billion bid for Warner Bros. Discovery signals that scale in both production and distribution is now a defensive requirement against surging content costs. Regulatory scrutiny of that megadeal, sustainability concerns over data-center emissions, and subscriber frustration with search times longer than 12 minutes are the headline risks tempering otherwise strong growth.
Key Report Takeaways
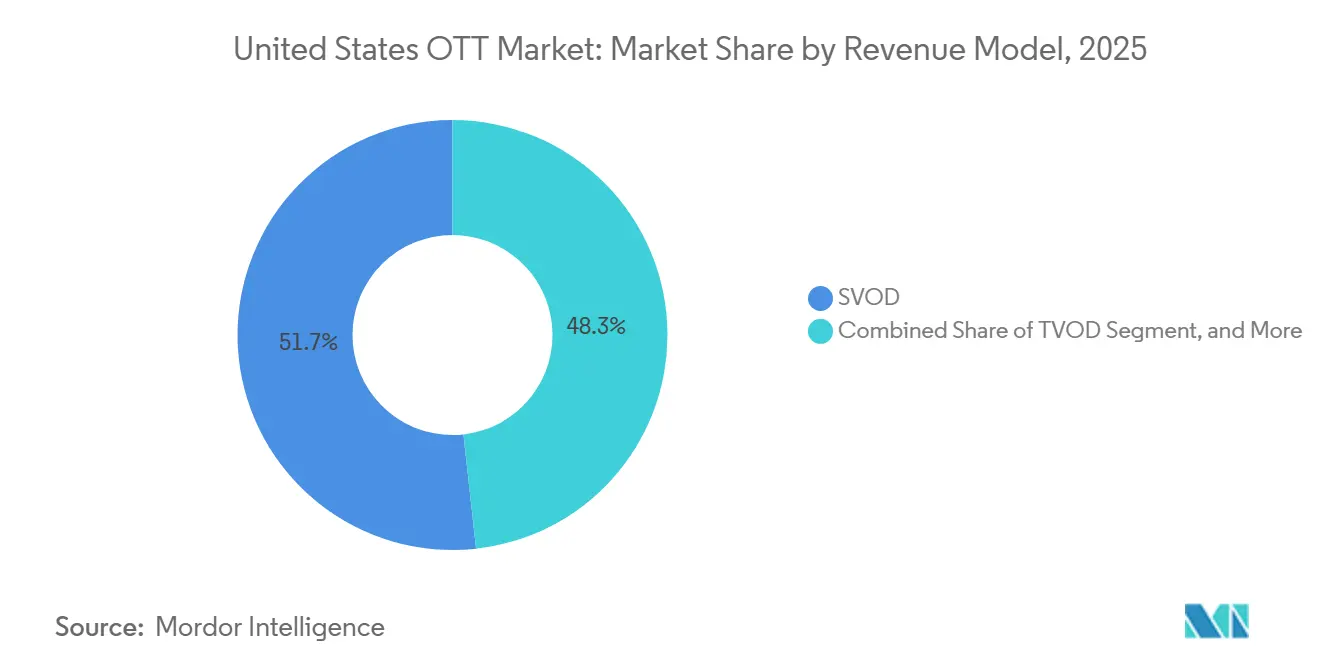
- By revenue model, SVOD held 51.75% of the United States OTT market share in 2025, while AVOD is projected to expand at a 9.71% CAGR through 2031.
- By device type, smartphones and tablets accounted for 53.62% of device-type revenue in the United States over-the-top (OTT) market in 2025, while smart TVs are projected to expand at a 9.86% CAGR through 2031.
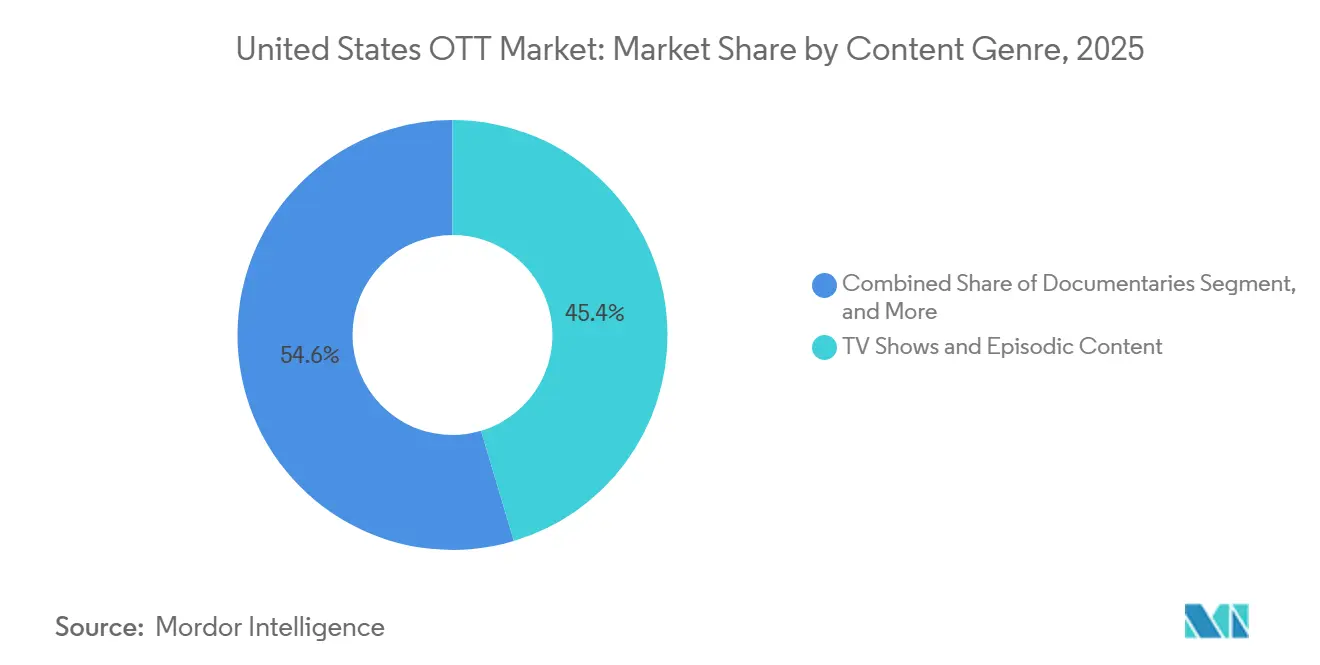
- By content genre, TV shows and episodic content accounted for 45.39% of revenue in 2025, while documentaries are projected to expand at a 9.75% CAGR through 2031.
Note: Market size and forecast figures in this report are generated using Mordor Intelligence’s proprietary estimation framework, updated with the latest available data and insights as of January 2026.
United States OTT Market Trends and Insights
Drivers Impact Analysis*
| Driver | (~) % Impact on CAGR Forecast | Geographic Relevance | Impact Timeline |
|---|---|---|---|
| Rising Cord-Cutting and Direct-to-Consumer Adoption | +2.4% | National, with highest intensity in West Coast and Northeast metro corridors | Short term (≤ 2 years) |
| Fiber and 5G Expansion for Higher-Quality Streaming | +1.9% | National, with early gains in Sun Belt metro areas and rural fixed wireless access markets | Medium term (2-4 years) |
| Ad-Supported and Hybrid Models Expanding Audience Reach | +1.7% | National | Short term (≤ 2 years) |
| Niche SVOD Services for Multicultural and Faith-Based Audiences | +1.1% | National, concentrated in Sun Belt states with high Hispanic and faith community populations | Medium term (2-4 years) |
| State Tax Incentives for Original Content Production | +0.7% | State-level, with early gains in California, New Jersey, Hawaii, and Pennsylvania | Medium term (2-4 years) |
| AI-Powered Personalization Improving Watch Time and Retention | +0.6% | National | Long term (≥ 4 years) |
| Source: Mordor Intelligence | |||
Rising Cord-Cutting Rates Among US Households Accelerate Direct-to-Consumer Adoption
Cord-cutting became a defining force for the United States OTT market in 2025, when non-pay-TV households outnumbered pay-TV households. The Video Advertising Bureau reported that 77.2 million US households had cut the cord in 2025, and it expects the total to reach 80.7 million by the end of 2026.[1]Video Advertising Bureau, “2026 Streaming Report,” Video Advertising Bureau, thevab.com Streaming accounted for 47.5% of total US television viewing in December 2025, compared with 20.2% for cable and 21.4% for broadcast. Each household that leaves traditional pay television becomes a direct customer of one or more OTT services. The change gives platforms more control over billing, plan selection, and advertising exposure. It also makes retention more important, as consumers can switch providers with little effort.
Rapid Expansion of Fiber and 5G Networks Enables Higher-Quality Streaming
Broadband quality supports the United States OTT market by improving the reliability of high-resolution video delivery. Faster fixed and wireless connections reduce buffering and can improve completion rates for 4K programming. Better viewing experiences can reduce cancellations caused by poor service quality and increase advertising inventory on connected television services. Fiber and fixed wireless access can extend premium streaming to exurban and rural areas where legacy cable networks may not support consistent high-bandwidth viewing. The Federal Communications Commission has continued to direct broadband support toward rural coverage and infrastructure expansion. These investments can enlarge the addressable household base over the forecast period if platforms offer services and content that meet the needs of newly connected households.
Shift Toward Ad-Supported and Hybrid Models Expands Audience Reach
Ad-supported viewing is becoming a core part of the United States OTT market rather than a secondary option for lower-priced plans. The Video Advertising Bureau projects 209.4 million AVOD viewers in the United States in 2026, equal to 62% of the population. Hybrid models allow a single service to serve subscribers who prefer an ad-free option and viewers who prefer a lower monthly price. Streaming upfront commitments increased to USD 13.2 billion for the 2025-2026 cycle, while broadcasters faced lower commitments. Netflix launched its in-house advertising technology platform in January 2026, giving the company more direct control over audience targeting and campaign delivery. Advertising expansion creates a growth path but may widen the operational advantage of leading platforms, which have stronger measurement, inventory management, and sales capabilities.
Niche SVOD Services Targeting Multicultural and Faith-Based Audiences Unlock New Subscriber Pools
Niche services give the United States OTT market a way to reach audiences whose interests may not be reflected in broad entertainment catalogs. Faith-based and multicultural programming can build a clearer connection with viewers than a general-purpose service. Focused services can use defined catalogs and familiar titles to enter a specific audience segment. They can also use lower-cost programming formats to manage content spending. Larger platform marketplaces make specialized subscriptions easier to find and purchase. Texas and Florida offer a large, meaningful audience for Spanish-language and culturally specific programming due to their large Hispanic populations.
Restraints Impact Analysis*
| Restraint | (~) % Impact on CAGR Forecast | Geographic Relevance | Impact Timeline |
|---|---|---|---|
| Content Licensing Costs and Competition for Premium IP | -0.9% | Global | Medium term (2-4 years) |
| Market Saturation and Churn From Low Switching Costs | -0.7% | National | Short term (≤ 2 years) with sustained impact |
| Declining Discoverability From App Overload | -0.4% | National | Medium term (2-4 years) |
| Carbon Footprint Scrutiny of Streaming Workloads | -0.2% | National, with spillover to Europe | Long term (≥ 4 years) |
| Source: Mordor Intelligence | |||
Growing Content Licensing Costs and Competition for Premium IP Squeeze Margins
Content licensing costs remain a significant restraint on the United States OTT market. Netflix and Sony Pictures Entertainment finalized a global Pay-1 licensing agreement valued above USD 7 billion in January 2026, while Disney increased its fiscal 2026 content budget by USD 1 billion to USD 24 billion, with NBA rights identified as a major driver. These commitments show the continuing importance of premium franchises, theatrical rights, and live sports to leading platforms. New AVC, or H.264, streaming fee structures can also add fixed annual expenses for large platforms. Smaller services may lack the scale needed to spread content and technology costs across a large subscriber base. Platforms are responding through pricing, advertising income, disciplined content spending, licensing partnerships, and acquisitions.
Market Saturation and Subscriber Churn Fueled by Low Switching Costs
Market saturation changes the challenge for the United States over-the-top (OTT) market from acquiring subscribers to keeping them. US households maintained an average of 5.8 streaming subscriptions in 2025, while premium SVOD subscriber growth slowed to 7%, and weighted-average monthly churn was 4.6%. These figures show that households are adjusting their service portfolios rather than adding subscriptions without limit. The draft identifies 29.5 million Americans as serial churners who canceled 3 or more services over 2 years, representing 23% of subscribers and 42% of cancellations. Release timing, bundles, advertising-supported plans, and better discovery can reduce churn but cannot remove it. Platforms must balance higher prices with perceived value because households can move to another service without a long contract or equipment change.
*Our forecasts treat driver/restraint impacts as directional, not additive. The impact forecasts reflect baseline growth, mix effects, and variable interactions.
Segment Analysis
By Revenue Model: SVOD Remains the Main Revenue Base While Advertising Tiers Expand
SVOD held 51.75% of the United States OTT market share in 2025, making it the largest revenue model. Recurring monthly subscriptions remain central to platform economics because they provide a predictable revenue base. Serialized programming and broad content libraries support reuse across major releases. Disney's USD 29.99 monthly bundle for Disney+, Hulu, and ESPN+ illustrates how combined services can increase value for households. The bundle reportedly added 11 million domestic subscribers since January 2026. TVOD serves viewers who prefer to pay for individual titles or live events rather than maintain a recurring service. Its role is more limited as subscription services move recent releases into their catalogs faster.
Hybrid subscription and advertising plans are changing the way leading platforms serve households across different budgets. The draft states that 80.4% of sub-OTT viewers are expected to have at least 1 advertising-supported subscription in 2026, compared with 71.5% in 2024. AVOD is the fastest-growing revenue model, with the United States OTT market size for AVOD projected to expand at a 9.71% CAGR through 2031. The Video Advertising Bureau projects that there will be 209.4 million AVOD viewers in the United States in 2026.[2]Video Advertising Bureau, “2026 Streaming Report,” Video Advertising Bureau, thevab.com FAST viewership is also projected to exceed 125 million viewers in 2026. Greater scale can attract advertisers, fund content acquisitions, and improve the appeal of free or low-cost services. Netflix's in-house advertising platform shows that the largest subscription services now treat advertising infrastructure as a strategic capability.


By Device Type: Mobile Devices Lead Revenue While Smart TV Viewing Gains Momentum
Smartphones and tablets accounted for 53.62% of device-type revenue in 2025. Their leading position reflects mobile and second-screen viewing habits, particularly among consumers aged 18-34. Mobile devices allow users to watch content while traveling, commuting, or using another screen at home. These sessions can be shorter than connected television sessions, which can limit advertising value per viewing hour. Laptops and desktops continue to support news, documentaries, and work-adjacent viewing. Their relative contribution is declining as more leisure viewing moves to television screens. Game consoles, set-top boxes, and media streamers remain relevant in households that have not upgraded to smart television hardware.
Smart TVs are the fastest-growing device type, with the United States OTT market size for the category projected to advance at a 9.86% CAGR through 2031. Smart TV adoption reached 82% of US television households in 2026, according to data cited in the draft. Built-in applications have become the default television interface for 30% of viewers, compared with 10% in 2020. Roku accounted for 28% of US connected television platform usage, while Samsung Tizen accounted for 23%. Larger living-room screens can support longer sessions and more valuable advertising inventory. This creates a commercial reason for platforms to optimize applications, advertising formats, and discovery tools for connected television environments.
By Content Genre: Episodic Programming Leads While Documentaries Gain Pace
TV shows and episodic content accounted for 45.39% of content genre revenue in 2025. Serialized drama, reality programs, and procedurals help services sustain recurring engagement over several weeks. Weekly releases can create a reason for subscribers to remain active between major catalog additions. This type of programming can also produce social discussion that improves audience awareness without relying only on paid promotion. Movies and films remain important to OTT catalogs, but their relative role is affected by shorter theatrical windows and stronger investment in series. The draft notes that major studios have reduced some theatrical-to-streaming windows from 90 days to 45 days, which refreshes catalogs but can reduce the sense of exclusivity.
Documentaries are the fastest-growing content genre, with the United States over-the-top (OTT) market size projected to grow at a 9.75% CAGR through 2031. The genre can offer a more favorable relationship between content spending and audience engagement than large scripted productions. True-crime, investigative, cultural, and sports documentaries can serve different age groups and viewing interests. Streaming services account for a large share of new documentary releases and can use catalog titles to sustain ongoing engagement. Netflix added more than 50 podcasts through partnerships with Spotify, iHeartMedia, and Barstool Sports as of January 2026. The expansion shows that services are broadening content formats beyond television series and films. Documentary releases can also support music, gaming, and merchandise activity when a title draws attention to a related artist or franchise.
Geography Analysis
The United States OTT market is national in scope, but regional patterns in broadband access, income, production activity, and content preferences affect how services compete. The West Coast and Northeast remain important areas for premium SVOD consumption because of their high broadband penetration and income density. California has a central role because it hosts production operations for major OTT platforms and a large share of the US production ecosystem. California's expanded tax credit program supported 170 projects in fiscal year 2025-2026 and was projected to generate USD 6.6 billion in economic activity.[3]Office of Governor of California, “First Year of California’s Expanded Film and TV Tax Credit Projected to Bring USD 6.6 Billion in Economic Impact,” Office of Governor of California, gov.ca.gov Demand in these established coastal areas is supported by strong household willingness to pay for premium, ad-free services.
Sun Belt states, especially Texas, Florida, and Georgia, offer a different opportunity for the United States over-the-top (OTT) market. These states have growing populations and substantial Hispanic communities that may respond to stronger Spanish-language and multicultural catalogs. Dallas-Fort Worth and Houston showed subscription penetration gaps relative to coastal markets in 2025, according to the draft. This gives AVOD, SVOD, and specialized channels a possible route to add households without relying on the same content mix used in established coastal markets. Texas and Florida contain the 2 largest concentrations of Hispanic households in the country. Services that tailor programming and pricing to these audiences can improve relevance while managing content costs. New Jersey also became a more significant production location in 2026 as its incentive structure attracted production investment away from higher-cost locations.
The Midwest and the Mountain West have different viewing and distribution profiles. Hulu leads in 20 states, primarily in the Midwest and South, reflecting the continued relevance of live television and sports programming. Montana and Maine recorded high binge-viewing engagement in a March 2026 study described in the draft. Montana adults averaged 3.52 hours of daily viewing across all demographic groups. Higher engagement can make smaller markets more attractive for advertising-supported services, even when the total population is lower. Rural broadband funding and wider fiber deployment can improve access to premium streaming in exurban counties. These infrastructure improvements can expand the addressable audience by enabling consistent high-quality viewing in places where bandwidth had previously constrained adoption.
Competitive Landscape
The United States OTT market is concentrated among a small number of leading platforms, but competition remains active among smaller services. Netflix, Amazon Prime Video, Disney+, and Apple TV+ accounted for 65% of US streaming engagement in Q2 2026, based on more than 45 million streaming interactions in the draft. Netflix held 20% of engagement, the highest among individual platforms. Netflix also reported USD 12.25 billion in revenue in Q1 2026 and more than 325 million global subscribers. Its broad catalog, global scale, and advertising investment give it a strong position in the United States OTT market. Apple TV+ recorded the fastest annual engagement growth among major platforms in the year to Q2 2026, adding 5 percentage points and overtaking Hulu for fourth place.
Several strategic moves show how companies are responding to changing market conditions. Netflix and AMC Global Media announced a multiyear co-exclusive agreement for all 7 series in The Walking Dead Universe, giving Netflix expanded international rights beginning in 2027.[4] Video Advertising Bureau, “2026 Streaming Report,” Video Advertising Bureau, thevab.com Netflix also launched its own advertising technology platform in January 2026, reducing its reliance on an external technology partner. Paramount Skydance and Warner Bros. Discovery signed a definitive merger agreement valued at USD 110 billion in February 2026. Warner Bros. Discovery stockholders approved the transaction in April 2026, while the US Department of Justice closed its investigation without requiring divestitures or behavioral remedies. These actions reflect the value placed on large catalogs, advertising capacity, and greater scale.
Bundling is another major response to household subscription limits. Comcast expanded its StreamSaver bundle in April 2026 to include Disney+, Hulu, HBO Max, Peacock, Netflix, and Apple TV+. The approach recreates some of the benefits of a television package while keeping streaming services as separate brands. Platforms are also using proprietary intellectual property and recommendation systems to improve retention. Live sports, multicultural programming, and technology services for broadcasters remain areas where participants can differentiate their offers.
United States OTT Industry Leaders
Netflix Inc.
The Walt Disney Company
Amazon.com, Inc
Warner Bros. Discovery, Inc
Hulu, LLC (The Walt Disney Company)
- *Disclaimer: Major Players sorted in no particular order


Recent Industry Developments
- July 2026: Netflix and AMC Global Media announced a multi-year global co-exclusive streaming licensing agreement covering all 7 series in The Walking Dead Universe, totaling 371 episodes. Netflix will expand international rights to Fear the Walking Dead, Daryl Dixon, Dead City, and 4 additional spin-offs beginning in 2027, extending one of cable television's most valuable franchises across new territories and reinforcing Netflix's strategy of deepening library value through catalog licensing rather than pure originals.
- July 2026: California's Film and Television Tax Credit Program 4.0 completed its inaugural fiscal year, July 2025-June 2026, awarding 170 projects expected to generate USD 6.6 billion in direct production spending and 34,921 cast and crew jobs across California, per the California Film Commission.
- April 2026: Warner Bros. Discovery stockholders approved the Paramount-Skydance merger. The US Department of Justice Antitrust Division cleared the USD 110 billion transaction without requiring divestitures or behavioral remedies, per the DOJ's official statement, with the European Commission investigation pending at the time of stockholder approval.
- February 2026: Paramount Skydance Corporation and Warner Bros. Discovery signed a definitive merger agreement valued at USD 110 billion, equity value USD 81 billion. The transaction includes the Warner Bros. film and television studios, HBO Max, and CNN.


Research Methodology Framework and Report Scope
Market Definitions and Key Coverage
Our study defines the United States over-the-top (OTT) market as all paid or ad-funded video and audio streaming services accessed through fixed or mobile broadband, encompassing subscription, transactional, and advertising revenue streams across connected TVs, smartphones, tablets, and personal computers.
Scope exclusion: Hardware sales such as streaming sticks, smart TVs, or set-top boxes are excluded.
Segmentation Overview
- By Revenue Model
- SVOD
- TVOD
- AVOD
- Hybrid Subscription and Ads
- By Device Type
- Smartphones and Tablets
- Smart TVs
- Laptops and Desktops
- Game Consoles
- Set-Top Boxes and Media Streamers
- By Content Genre
- Movies and Films
- TV Shows and Episodic Content
- Documentaries
- Other Content Genres
Detailed Research Methodology and Data Validation
Primary Research
Mordor analysts interview platform executives, content licensors, ad-tech vendors, and consumer-electronics retailers across all U.S. regions. These conversations validate average selling prices, churn triggers, ad-load norms, and planned content-spend trajectories, filling gaps that public datasets leave open.
Desk Research
We start with public pillars: FCC broadband statistics, U.S. Census demographics, and Bureau of Economic Analysis consumer-spend tables, before layering usage metrics from entities such as Nielsen, Comscore, and the Interactive Advertising Bureau. Company 10-Ks, investor decks, and trade-association white papers deepen service-level insights, while paid access to Dow Jones Factiva and D&B Hoovers lets our team pull historic revenue splits and M&A activity. Patent abstracts from Questel help gauge tech investment in codecs and ad-insertion. This foundation supplies the channel footprints, adoption curves, and pricing bands that our analysts need. The sources cited here are illustrative; many additional references inform data checks and clarification.
Market-Sizing & Forecasting
A top-down demand pool is built from broadband household counts, average paid-OTT spend, and streaming ad CPM flows, which are then corroborated with bottom-up roll-ups of sampled subscriber volumes multiplied by prevailing ARPU. Key variables include penetration of connected TVs, ad-supported tier take-up, cord-cutting velocity, live-sports rights inflation, and average monthly churn. Multivariate regression models, stress-tested through three scenario blocks, project revenue to 2030. Outliers are re-benchmarked against primary feedback.
Data Validation & Update Cycle
Outputs undergo variance checks versus external benchmarks, followed by a two-step peer review. We refresh every twelve months and re-issue sooner if material events, like blockbuster consolidation or regulatory shifts, alter market math.
Why Mordor's US OTT Baseline Earns Unmatched Trust
Published estimates often diverge because each firm applies its own service mix, price uplift path, and refresh rhythm. Our disciplined scope, annual recrawl, and dual-approach modeling narrow that gap for decision-makers.
Key gap drivers include: some publishers counting only subscription video, others omitting ad-supported revenue, and several converting currencies at static rates that ignore dollar volatility; still others lock forecasts two years out, whereas we rerun models after major price hikes or sport-rights deals.
Benchmark comparison
| Market Size | Anonymized source | Primary gap driver |
|---|---|---|
| USD 122.44 bn (2024) | Mordor Intelligence | - |
| USD 61.9 bn (2024) | Global Consultancy A | Excludes AVOD and music streaming |
| USD 90.28 bn (2024) | Industry Data Firm B | Counts only consumer spend, omits advertising |
Taken together, the comparison shows that when scope breadth, fresh inputs, and currency realism converge, as we ensure at Mordor, the resulting baseline stays balanced, transparent, and repeatable for a wide range of strategic uses.


Key Questions Answered in the Report
What is the size of the United States OTT market?
The United States OTT sector is estimated at USD 135.09 billion in 2026 and is projected to reach USD 208.58 billion by 2031, at a 9.08% CAGR.
What is driving OTT adoption in the United States?
Cord-cutting, broader advertising-supported viewing, improved broadband access, and demand for more specialized content are supporting adoption.
Which revenue model leads US OTT services?
SVOD led with a 51.75% revenue share in 2025, while AVOD is projected to record the highest growth at a 9.71% CAGR through 2031.
Which devices are most important for streaming services?
Smartphones and tablets held 53.62% of device-type revenue in 2025, while smart TVs are projected to grow at a 9.86% CAGR through 2031.
Which content genre leads US streaming platforms?
TV shows and episodic content held 45.39% of content genre revenue in 2025, while documentaries are projected to expand at a 9.75% CAGR through 2031.
What are the main challenges for OTT platforms?
Rising content costs, subscriber churn, discovery challenges, and environmental scrutiny can limit profitability and engagement.
Page last updated on:


