
United States Middle Mile Delivery Market Size and Share
Market Overview
| Study Period | 2020 - 2031 |
|---|---|
| Forecast Data Period | 2026 - 2031 |
| Base Year Market Size (2025) | USD 33.52 Billion |
| Market Size (2026) | USD 34.95 Billion |
| Market Size (2031) | USD 42.71 Billion |
| Growth Rate (2026 - 2031) | 4.09 % |
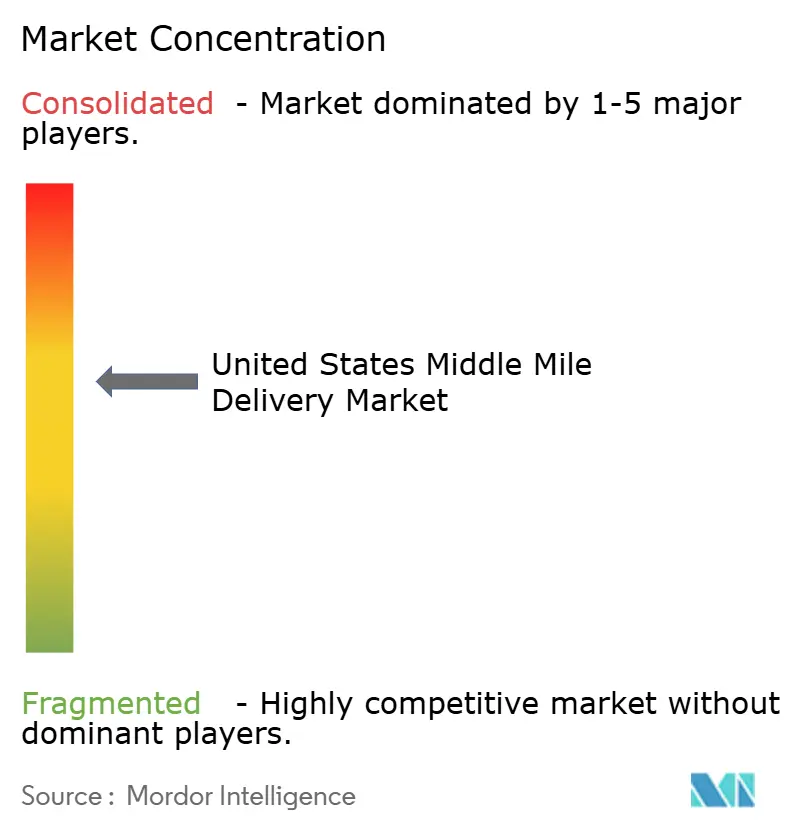
| Market Concentration | Medium |
Major Players *Disclaimer: Major Players sorted in no particular order Image © Mordor Intelligence. Reuse requires attribution under CC BY 4.0. | |
United States Middle Mile Delivery Market Analysis by Mordor Intelligence
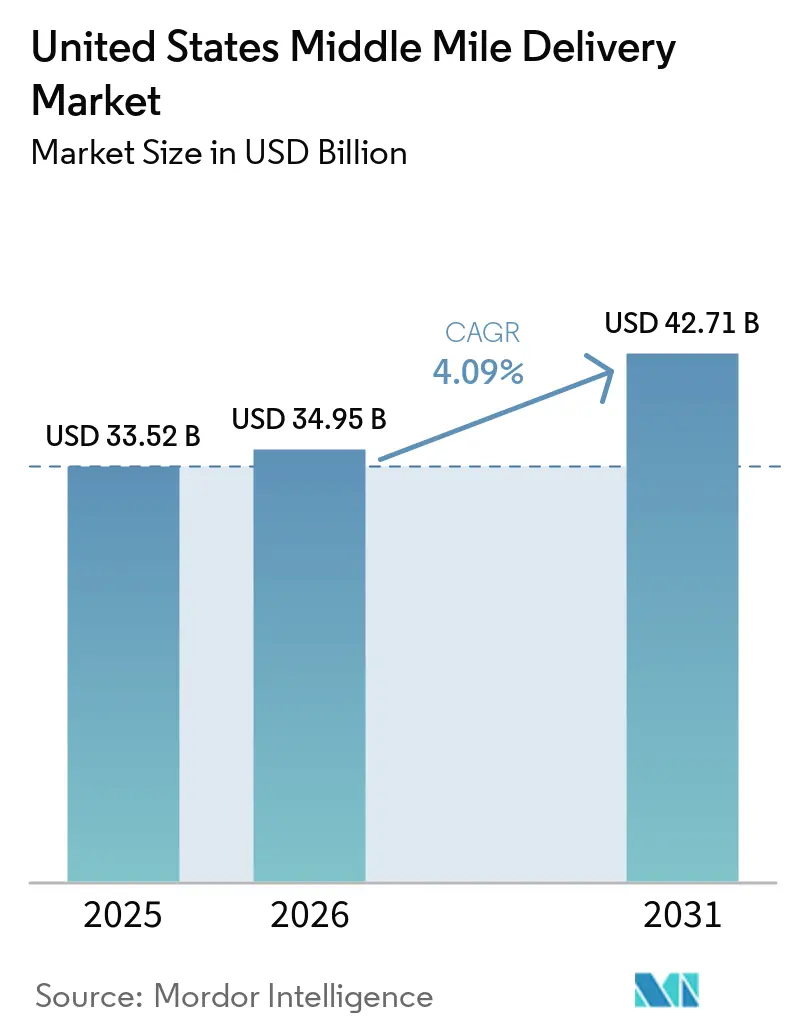
The United States middle mile delivery market size is projected to be USD 33.52 billion in 2025, USD 34.95 billion in 2026, and reach USD 42.71 billion by 2031, growing at a CAGR of 4.09% from 2026 to 2031.
The steady rise in online order volumes continues to put pressure on the inter-hub freight layer that links fulfillment centers with last-mile dispatch points. Shipment patterns are also moving toward shorter regional flows, which supports denser lane design, more frequent shuttle schedules, and a broader role for proximity-based middle-mile operations in 2026. Federal freight corridor spending under the IIJA, including USD 1.5 billion for the National Highway Freight Program in FY2026, is improving utilization on several high-volume routes and reducing operating friction for carriers with existing corridor density. The United States middle-mile delivery market is also being reshaped by data-led routing, new autonomous pilots on repeat corridors, and rising cold-chain requirements from healthcare and fresh-food shippers, widening the gap between standard freight operators and providers with tighter service control.
Key Report Takeaways
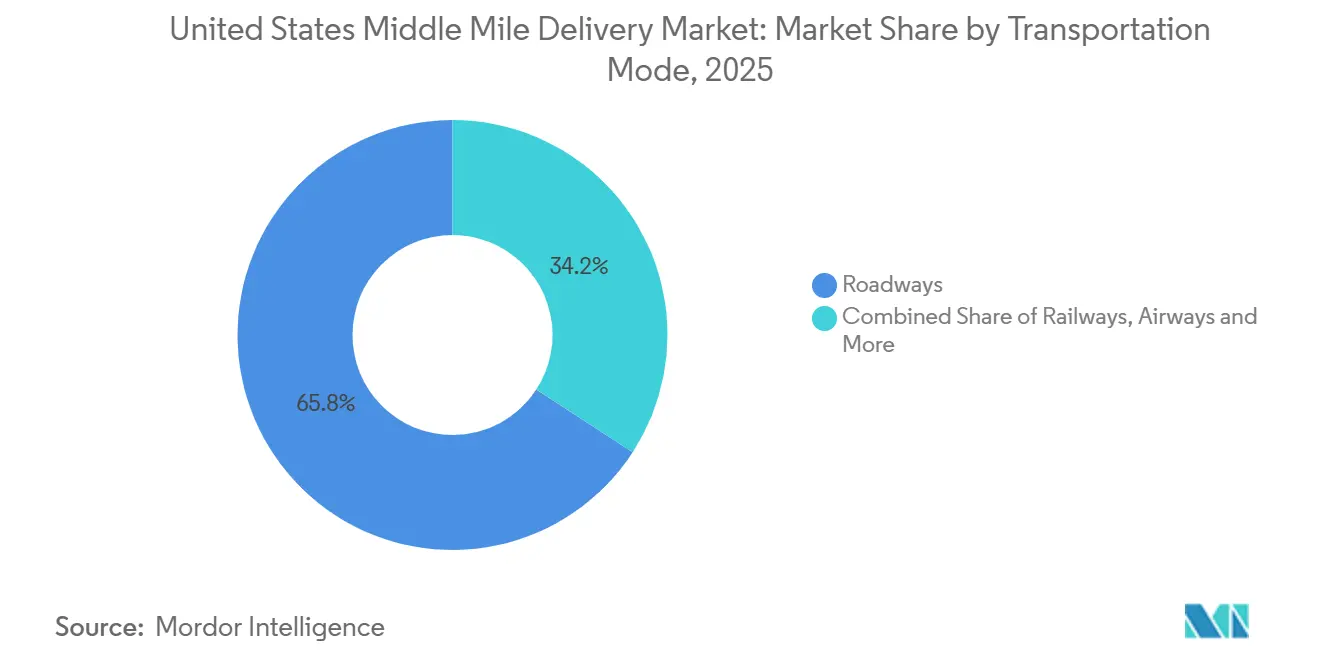
- By transportation mode, roadways led with 65.81% of the United States middle mile delivery market share in 2025, while airways recorded the fastest projected CAGR at 6.91% through 2031.
- By business model, B2C accounted for 71.5% of the United States middle mile delivery market, while C2C is forecast to expand at a 6.08% CAGR through 2031.
- By temperature control, non-temperature-controlled freight accounted for 86.07% of the United States middle mile delivery market share in 2025, while temperature-controlled lanes are advancing at a 7.79% CAGR through 2031.
- By destination, domestic freight captured 89.14% of the United States middle mile delivery market size in 2025, while international lanes are projected to grow at a 9.75% CAGR through 2031.
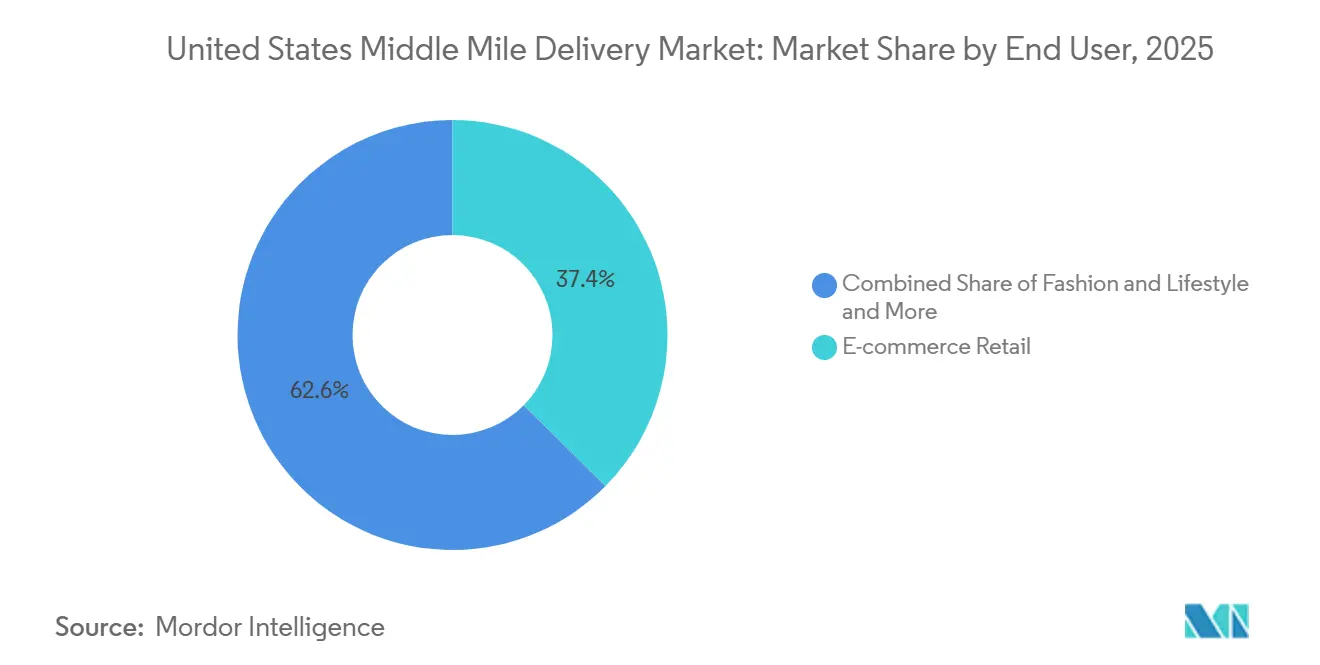
- By end user, e-commerce retail held 37.39% share in 2025, while healthcare and medical supplies are expected to post the highest CAGR at 7.21% through 2031.
- By geography, the West accounted for 24.66% share in 2025, while the Southwest is projected to expand at a 5.45% CAGR through 2031.
Note: Market size and forecast figures in this report are generated using Mordor Intelligence’s proprietary estimation framework, updated with the latest available data and insights as of January 2026.
United States Middle Mile Delivery Market Trends and Insights
Drivers Impact Analysis*
| Driver | (~) % Impact on CAGR Forecast | Geographic Relevance | Impact Timeline |
|---|---|---|---|
| E-Commerce Order Densification Across Tier-2 US Metros | +1.0% | National, the strongest gains in the Midwest and Southwest secondary metros, including Columbus, Indianapolis, San Antonio, and Phoenix | Short term (≤ 2 years) |
| AI-Driven Dynamic Line-Haul Routing Platforms Scaling in LTL Networks | +0.7% | National, early adoption concentrated in the dense LTL corridors of the Northeast and Midwest. | Medium term (2-4 years) |
| Infrastructure Investment and Jobs Act Funding for Freight Corridors | +0.6% | National, highest impact on Southeast, Southwest, and Midwest freight corridors, including I-20/I-55, I-35, and I-80 | Medium term (2-4 years) |
| Decentralized Micro-Fulfillment Hubs Shortening Regional Replenishment Loops | +0.5% | National, early deployment in West Coast metros and Northeast urban clusters | Medium term (2-4 years) |
| OEM-Led Roll-Out of Autonomous Middle-Mile Truck Pilots on I-10 & I-35 | +0.4% | Southwest and Southeast corridors, including Texas and Arizona, with spillover to the Midwest | Long term (≥ 4 years) |
| Railroads Launching Premium Expedited Intermodal Services (≤600-Mile Lanes) | +0.3% | National, with emphasis on the Midwest-Southeast and the West-Midwest corridors | Short term (≤ 2 years) |
| Source: Mordor Intelligence | |||
E-Commerce Order Densification Across Tier-2 US Metros
United States e-commerce sales reached USD 1,233.7 billion in 2025, accounting for 16.4% of total retail sales, confirming that online demand is still expanding from a very large base. Rising online volumes in tier-2 metros are pushing cities such as Columbus, Indianapolis, and San Antonio toward the order density needed to support dedicated shuttle lanes between hub nodes. Once that threshold is crossed, freight no longer needs to wait for longer-haul consolidation, improving trailer turns and supporting more predictable middle-mile schedules. That change opens new revenue streams for carriers, allowing them to flex between LTL and full-shuttle loads without overbuilding fixed capacity. The United States middle-mile delivery market benefits because these lanes sit between large fulfillment assets and local delivery networks, where recurring frequency matters more than maximum line-haul distance[1].
AI-Driven Dynamic Line-Haul Routing Platforms Scaling in LTL Networks
AI-led line-haul planning is moving from testing into daily network operations across the United States middle-mile delivery market. In January 2026, C.H. Robinson said its AI agents automated 95% of LTL missed-pickup checks, saved more than 350 manual hours each day, reduced unnecessary return trips by 42%, and helped some freight move up to 1 day faster[2]. These tools help carriers fill trailers more effectively, cut empty miles, and tighten pickup discipline across dense corridors. They also change the competitive landscape, as smaller operators without strong data assets or software depth face weaker margins on lanes where dynamic routing is becoming standard. As this capability spreads, value is shifting away from pure physical scale and toward the quality of lane data, shipment history, and execution feedback that carriers can apply in real time.
Infrastructure Investment and Jobs Act Funding for Freight Corridors
Federal freight spending continues to support the United States middle-mile delivery market by improving highway segments that carry heavy inter-hub traffic. The FHWA FY2026 budget included USD 1.5 billion for the National Highway Freight Program and USD 770 million for nationally significant freight and highway projects. The same federal fact sheets highlighted corridor projects, including USD 86.6 million for the I-20/I-55 corridor in Mississippi, USD 80 million for the smart-connected AllianceTexas corridor, and USD 97.8 million for the reconstruction of the I-35 interchange in Olathe, Kansas. When these choke points improve, carriers can produce more loaded miles per tractor and make tighter appointment windows without adding the same amount of labor or equipment. This matters more over time because FHWA expects truck freight tonnage to keep growing through 2050, which makes current corridor upgrades directly relevant to medium-term network design.
OEM-Led Roll-Out of Autonomous Middle-Mile Truck Pilots on I-10 & I-35
OEM-led autonomous pilots are beginning to define a longer-term efficiency path for the United States middle-mile delivery market. On March 31, 2026, International Motors launched a live-freight Level 4 pilot with Ryder on a daily 600-mile route between Laredo and Temple, Texas, along I-35 using a factory-integrated autonomous tractor. The company said early results showed 100% on-time delivery, 92% autonomous route coverage with a safety driver, and average pre-trip inspections of less than 30 minutes. The pilot is important because it supports a hub-to-hub operating model that can fit into existing terminals, rather than waiting for a new network of purpose-built autonomous sites. The corridor focus around Texas also reflects where freight density, nearshoring flows, and repeatable operating conditions are already strong enough to support commercial testing at a daily frequency.
Restraints Impact Analysis*
| Restraint | (~) % Impact on CAGR Forecast | Geographic Relevance | Impact Timeline |
|---|---|---|---|
| Acute Class-A Driver Shortages Escalating Recruitment Costs | -0.5% | National, most acute on long-haul and overnight middle-mile lanes in the Midwest and Southeast | Short term (≤ 2 years) |
| Chronic Truck-Parking Deficit at Interstate Rest Areas | -0.3% | National, worst in Louisiana, Oklahoma, Arkansas, Texas, and Colorado | Short term (≤ 2 years) |
| Port and Rail Yard Dwell-Time Volatility Post-2021 Congestion | -0.3% | West Coast, Gulf Coast, and Chicago inland hub, with selective impact at Jacksonville and Cincinnati | Medium term (2-4 years) |
| Capital Intensity of Temperature-Controlled Cross-Dock Networks | -0.2% | National, with the highest barriers in dense Northeast and West Coast metro corridors | Long term (≥ 4 years) |
| Source: Mordor Intelligence | |||
Acute Class-A Driver Shortages Escalating Recruitment Costs
Driver availability remains a near-term restraint for the United States middle-mile delivery market, especially on overnight and longer regional lanes that still rely on hard-to-fill Class-A roles. Rising recruitment expense and persistent turnover make it harder for carriers to scale capacity in step with demand, even when freight volumes support new routes. Training and compliance requirements also lengthen the time required to bring new drivers into regular service, limiting how quickly operators can respond during peak periods. This pressure favors carriers that can offer shorter, more predictable middle-mile schedules, as those routes better meet retention needs than long-haul operations. The result is a labor market in which service consistency depends as much on driver access as on physical network coverage.
Chronic Truck-Parking Deficit at Interstate Rest Areas
Limited truck parking continues to slow the United States' middle-mile delivery market because drivers on fixed hours-of-service clocks cannot account for search time without affecting their transit plans. The problem is most acute on busy interstate corridors, where drivers often must secure parking well before the legal end of their driving window. That reduces daily productive miles, stretches turn times, and lowers appointment reliability across hub-to-hub movements that depend on narrow timing windows. The issue is especially challenging in fast-growing Southwest lanes, where freight density is rising faster than parking supply and public capacity remains uneven. Even where funding has been awarded for new facilities, the delivery timeline for additional parking is slower than carriers' immediate operational needs.
*Our forecasts treat driver/restraint impacts as directional, not additive. The impact forecasts reflect baseline growth, mix effects, and variable interactions.
Segment Analysis
By Transportation Mode: Roadways Anchor Operations While Faster Modes Gain Niche Momentum
Roadways held 65.81% of the United States middle-mile delivery market share in 2025, keeping them at the center of inter-hub operations because they can serve both dense and thin routes with the same base asset class. Their lead also reflects how e-commerce networks depend on flexible dispatch, frequent reloads, and direct access between fulfillment centers, cross-docks, and local sort points. Highway upgrades supported by federal funding further strengthen road mode economics on corridors where dwell, congestion, and interchange delays had reduced trailer productivity. For most operators, road freight remains the default choice when shipment timing changes quickly or when freight needs to be redirected across multiple regional nodes on the same day.
Airways are projected to grow at a 6.91% CAGR through 2026-2031, the fastest pace among transportation modes, reflecting the need for speed in pharmaceutical and high-value electronics flows. Railways remain a smaller part of the mix, but they are gaining attention on service-sensitive lanes where improved reliability can narrow the gap with truckload service. In November 2025, Schneider launched Fast Track. This premium intermodal, the company said, delivered 95% or better on-time performance and transit times up to 2 days faster than truckload alternatives on key US-Mexico routes. Maritime links still matter around port gateways and for short coastal moves, but in the United States middle-mile delivery market, they play a more limited role than road and air in day-to-day network balancing.

By Business Model: B2C Holds the Base While C2C Adds New Volume Pools
B2C accounted for 71.5% of the United States middle-mile delivery market in 2025, underscoring how online retail continues to shape freight movements between fulfillment sites and local delivery nodes. This segment benefits from a broad product base across apparel, electronics, home goods, and household replenishment, which creates recurring regional volumes throughout the year. Its scale also supports dense shuttle operations that can be reset quickly during holiday peaks or promotional periods. Because B2C demand is spread across many origin-destination pairs, it provides carriers with a broad load base that helps justify dedicated corridor planning.
C2C is forecast to grow at a 6.08% CAGR through 2026-2031, the fastest among business models, as resale platforms and peer-to-peer commerce generate more lightweight parcel clusters that still need middle-mile consolidation. These flows are smaller at the shipment level, but they become attractive once platform volumes are grouped into consistent regional movements. B2B remains an important stabilizer for the US middle-mile delivery market because manufacturer and supplier freight provides a predictable cadence that supports asset planning even when consumer volumes fluctuate. The mix of B2C scale, C2C growth, and B2B stability is pushing operators to design networks that can handle both steady contract lanes and variable platform-driven loads without raising empty mileage.
By Temperature Control: Cold Lanes Expand Faster Than the Dry Freight Base
Non-temperature-controlled freight retained 86.07% of the United States middle-mile delivery market share in 2025, indicating that dry freight remains the primary operating base for most carriers. This large base covers standard retail replenishment, general merchandise, furniture, and many industrial moves that do not require validated thermal handling. Its scale gives operators utilization advantages, especially on regional networks where mixed customer loads can be consolidated more easily than specialized freight. Even so, the dry segment does not offer the same margin opportunity as cargo, which demands tighter service verification and chain-of-custody controls.
Temperature-controlled services are projected to expand at a 7.79% CAGR through 2026-2031, making them the fastest-growing segment in the United States middle-mile delivery market. The growth is tied to biologics, specialty pharmaceuticals, fresh-food e-commerce, and tighter traceability requirements across regulated products. The Global Cold Chain Alliance said close to 45% of the top 20 United States pharmaceutical products by sales require cold storage. This is raising the value of operators that can provide validated reefer capacity, sensor-based monitoring, and disciplined handoffs between cross-docks and distribution nodes.
By Destination: Domestic Freight Leads While Cross-Border Corridors Grow Faster
Domestic flows accounted for 89.14% of the United States middle-mile delivery market in 2025, underscoring the sector's strong ties to internal replenishment networks and national retail distribution. Most middle-mile volumes still move between United States fulfillment centers, sort hubs, stores, and local delivery facilities rather than across international borders. This makes service frequency, corridor density, and terminal positioning more important than border processing for the largest share of daily freight activity. Domestic strength also means that operators with large regional networks keep a clear advantage in mainstream inter-hub freight.
International lanes are forecast to grow at a 9.75% CAGR through 2026-2031, led by cross-border United States-Mexico flows that are benefiting from nearshoring and stronger supplier clustering in northern Mexico. That growth is concentrated on a limited set of ports and inland corridors, so corridor-specific capability matters more than broad international exposure alone. In this part of the United States middle-mile delivery market, carriers with drayage links, customs coordination, and cross-border intermodal options are better positioned to capture new lane formation. The result is a market where domestic freight anchors revenue, while international growth creates a sharper competitive test on Southwest-linked routes.
By End User Industry: E-Commerce Retail Leads Revenue While Healthcare Raises Service Demands
E-commerce retail accounted for 37.39% of the United States middle-mile delivery market in 2025, making it the largest end-user group because it drives steady replenishment between major distribution points and local dispatch networks. The scale of online retail gives carriers recurring volumes across categories such as electronics, apparel, furniture, beauty, and home goods. It also keeps route structures dynamic, since shipment flows respond quickly to promotions, seasonal demand, and inventory balancing across regions. As a result, e-commerce continues to set the operating rhythm for a large share of the United States middle-mile delivery market.
Healthcare and medical supplies are projected to grow at a 7.21% CAGR through 2026-2031, the fastest pace among end users, reflecting stronger demand for validated, time-sensitive transport. The category is benefiting from biologics distribution, pharmaceutical reshoring, and a wider need for temperature-managed movement between national hubs and regional healthcare nodes. Those requirements are closer to controlled cold-chain operations than to standard dry freight handling, which is why service certification matters more in this segment. That shift is raising the bar on visibility, thermal integrity, and exception handling, going beyond the service expectations of standard retail freight.
Geography Analysis
The West held 24.66% of the United States middle-mile delivery market share in 2025, making it the largest regional segment, driven by the Los Angeles and Long Beach port complex and California's dense inland distribution grid. That scale gives the region a strong base in drayage, cross-dock throughput, and freight flows tied to major import gateways. Pacific Merchant Shipping Association data showed truck-destined cargo dwell at San Pedro Bay averaged 2.78 days in April 2025, while rail-destined cargo averaged 4.72 days after the sharper delays seen in late 2024. The region also faces earlier compliance pressure on clean-fleet decisions, pushing operators to update equipment and route plans earlier than in many other US corridors.
The Southwest is projected to grow at a 5.45% CAGR through 2026-2031, making it the fastest-growing region in the US middle-mile delivery market, as Texas-Mexico trade, new industrial buildout, and repeatable interstate freight lanes are strengthening simultaneously. The AllianceTexas inland port corridor received a USD 80 million INFRA grant in FY2026 to connect the BNSF intermodal site with surrounding distribution assets through smart signal control at 13 intersections. The same regional logic is visible on I-35, where International Motors and Ryder launched a daily autonomous freight pilot between Laredo and Temple in March 2026. These developments show why the Southwest is gaining strategic weight, since it combines domestic distribution density with cross-border lane creation and faster testing of new operating models. The Midwest remains a major hub for the US middle-mile delivery market because it connects eastern population centers, inland production hubs, and transcontinental freight corridors into a single network.
The Northeast has a high freight density due to population concentration, but terminal expansion is more difficult there because industrial land is costly and operating conditions are more constrained. In April 2026, Saia opened a 74-door terminal in York, Pennsylvania, to strengthen service across the Mid-Atlantic and Northeast metropolitan corridor[3]. The Southeast benefits from diversified port access and from corridor investments that improve inland reach between coastal gateways and regional distribution centers. Chicago remains a critical national interchange point, and the CREATE rail project received USD 81.3 million in FY2025 federal funding for additional track and bridge replacement, supporting freight fluidity through one of the country's most important inland hubs.
Competitive Landscape
The United States middle-mile delivery market is moderately concentrated, with national integrators and large brokers competing with regional LTL carriers, dedicated fleet operators, and specialized 3PLs. Larger players hold an advantage in asset depth, network reach, and technology spending. However, regional operators still defend a share in which corridor knowledge, customer density, or service specialization matter more than national scale. This structure maintains uneven pricing discipline across lanes, since large network players can bundle services while smaller operators compete on responsiveness or local fit. Competition is becoming less about raw equipment counts alone and more about which firms can combine physical capacity with routing data, visibility tools, and faster operational feedback.
C.H. Robinson illustrated this shift in January 2026 when it said AI agents were automating 95% of LTL missed-pickup verification, cutting unnecessary return trips by 42%, and helping some freight move up to 1 day faster. Saia also expanded its network in April 2026 with a new 74-door terminal in York, Pennsylvania, which shows how established LTL carriers are adding density in strategically important metro corridors[4]. In November 2025, Schneider launched its Fast Track intermodal service, signaling that rail-linked offerings are being repositioned to win freight that once defaulted to truckload on service-sensitive lanes. Another competitive pressure point is the rise of cold-chain and healthcare freight, where service certification, traceability, and exception handling can matter more than simple price. That favors companies with validated processes and stronger coordination across hubs rather than those relying only on a generic dry-freight scale.
Autonomous partnerships are opening another lane of competition in the United States middle-mile delivery market. International Motors and Ryder began a live-freight Level 4 pilot on I-35 in March 2026, pointing to a future model in which repeat hub-to-hub corridors can be redesigned around highly controlled autonomous operations. If these pilots scale, traditional truckload intermediaries may face new pressure on lanes where OEMs, carriers, and software providers can lock in higher asset utilization together. The result is a competitive field where incumbents still matter, but the advantage is shifting toward firms that can pair corridor density with automation, service reliability, and tighter shipment control.
United States Middle Mile Delivery Industry Leaders
-
United Parcel Service (UPS)
-
FedEx
-
Amazon Logistics
-
J.B. Hunt Transport Services
-
XPO
- *Disclaimer: Major Players sorted in no particular order
Recent Industry Developments
- April 2026: Saia opened a new 74-door terminal in York, Pennsylvania, strengthening its Northeast LTL network and improving transit times across Mid-Atlantic and Northeast metropolitan markets. The terminal represents part of Saia's commitment to capturing share from the capacity vacated by Yellow Corp.'s bankruptcy in 2023.
- March 2026: Ryder System and International Motors, in collaboration with PlusAI, launched a live-freight Level 4 autonomous truck pilot on a 600-mile daily route along I-35 between Laredo and Temple, Texas. Early results showed 100% on-time delivery and 92% autonomous coverage, positioning the partnership as the first commercially operational autonomous point-to-point middle-mile freight lane at this scale in the United States.
- January 2026: C.H. Robinson deployed AI agents that automated 95% of LTL missed-pickup verification, saving 350+ manual hours daily, reducing unnecessary carrier return trips by 42%, and enabling freight to move up to 1 day faster. The agents also manage LTL price quotes, freight classification, shipment tracking, and proof of delivery.
- November 2025: Schneider National launched Fast Track, a premium intermodal solution achieving 95%+ on-time performance and transit times up to 2 days faster than truckload alternatives on key US-Mexico lanes, with a 99.99% theft-free record across its US and Mexico intermodal network in 2024.
United States Middle Mile Delivery Market Report Scope
| Roadways |
| Railways |
| Airways |
| Maritime |
| Business-to-Business (B2B) |
| Business-to-Consumer (B2C) |
| Customer-to-Consumer (C2C) |
| Non-Temperature Controlled |
| Temperature Controlled |
| Domestics |
| International |
| E-commerce Retail |
| Fashion and Lifestyle |
| Beauty, Wellness and Personal Care |
| Home and Furniture |
| Consumer Electronics and Appliances |
| Healthcare and Medical Supplies |
| Others |
| Northeast |
| Southeast |
| Midwest |
| Southwest |
| West |
| By Transportation Mode | Roadways |
| Railways | |
| Airways | |
| Maritime | |
| By Business Model | Business-to-Business (B2B) |
| Business-to-Consumer (B2C) | |
| Customer-to-Consumer (C2C) | |
| By Temperature Control | Non-Temperature Controlled |
| Temperature Controlled | |
| By Destination | Domestics |
| International | |
| By End User Industry | E-commerce Retail |
| Fashion and Lifestyle | |
| Beauty, Wellness and Personal Care | |
| Home and Furniture | |
| Consumer Electronics and Appliances | |
| Healthcare and Medical Supplies | |
| Others | |
| By Region | Northeast |
| Southeast | |
| Midwest | |
| Southwest | |
| West |
Key Questions Answered in the Report
What is the projected value of the US middle-mile delivery space by 2031?
The United States middle-mile delivery market is projected to reach USD 42.71 billion by 2031, up from USD 34.95 billion in 2026, growing at a 4.09% CAGR.
Which transportation mode leads freight movement between hubs in the US?
Roadways led with a 65.81% share in 2025 because they offer the best flexibility across dense corridors and lower-density regional routes.
Which business model is expanding the fastest through 2031?
C2C is the fastest-growing business model with a 6.08% CAGR, supported by rising resale and marketplace volumes that still require middle-mile consolidation.
Why is the Southwest the fastest-growing US region?
The Southwest is expanding at a 5.45% CAGR because of Texas-Mexico trade growth, new industrial corridors, and strong activity on repeat freight lanes such as I-35.
What is driving faster growth in temperature-controlled freight?
Temperature-controlled lanes are growing at 7.79% because biologics, specialty pharmaceuticals, fresh-food e-commerce, and tighter traceability needs require validated cold-chain movement.
Which end-user group creates the largest revenue base today?
E-commerce retail accounted for 37.39% of total revenue in 2025, making it the largest contributor to inter-hub freight demand across national distribution networks.