
United States Life Science Tools Market Size and Share
Market Overview
| Study Period | 2020 - 2031 |
|---|---|
| Forecast Data Period | 2026 - 2031 |
| Base Year Market Size (2025) | USD 52.51 Billion |
| Market Size (2026) | USD 54.65 Billion |
| Market Size (2031) | USD 70.19 Billion |
| Growth Rate (2026 - 2031) | 5.13 % |
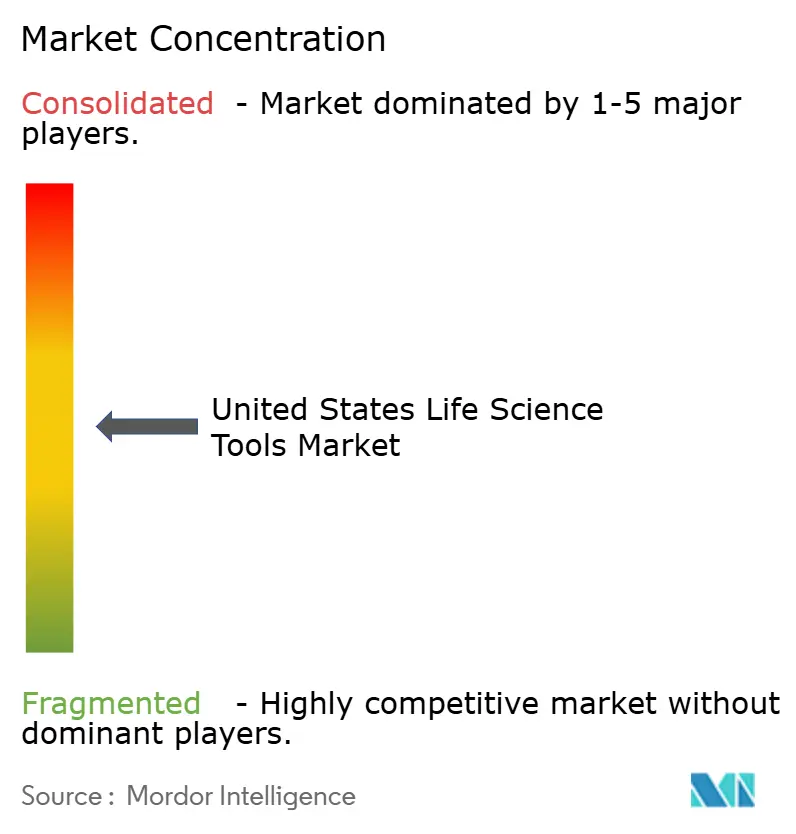
| Market Concentration | Medium |
Major Players *Disclaimer: Major Players sorted in no particular order Image © Mordor Intelligence. Reuse requires attribution under CC BY 4.0. | |
United States Life Science Tools Market Analysis by Mordor Intelligence
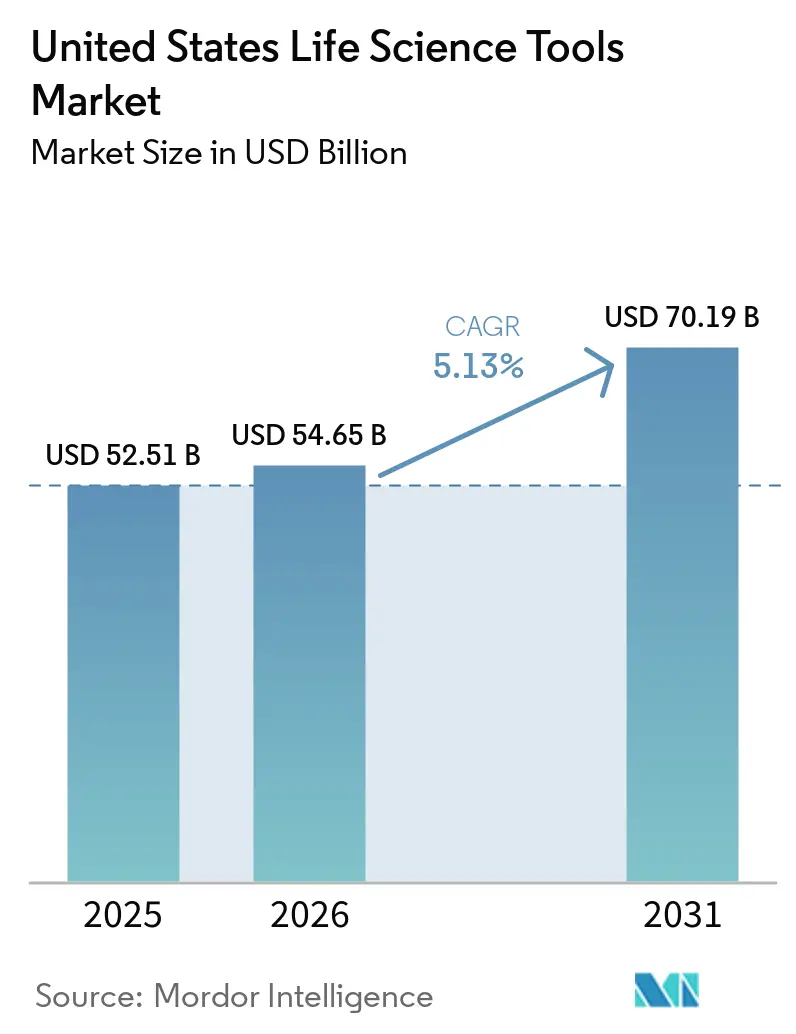
The United States Life Science Tools Market size is projected to expand from USD 52.51 billion in 2025 and USD 54.65 billion in 2026 to USD 70.19 billion by 2031, registering a CAGR of 5.13% between 2026 to 2031.
The United States life science tools market is being supported by a steady rise in precision oncology programs, rare disease pipelines, and broader use of multi-omics workflows across research and clinical settings. Procurement behavior is also changing as biosecurity scrutiny pushes buyers toward domestically validated suppliers, which is reshaping vendor selection, qualification timelines, and sourcing decisions across the United States life science tools market. Demand is also deepening in advanced therapy manufacturing, where GMP-grade analytics, real-time monitoring tools, and specialized characterization platforms are becoming standard requirements rather than optional upgrades. At the same time, laboratories moving from bulk RNA sequencing toward single-cell and spatial workflows are expanding spending on informatics, which is allowing software and service revenue to rise faster than hardware placements alone would normally support within the United States life science tools market. These shifts indicate that growth in the United States life science tools market is increasingly tied to recurring workflow intensity, regulatory readiness, and installed-base monetization rather than one-time instrument placement alone.
Key Report Takeaways
- By product, instruments held 48.87% of revenue in 2025, while consumables and reagents are projected to grow at a 6.98% CAGR through 2031.
- By technology, proteomic technology led with 33.83% of revenue in 2025, while genomic technology is expected to expand at a 7.46% CAGR through 2031.
- By application, drug discovery and development accounted for 38.12% of revenue in 2025, while clinical diagnostics and precision medicine are forecast to advance at a 6.61% CAGR through 2031.
- By end user, pharmaceutical and biotechnology companies represented 35.74% of revenue in 2025, while contract research organizations and CDMOs are projected to grow at a 7.07% CAGR through 2031.
Note: Market size and forecast figures in this report are generated using Mordor Intelligence’s proprietary estimation framework, updated with the latest available data and insights as of January 2026.
United States Life Science Tools Market Trends and Insights
Drivers Impact Analysis*
| Driver | (~) % Impact on CAGR Forecast | Geographic Relevance | Impact Timeline |
|---|---|---|---|
| United States Biopharma R&D Intensity and Pipeline Complexity | +1.2% | National, concentrated in Greater Boston, San Francisco Bay Area, and the NY/NJ Biopharma Corridor | Medium term (2-4 years) |
| NIH Extramural Funding and Translational Program Spend | +0.8% | National, with highest density in Massachusetts, Maryland, California, and North Carolina | Medium term (2-4 years) |
| Precision Medicine Scaling Across Oncology and Rare Disease | +1.4% | National, with early gains in Boston, Houston, and San Diego oncology clusters | Long term (≥ 4 years) |
| NGS Cost Compression and Multi-Omics Throughput Gains | +1.3% | National, with spill-over into academic core facilities in the Midwest and Southeast | Long term (≥ 4 years) |
| Spatial Biology and Single-Cell Workflow Adoption | +0.9% | National, led by top-tier research universities and pharma R&D campuses | Long term (≥ 4 years) |
| Trusted-Source Procurement Shifts After Biosecurity Scrutiny | +0.6% | National, most acute in federally contracted biopharma, CDMOs, and government-funded research sites | Short term (≤ 2 years) |
| Source: Mordor Intelligence | |||
United States Biopharma R&D Intensity and Pipeline Complexity
The United States life science tools market is seeing more analytically demanding biopharma programs than it did in 2024, especially in oncology, rare disease, and advanced modality development. Companion diagnostic co-development, multi-omics patient stratification, and deeper CMC characterization are now common requirements for many programs, which raises the number of tools used per asset. Rare disease work adds further pressure because smaller patient cohorts require high-sensitivity proteomic and genomic workflows where data quality per sample carries greater weight than simple throughput. Cost pressure in drug development is also reinforcing demand for higher-throughput and more automatable platforms that can compress timelines and reduce workflow repetition. The rise of bispecific antibodies, antibody-drug conjugates, and other complex modalities is widening the use of orthogonal analytical methods such as native mass spectrometry, mass photometry, and microfluidic capillary electrophoresis across the United States life science tools market.
Precision Medicine Scaling Across Oncology and Rare Disease
The commercial expansion of precision medicine is creating durable demand for clinical genomic and proteomic workflows beyond discovery laboratories in the United States life science tools market. Broader use of companion diagnostics is helping diagnostic developers and biopharma companies align regulatory and development pathways more efficiently. A peer-reviewed study on FDA oncology approvals found that companion diagnostic use was associated with a mean reduction of 379.5 days in clinical development time, which supports faster program execution and raises the value of integrated diagnostic toolsets.[1] Medicare coverage is also widening for highly sensitive molecular testing, including the May 2026 coverage expansion for Personalis NeXT Personal in Stage II-III triple-negative and HER2-positive breast cancer treatment monitoring. As laboratories layer liquid biopsy workflows onto existing sequencing platforms, the United States life science tools market is gaining a second stream of reagent demand from the same clinical site.
NGS Cost Compression and Multi-Omics Throughput Gains
Sequencing economics are shifting capital allocation inside the United States life science tools market as long-read and short-read platforms expand into different but complementary workflow positions. PacBio stated in February 2026 that its SPRQ-Nx chemistry for Revio systems brought long-read whole-genome sequencing below USD 300 per genome, which lowers the barrier for large-scale high-fidelity projects.[2] Illumina also launched TruPath Genome in February 2026 to improve high-accuracy coverage in genomic dark regions, which extends short-read relevance in clinical and research workflows. These platforms are not replacing one another, and that coexistence is increasing demand for separate flow cells, kits, and library preparation chemistries across the United States life science tools market. Multi-omics studies that combine transcriptomics, proteomics, and metabolomics are also raising per-sample consumable spending even as per-base sequencing costs decline.
Spatial Biology and Single-Cell Workflow Adoption
Spatial biology and single-cell analysis are moving beyond bespoke research use and becoming more routine in pharma R&D workflows, which is lifting workflow density in the United States life science tools market. In April 2026, 10x Genomics introduced Atera for whole-transcriptome spatial analysis at single-cell resolution and planned commercial shipments for the second half of 2026. Its linked STELA initiative with Bioptimus shows that vendors are building competitive strength not only through instruments but also through proprietary data generation and interpretation layers. That shift is important because curated datasets and software-assisted interpretation can raise switching costs even when hardware alternatives exist. QIAGEN also moved into this workflow area with its December 2025 acquisition of Parse Biosciences, adding instrument-free single-cell chemistry used by more than 3,000 customers.
Restraints Impact Analysis*
| Restraint | (~) % Impact on CAGR Forecast | Geographic Relevance | Impact Timeline |
|---|---|---|---|
| Advanced Instrument CAPEX and Recurring Consumables Burden | -0.5% | National, most acute at academic institutions and community hospital labs with fixed budgets | Medium term (2-4 years) |
| LDT Regulatory Phaseout Raises Validation and Compliance Costs | -0.3% | National, concentrated in clinical laboratory networks and specialty diagnostic labs | Short term (≤ 2 years) |
| NIH Grant Timing Volatility for Academia-Led Purchases | -0.2% | National, with disproportionate impact on Northeastern and Midwestern research universities | Short term (≤ 2 years) |
| Specialist Talent Shortages in Bioinformatics and Field Service | -0.1% | National, most severe in metropolitan biotech clusters with high compensation competition | Long term (≥ 4 years) |
| Source: Mordor Intelligence | |||
Advanced Instrument CAPEX and Recurring Consumables Burden
Capital budget pressure is slowing instrument refresh cycles across academic core facilities, hospital laboratories, and mid-sized biotech buyers in the United States life science tools market. A fall 2025 laboratory purchasing survey showed that 81.1% of labs entered 2026 with cost reduction as a primary operating mandate, while 81.9% said they were willing to abandon brand loyalty for the lowest total cost of ownership. This behavior is increasing hardware price pressure and making lower-CAPEX or instrument-free workflows more attractive in some use cases. Fully integrated automation systems also carry long installation and validation periods, which makes adoption harder for sites that cannot justify extended procurement cycles or temporary workflow disruption. Financing structures such as instrument-as-a-service and reagent rental are helping at the high end, but they remain concentrated among larger vendor relationships rather than broadly available across the United States life science tools market.
Specialist Talent Shortages in Bioinformatics and Field Service
A shortage of bioinformatics specialists and advanced field engineering talent is limiting the effective use of sophisticated platforms already installed across the United States life science tools market. The 2025 National Workforce Trends Report from the Life Sciences Workforce Collaborative found that AI adoption is raising demand for workers who can bridge life sciences and computational capabilities, while supply remains constrained.[3] This constraint affects instrument utilization, data interpretation, workflow validation, and service turnaround times rather than initial placement alone. Vendors therefore face a recurring revenue problem because lower utilization directly weakens consumable pull-through even when the hardware base is already in place. In practical terms, the United States life science tools market is being held back by a skills bottleneck that product improvement alone cannot fully solve.
*Our forecasts treat driver/restraint impacts as directional, not additive. The impact forecasts reflect baseline growth, mix effects, and variable interactions.
Segment Analysis
By Product: Consumables Recurring Revenue Accelerates Beyond Installed Base Growth
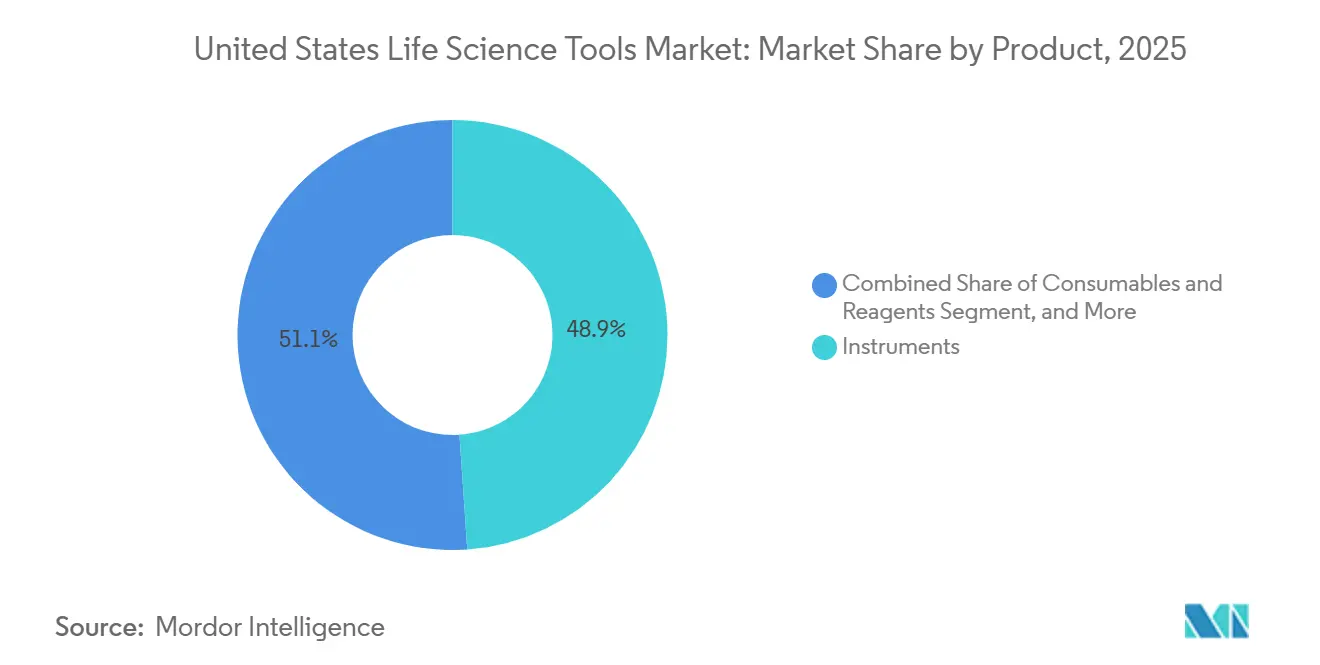
Instruments held 48.87% of the United States life science tools market share in 2025, which kept them as the largest product category by revenue. This position was supported by high-value placements of chromatography systems, mass spectrometry platforms, sequencing systems, and flow cytometers across biopharma R&D and pharmaceutical manufacturing sites. Within this product tier, mass spectrometry and sequencing systems are seeing the strongest unit revenue momentum as clinical laboratories upgrade platforms and CGT manufacturing expands analytical buildout. Liquid handling and lab automation systems are also gaining ground in high-throughput discovery settings where precision and reproducibility requirements are pushing smaller biotech firms toward automation.
Consumables and reagents are projected to grow at a 6.98% CAGR through 2031, making them the fastest-growing product type in the United States life science tools market. This pattern reflects the compounding effect of recurring demand once instruments are already installed and running more frequently across oncology testing, cell therapy, and multi-omics workflows. Sequencing reagents and library preparation kits, antibodies and immunoreagents, and cell culture media remain the strongest sub-categories because they are tied directly to run volume rather than placement cycles. Software and services are also expanding steadily as bioinformatics, LIMS, and workflow informatics become more important to data-heavy programs, and Illumina highlighted this direction with BioInsight in its first-quarter 2026 results commentary.

By Technology: Genomic Platforms Pulling Ahead of the Broader Market
Proteomic technology accounted for 33.83% of the United States life science tools market size in 2025, reflecting the central role of mass spectrometry, chromatography, and immunoassay platforms in biologics development and quality control. Biologics, bispecific antibodies, and cell therapy products all require high-resolution characterization across development and manufacturing stages, which sustains both capital placements and recurring consumable pull-through. Protein microarrays and immunoassays also remain widely used across pharma R&D and clinical laboratories, giving this segment a stable installed base and repeat purchasing pattern. The segment, therefore, remains foundational to the United States life science tools market even as newer genomic workflows expand faster.
Genomic technology is projected to expand at a 7.46% CAGR through 2031, which makes it the fastest-growing technology segment. Falling sequencing costs and wider use of clinical NGS in oncology and genetic disease testing are broadening the customer base from research settings into more routine clinical use. Cell biology technology is also benefiting from cell and gene therapy development, especially in flow cytometry, imaging, and high-content screening platforms used by CDMOs and specialty pharma groups. Multi-omics and spatial biology remain smaller in revenue terms, but they are evolving quickly as single-cell and spatial transcriptomics move from academic research into more structured pharma R&D workflows.
By Application: Drug Discovery Anchors Revenue While Clinical Diagnostics Accelerates
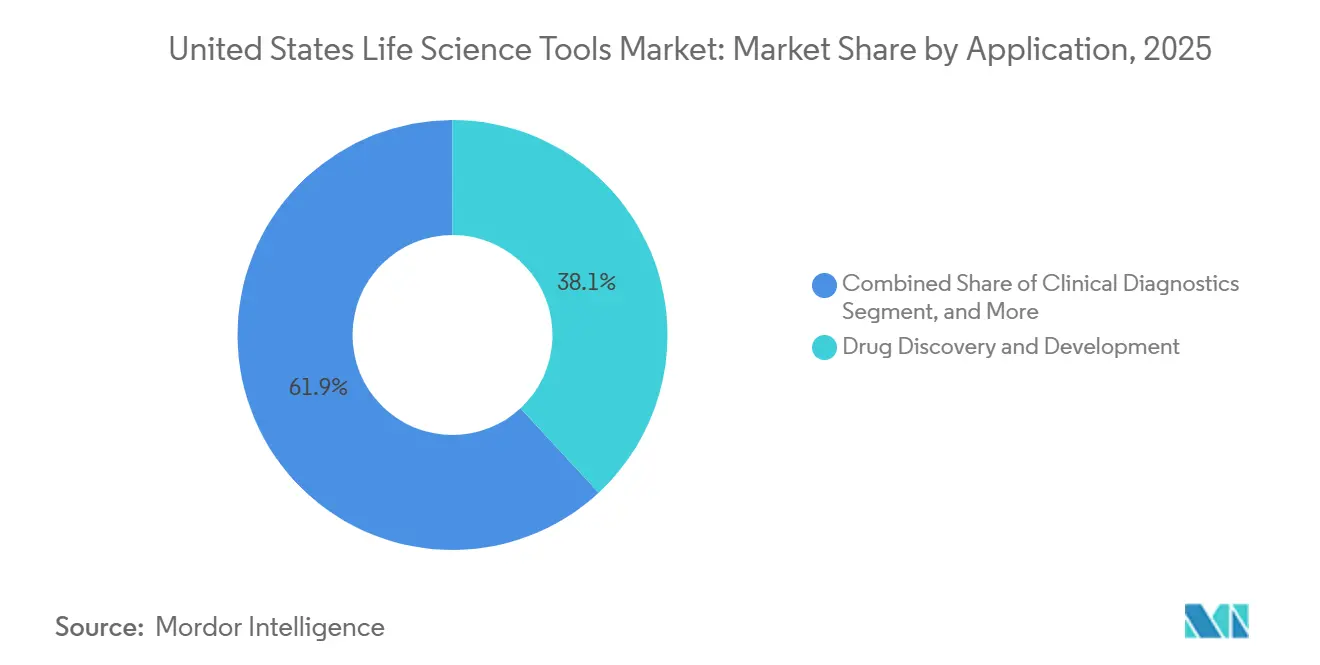
Drug discovery and development represented 38.12% of the United States life science tools market size in 2025, which made it the largest application segment. Modern development programs require broad tool usage across target identification, high-throughput screening, translational research, and CMC analytics, especially in oncology and advanced therapies. Preclinical translational work in 2026 is particularly tool-intensive because spatial transcriptomics, single-cell proteomics, and organoid-based systems are moving into more standard pharmacology workflows. That wide analytical footprint continues to anchor the United States life science tools market even as later-stage clinical use cases gain share.
Clinical diagnostics and precision medicine are forecast to grow at a 6.61% CAGR through 2031, making it the fastest-growing application area. Oncology testing and companion diagnostic development are the main growth engines as reimbursement pathways widen and molecular monitoring becomes more routine. Academic and government research remains a major application area, with NIH extramural grants reaching USD 35.3 billion in FY2025, even though competing research project grant awards declined 20.5% in the same year. Bioprocessing and advanced therapies also remain highly capital-intensive because CGT manufacturing requires GMP-aligned analytical tools, bioprocess sensors, and specialized assay kits for validation and identity testing.
By End User: CRO and CDMO Growth Signals Structural Outsourcing Momentum
Pharmaceutical and biotechnology companies held 35.74% of the United States life science tools market share in 2025, which made them the largest end-user group. These companies remain the core demand engine because they purchase directly while also shaping the analytical requirements that spread through the broader vendor ecosystem. Large pharma companies are still building internal analytical capabilities for biologics and CGT programs, while smaller biotech firms are routing a larger share of work through external partners. That mix supports both direct instrument placements and indirect tool demand linked to outsourced development activity across the US life science tools industry.
Contract research organizations and CDMOs are projected to grow at a 7.07% CAGR through 2031, making them the fastest-growing end-user segment. Their growth reflects structural outsourcing in biopharma and the high tool intensity of analytical development and advanced therapy manufacturing. Academic and research institutes remain a large institutional buyer class, although NIH awarded 55,394 total extramural grants in FY2025, down 6.2% from FY2024, which adds lumpiness to procurement timing. Hospitals and diagnostic laboratories are also expanding molecular diagnostics capacity, especially around NGS-based oncology panels and hospital-based precision oncology programs.
Geography Analysis
The Boston-Cambridge corridor, the San Francisco Bay Area, and San Diego remain the highest-density demand clusters in the United States life science tools market. Greater Boston combines clinical-stage biotechs, research hospitals, and leading universities, which keeps sequencing, spatial biology, and advanced proteomics platforms heavily concentrated in that corridor. The Bay Area adds a second concentration point through a mix of large biopharma companies and clinical-stage biotech firms that sustain spending across discovery and bioprocessing workflows. San Diego further strengthens national demand through its strong genomics base and rising activity in long-read sequencing and liquid biopsy platforms.
The Mid-Atlantic and Southeast are forming a meaningful second layer of demand in the United States life science tools market. Bethesda benefits from the NIH campus and related research activity, while North Carolina gains from the Research Triangle Park ecosystem and its biomanufacturing base. Gene and cell therapy CDMO expansion across the Southeast is also increasing demand for GMP-grade analytical tools, validated genomic identity testing, and single-use process monitoring platforms. Regulatory requirements tied to GMP practice and quality system compliance are making validation standards especially important for tools used in clinical manufacturing and regulated testing. As this infrastructure expands through 2028, the region is likely to attract more supplier investment, more application support, and deeper installed-base development.
The Midwest and Mountain West remain smaller in total demand, but they are becoming more important to the United States life science tools market as hospital systems, academic medical centers, and regional diagnostic laboratories expand molecular capabilities. Cities such as Chicago, Minneapolis, Cleveland, Columbus, and Indianapolis are adding steady research and diagnostic activity that supports flow cytometry, imaging, and clinical sequencing demand. Institutions including Northwestern, the University of Chicago, Mayo Clinic, and Ohio State provide a stable academic and clinical user base that helps balance coastal concentration. Several leading vendors have responded by positioning more field service and application specialist resources in the Midwest, showing that uptime and support speed now matter more in purchase decisions where instrument redundancy is limited.
Competitive Landscape
The United States life science tools market has a moderately consolidated top tier led by Thermo Fisher Scientific and Danaher Corporation, while the next layer includes Illumina, Waters Corporation, Agilent Technologies, QIAGEN, Sartorius, Bruker, and 10x Genomics. Competitive positioning changed materially in 2025 and 2026 as large transactions expanded vendor scale and widened product portfolios. Waters completed its USD 17.5 billion combination with BD's Biosciences and Diagnostic Solutions businesses on February 9, 2026, which gave it a stronger position in flow cytometry, cell analysis, and diagnostic reagents. Danaher also announced its USD 9.9 billion acquisition of Masimo Corporation in February 2026, which broadens its specialty diagnostics reach and further raises the competitive bar around integrated platforms.
The United States life science tools market is also shifting toward integrated hardware, software, and workflow ecosystems rather than stand-alone instruments. Thermo Fisher said at its May 2026 investor day that it planned a second-half 2026 launch of fully autonomous instruments developed with NVIDIA for pharma research settings. QIAGEN is pursuing a similar lock-in strategy from the software side through QIA Agent, its AI-enabled digital assistant across sample-to-insight workflows. Smaller specialists are still competitive where chemistry depth or workflow focus matters more than broad catalog scale, which is why 10x Genomics remains important in spatial biology, and PacBio retains a strong position in long-read sequencing. This means the United States life science tools market is consolidating at the top without becoming uniform in innovation paths.
Procurement rules are also becoming a stronger competitive factor in the United States life science tools market. The BIOSECURE Act, signed into law on December 18, 2025, is pushing federally exposed buyers toward suppliers that can clear new sourcing and compliance checks. That shift favors domestic or allied-nation vendors with stronger validation, documentation, and service support across regulated environments. At the same time, it creates near-term cost pressure because supply chains, approved vendor lists, and customer qualification processes are all being reworked. Competition, therefore, increasingly depends on trusted sourcing, installed-base support, and workflow integration rather than price alone.
United States Life Science Tools Industry Leaders
-
Becton, Dickinson and Company
-
Merck KGaA (MilliporeSigma)
-
Sartorius AG
-
Waters Corporation
-
10x Genomics
- *Disclaimer: Major Players sorted in no particular order
Recent Industry Developments
- May 2026: Danaher Corporation raised USD 3 billion in a record private-placement bond sale in Swiss franc-denominated notes to help finance its pending USD 9.9 billion acquisition of Masimo Corporation, one of the largest life science sector financing events of the year. The transaction is expected to strengthen Danaher's specialty diagnostics portfolio and enable integration of acute-care monitoring platforms with its life science business units.
- May 2026: The FDA approved Guardant360 Liquid CDx as the largest FDA-approved liquid biopsy panel, with a 100-fold expanded genomic footprint versus its predecessor and 7 pre-existing companion diagnostic indications transferred to the new test. The approval sets a new regulatory benchmark for comprehensive liquid biopsy-based CDx platforms and is expected to drive NGS reagent demand at clinical laboratory sites.
- May 2026: The Centers for Medicare and Medicaid Services' Molecular Diagnostic Services Program expanded Medicare coverage for Personalis's NeXT Personal MRD test to include treatment monitoring for Stage II-III triple-negative and HER2-positive breast cancer. This 4th CMS coverage milestone for NeXT Personal broadens reimbursable use of ultrasensitive genomic tools into the neoadjuvant oncology setting, widening the addressable clinical NGS consumable market.
- April 2026: 10x Genomics introduced Atera, a new in situ spatial biology platform designed for whole-transcriptome analysis at single-cell resolution at unprecedented throughput, with commercial shipments expected in the second half of 2026. The platform launch was accompanied by a partnership with Bioptimus for the STELA global spatial data initiative, targeting foundational datasets that connect underlying biology with disease outcomes.
United States Life Science Tools Market Report Scope
The Life Science Tools Market encompasses the instruments, consumables, reagents, and software used in biological research, clinical diagnostics, and drug development. It forms the technological backbone for industries studying living organisms, enabling critical processes like DNA sequencing, cell sorting, and molecular analysis.
The United States Life Science Tools Market, reported in terms of value (USD), is structured across several key segmentation dimensions that reflect the breadth of technologies and end‑use applications in the sector. By product category, the market includes instruments, consumables and reagents, as well as software and services. From a technology perspective, the landscape spans genomic tools, proteomic platforms, cell biology technologies, multi‑omics and spatial biology solutions, and analytical and separation technologies. In terms of application areas, life science tools support drug discovery and development, clinical diagnostics, academic and government research, and bioprocessing and advanced therapies. Finally, by end user, the market serves pharmaceutical and biotechnology companies, academic institutes, hospitals and diagnostic laboratories, and contract research and manufacturing organizations (CROs and CDMOs).
| Instruments | Chromatography Systems |
| Mass Spectrometry Systems | |
| Flow Cytometers and Cell Sorters | |
| Sequencing Systems | |
| Microscopy and Imaging Systems | |
| PCR and qPCR Systems | |
| Liquid Handling and Lab Automation Systems | |
| Electrophoresis and Separation Systems | |
| Centrifuges and Sample Preparation Systems | |
| Consumables and Reagents | Assay Kits |
| Antibodies and Immunoreagents | |
| Cell Culture Media and Sera | |
| Sequencing Reagents and Library Preparation Kits | |
| PCR Reagents and Enzymes | |
| Chromatography Columns and Solvents | |
| Sample Preparation and Purification Kits | |
| Microplates, Tubes, Tips and Lab Plastics | |
| Software and Services | Bioinformatics and Data Analysis Software |
| LIMS and Workflow Informatics | |
| Instrument Service and Maintenance | |
| Contract Assay and Research Services |
| Genomic Technology | Next-Generation Sequencing |
| Sanger Sequencing | |
| PCR and qPCR | |
| Microarrays | |
| Digital PCR | |
| Proteomic Technology | Mass Spectrometry |
| Protein Microarrays | |
| Chromatography | |
| Immunoassays | |
| Cell Biology Technology | Cell Culture |
| Flow Cytometry | |
| High-Content Screening | |
| Imaging and Microscopy | |
| Cell Line Development Tools | |
| Multi-omics and Spatial Biology | Single-Cell Omics |
| Spatial Transcriptomics | |
| Spatial Proteomics | |
| Integrated Multi-omics Informatics | |
| Analytical and Separation Technology | Spectroscopy |
| Electrophoresis | |
| Centrifugation | |
| Liquid Handling and Automation |
| Drug Discovery and Development | Target Identification and Validation |
| Hit Discovery and Screening | |
| Preclinical Translational Research | |
| CMC and Process Development Analytics | |
| Clinical Diagnostics and Precision Medicine | Oncology Testing |
| Rare Disease and Inherited Disease Testing | |
| Infectious Disease Testing | |
| Companion Diagnostics Development | |
| Academic and Government Research | Basic Research |
| Translational Research | |
| Core Facilities | |
| Bioprocessing and Advanced Therapies | Cell Therapy Development |
| Gene Therapy Development | |
| Biologics and Biosimilars Analytics | |
| Vaccine Research and Manufacturing Support |
| Pharmaceutical and Biotechnology Companies |
| Academic and Research Institutes |
| Hospitals and Diagnostic Laboratories |
| Contract Research Organizations and CDMOs |
| By Product | Instruments | Chromatography Systems |
| Mass Spectrometry Systems | ||
| Flow Cytometers and Cell Sorters | ||
| Sequencing Systems | ||
| Microscopy and Imaging Systems | ||
| PCR and qPCR Systems | ||
| Liquid Handling and Lab Automation Systems | ||
| Electrophoresis and Separation Systems | ||
| Centrifuges and Sample Preparation Systems | ||
| Consumables and Reagents | Assay Kits | |
| Antibodies and Immunoreagents | ||
| Cell Culture Media and Sera | ||
| Sequencing Reagents and Library Preparation Kits | ||
| PCR Reagents and Enzymes | ||
| Chromatography Columns and Solvents | ||
| Sample Preparation and Purification Kits | ||
| Microplates, Tubes, Tips and Lab Plastics | ||
| Software and Services | Bioinformatics and Data Analysis Software | |
| LIMS and Workflow Informatics | ||
| Instrument Service and Maintenance | ||
| Contract Assay and Research Services | ||
| By Technology | Genomic Technology | Next-Generation Sequencing |
| Sanger Sequencing | ||
| PCR and qPCR | ||
| Microarrays | ||
| Digital PCR | ||
| Proteomic Technology | Mass Spectrometry | |
| Protein Microarrays | ||
| Chromatography | ||
| Immunoassays | ||
| Cell Biology Technology | Cell Culture | |
| Flow Cytometry | ||
| High-Content Screening | ||
| Imaging and Microscopy | ||
| Cell Line Development Tools | ||
| Multi-omics and Spatial Biology | Single-Cell Omics | |
| Spatial Transcriptomics | ||
| Spatial Proteomics | ||
| Integrated Multi-omics Informatics | ||
| Analytical and Separation Technology | Spectroscopy | |
| Electrophoresis | ||
| Centrifugation | ||
| Liquid Handling and Automation | ||
| By Application | Drug Discovery and Development | Target Identification and Validation |
| Hit Discovery and Screening | ||
| Preclinical Translational Research | ||
| CMC and Process Development Analytics | ||
| Clinical Diagnostics and Precision Medicine | Oncology Testing | |
| Rare Disease and Inherited Disease Testing | ||
| Infectious Disease Testing | ||
| Companion Diagnostics Development | ||
| Academic and Government Research | Basic Research | |
| Translational Research | ||
| Core Facilities | ||
| Bioprocessing and Advanced Therapies | Cell Therapy Development | |
| Gene Therapy Development | ||
| Biologics and Biosimilars Analytics | ||
| Vaccine Research and Manufacturing Support | ||
| By End User | Pharmaceutical and Biotechnology Companies | |
| Academic and Research Institutes | ||
| Hospitals and Diagnostic Laboratories | ||
| Contract Research Organizations and CDMOs | ||
Key Questions Answered in the Report
What is the 2026 size of the United States life science tools market?
The United States life science tools market is valued at USD 54.65 billion in 2026 and is projected to reach USD 70.19 billion by 2031 at a 5.13% CAGR.
Which product category leads revenue generation in life science tools in the United States?
Instruments remain the largest product category with 48.87% revenue share in 2025, supported by sequencing systems, mass spectrometry platforms, chromatography, and flow cytometry.
Which product area is growing the fastest through 2031?
Consumables and reagents are the fastest-growing product group with a 6.98% CAGR through 2031 because installed instruments generate recurring kit and reagent demand.
Which technology segment is expanding the fastest in this space?
Genomic technology is forecast to grow at a 7.46% CAGR through 2031, driven by falling sequencing costs and broader clinical NGS use in oncology and genetic disease testing.
Why are CROs and CDMOs becoming more important buyers of life science tools?
CROs and CDMOs are projected to grow at a 7.07% CAGR through 2031 because biopharma outsourcing is rising and advanced therapy manufacturing requires GMP-grade analytical and monitoring tools.