
United States Industrial Manufacturing Logistics Market Size and Share
Market Overview
| Study Period | 2020 - 2031 |
|---|---|
| Forecast Data Period | 2026 - 2031 |
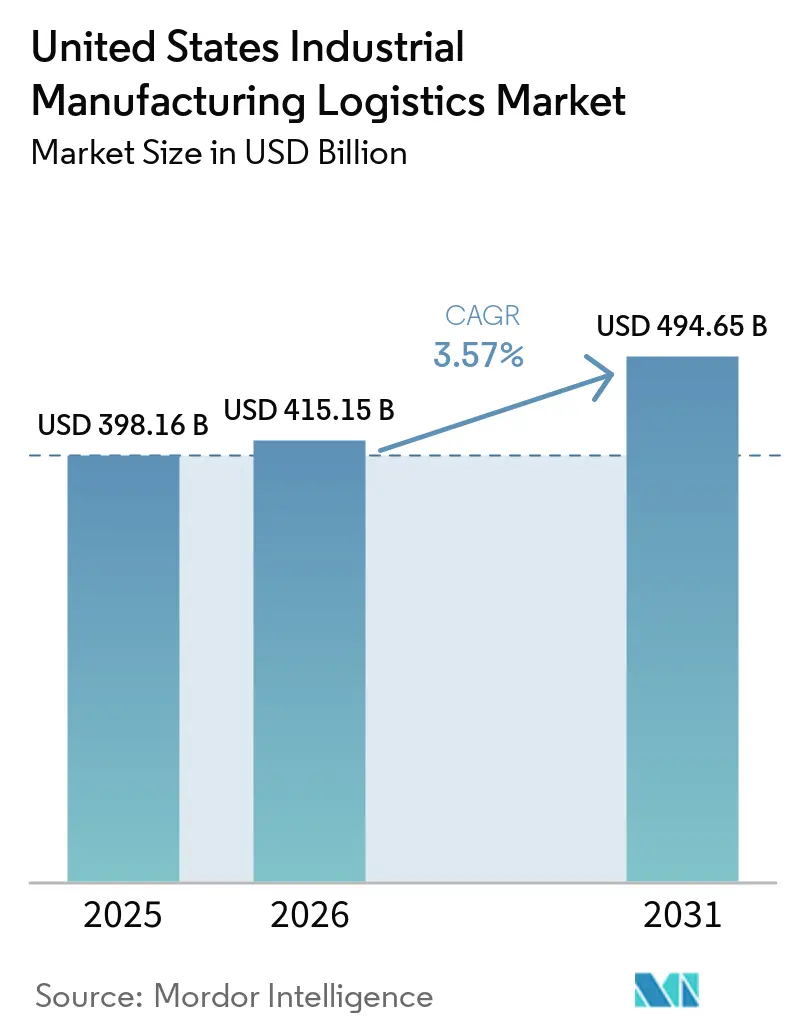
| Base Year Market Size (2025) | USD 398.16 Billion |
| Market Size (2026) | USD 415.15 Billion |
| Market Size (2031) | USD 494.65 Billion |
| Growth Rate (2026 - 2031) | 3.57 % |
| Market Concentration | Low |
Major Players *Disclaimer: Major Players sorted in no particular order Image © Mordor Intelligence. Reuse requires attribution under CC BY 4.0. | |
United States Industrial Manufacturing Logistics Market Analysis by Mordor Intelligence
The United States industrial manufacturing logistics market was valued at USD 398.16 billion in 2025 and estimated to grow from USD 415.15 billion in 2026 to reach USD 494.65 billion by 2031, at a CAGR of 3.57% during the forecast period (2026-2031).
Growth in the United States industrial manufacturing logistics market is tied less to broad freight cycles and more to the redesign of manufacturing networks around domestic production, regional supplier bases, and faster replenishment loops. Cross-border industrial trade with Mexico remains central to this shift because land transport still accounts for the bulk of bilateral freight, keeping demand focused on trucking, customs support, and border corridor capacity planning. The United States industrial manufacturing logistics market is also being shaped by tighter requirements for traceability, controlled handling, and validated storage as manufacturers move more sensitive materials through multi-node domestic networks. Competitive strategy in the United States industrial manufacturing logistics market is moving toward network density, cross-border execution, and bundled service models, as shown by acquisition-led scale expansion and targeted capability building across contract logistics and secure freight. These conditions leave the strongest opening in specialized services, hybrid capacity structures, and compliance-heavy manufacturing flows where shippers want both flexibility and a higher degree of operating control.
Key Report Takeaways
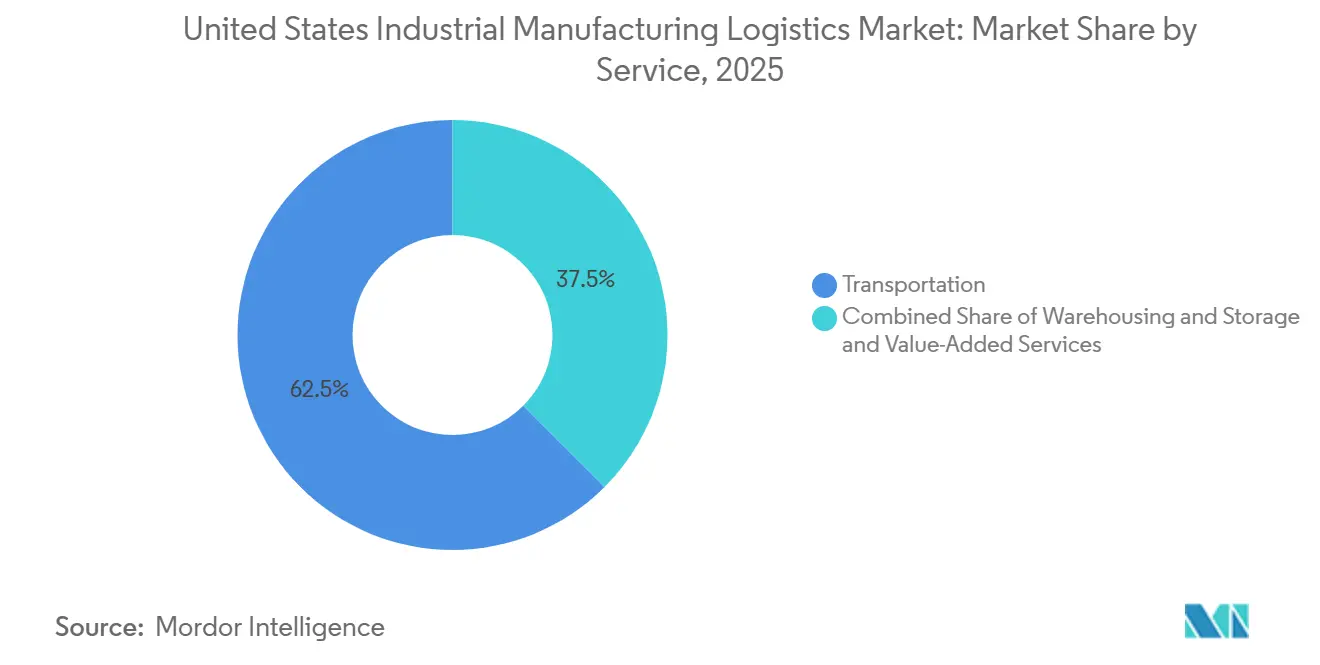
- By service, transportation accounted for 62.50% of the United States industrial manufacturing logistics market share in 2025, while the value-added services segment is expected to record the highest projected CAGR of 4.20% through 2031.
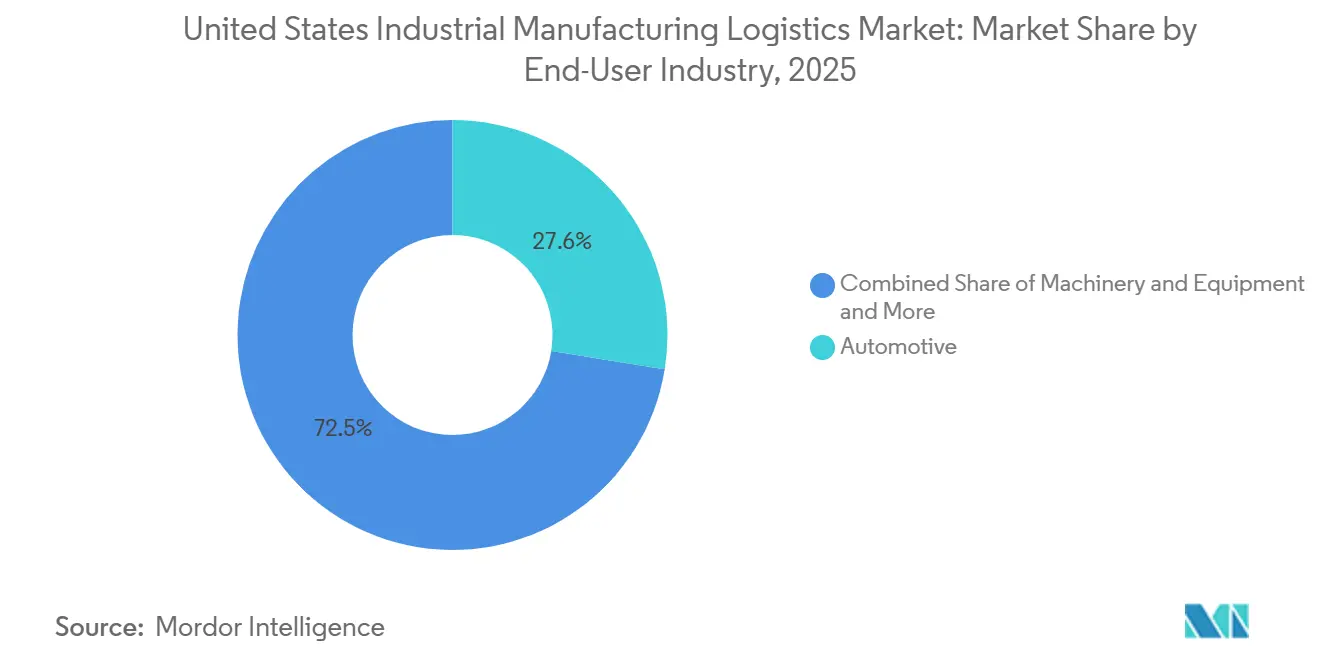
- By end-user industry, automotive held 27.55% share in 2025, while the electronics and semiconductors segment is projected to record the highest CAGR at 4.70% through 2031.
- By logistics model, asset-light operators accounted for 43.85% of the United States industrial manufacturing logistics market size in 2025, while hybrid models are expected to grow fastest at a 5.10% CAGR through 2031.
- By geography, the Midwest captured 32.30% share in 2025, while the Southeast is forecast to advance at a 4.48% CAGR through 2031.
Note: Market size and forecast figures in this report are generated using Mordor Intelligence’s proprietary estimation framework, updated with the latest available data and insights as of January 2026.
United States Industrial Manufacturing Logistics Market Trends and Insights
Drivers Impact Analysis*
| Driver | (~) % Impact on CAGR Forecast | Geographic Relevance | Impact Timeline |
|---|---|---|---|
| Nearshoring and Reconfiguration of the United States Manufacturing Networks | +0.8% | National, with concentrated gains in Midwest, Southeast, and Texas-Mexico border corridors | Medium term (2-4 years) |
| Expansion Of Cross-Border Industrial Freight Flows With Canada And Mexico | +0.6% | National, highest impact on Texas, Michigan, and California border-adjacent logistics hubs | Short term (≤ 2 years) |
| Automation-Led Productivity Gains In Warehousing And Material Handling | +0.5% | National, with early gains in Midwest and Southeast big-box industrial corridors | Medium term (2-4 years) |
| Growth Of Time-Sensitive And Temperature-Controlled Industrial Logistics | +0.4% | National, concentrated in Southeast, Midwest, and Gulf Coast chemical and pharma corridors | Short term (≤ 2 years) |
| Control Tower Adoption For Multi-Node Manufacturing Supply Chains | +0.3% | National, with advanced deployments among Tier 1 automotive and aerospace manufacturers | Long term (≥ 4 years) |
| Compliance-Driven Demand For Traceability And Shipment Visibility | +0.3% | National, early enforcement pressure in food-adjacent chemicals and pharmaceutical-grade industrial inputs | Medium term (2-4 years) |
| Source: Mordor Intelligence | |||
Nearshoring and Reconfiguration of the United States Manufacturing Networks
Nearshoring is changing the structure of freight demand in the United States industrial manufacturing logistics market, as more production programs now depend on regional supplier webs rather than long, ocean-linked replenishment models. Cross-border freight between the United States and Mexico reached USD 872.8 billion in 2025, which shows the scale of production-related trade already moving through North American corridors[1]. As final assembly shifts closer to the end, demand and component sourcing become more regional, manufacturers need more multi-origin inbound scheduling, cross-docking, and supplier-managed inventory support across inland production corridors. This shifts logistics architecture from import consolidation toward denser domestic movement, shorter haul planning cycles, and more frequent plant-facing handoffs, which require stronger local execution. The United States industrial manufacturing logistics market benefits most where providers already have assets, carrier relationships, and operating teams near the Midwest, Southeast, and Texas-Mexico freight lanes. Contract awards are increasingly favoring operators that can absorb step-ups in production activity without forcing manufacturers to build internal logistics capacity that is expensive to scale and hard to staff.
Expansion Of Cross-Border Industrial Freight Flows With Canada And Mexico
The United States industrial manufacturing logistics market is drawing direct support from higher North American industrial trade, as regional production plans still rely on steady cross-border movement of parts, subassemblies, and finished goods. Trucks accounted for 73.6% of the United States-Mexico freight value in 2025, confirming that land-based transport remains the dominant channel for manufacturing-linked cargo on this corridor. Corridor performance is also becoming more uneven, with electronics-related lanes showing stronger momentum while some automotive routes remain more exposed to production scheduling changes and component disruptions. That mix matters because cross-border growth is no longer just a volume story; it is also a documentation, customs, timing, and exception-management story for manufacturers that run lean inventories. Reviews of trade rules and origin compliance add another layer of operating complexity, underscoring the need for stronger classification discipline and more consistent execution of border processes. In the United States industrial manufacturing logistics market, providers that combine customs support, brokerage coordination, and dedicated cross-border capacity are better placed to capture this demand than operators that only sell point-to-point linehaul.
Automation-Led Productivity Gains In Warehousing And Material Handling
Automation is becoming a practical operating lever in the United States industrial manufacturing logistics market because many manufacturers and service providers need better throughput consistency without assuming that labor supply will scale in step with freight demand. The main commercial value comes from higher service reliability, faster error correction, and tighter inventory turns in facilities that handle complex industrial SKUs and frequent order changes. Robotic picking, automated storage, and digital slotting tools are increasingly useful when they connect directly with warehouse execution and transport planning systems rather than operating as stand-alone equipment layers. That system's link helps manufacturers run smaller buffers, shorten response times, and manage plant replenishment with more discipline across multi-node domestic networks. In the United States industrial manufacturing logistics market, technology-led differentiation matters more when providers can demonstrate that software, labor processes, and material-handling equipment work together under live contract conditions. This raises the commercial bar for operators that still depend mainly on manual throughput and generic warehouse labor models when competing for complex manufacturing accounts[2].
Growth Of Time-Sensitive And Temperature-Controlled Industrial Logistics
The United States industrial manufacturing logistics market is seeing broader demand for controlled logistics as manufacturers move more specialty chemicals, battery materials, and precision inputs that require tighter handling standards than standard industrial freight. The FDA extended compliance for the Food Traceability Rule to July 20, 2028, but the implementation cycle continues to shape system investments, process validation, and data discipline during 2026 and 2027[3]. This means controlled logistics demand is expanding before formal deadlines fully arrive, because manufacturers are already adjusting records, handoff standards, and monitoring practices across supplier and warehouse networks. In May 2026, Americold and EQT announced a USD 1.3 billion North American cold storage joint venture covering 12 facilities and around 124 million cubic feet, indicating that capital is moving toward dense networks rather than isolated cold assets. In the United States industrial manufacturing logistics market, this supports higher demand for validated storage, monitored transportation, and controlled transfer points located closer to production sites. Providers that can link cold chain execution with plant-adjacent packaging, compliance checks, and final shipment visibility are positioned to win more specialized contracts over the forecast period.
Restraints Impact Analysis*
| Restraint | (~) % Impact on CAGR Forecast | Geographic Relevance | Impact Timeline |
|---|---|---|---|
| Driver And Technician Shortages Across Warehousing And Transportation | -0.5% | National, most acute in Midwest industrial corridors and Southeast manufacturing expansion zones | Long term (≥ 4 years) |
| Freight Rate Volatility And Margin Compression In Contract Logistics | -0.4% | National, most pronounced in TL and LTL corridors across the Southeast and Texas | Short term (≤ 2 years) |
| Congestion And Capacity Constraints In Industrial Freight Corridors | -0.3% | Chicago (I-294/I-290 interchange), Atlanta (I-285), Houston (I-45) corridors most affected | Medium term (2-4 years) |
| Cybersecurity And Data Integration Risk In Digitized Logistics Networks | -0.2% | National, heightened in shared TMS/WMS platforms and cross-border EDI networks | Medium term (2-4 years) |
| Source: Mordor Intelligence | |||
Driver And Technician Shortages Across Warehousing And Transportation
Labor pressure remains a real constraint in the United States industrial manufacturing logistics market, as shortages are not limited to drivers but extend to warehouse operations, equipment maintenance, and technical support roles. This matters because fleet capacity is shaped not only by available tractors and trailers, but also by the number of qualified people who can keep equipment running, load freight correctly, and support schedule changes. Technician gaps can quietly reduce usable fleet capacity even when demand is present, which makes response times less predictable for manufacturers that depend on fixed production windows. Cross-border lanes face added stress when licensing, work eligibility, and documentation requirements narrow the available labor pool that once helped support border-adjacent trucking operations. That combination creates greater service risk in component flows, where missed pickups or delayed handoffs can quickly affect plant output and supplier sequencing. The United States industrial manufacturing logistics market, therefore, faces slower scaling in corridors where manufacturing investment is rising faster than the labor base that supports daily freight execution.
Freight Rate Volatility And Margin Compression In Contract Logistics
Freight rate instability is creating a two-sided squeeze in the United States industrial manufacturing logistics market, as both shippers and providers find that fixed contract assumptions can break down quickly during a rising rate cycle. The premium of contract truckload rates over spot rates narrowed from USD 0.39 per mile a year earlier to USD 0.11 per mile by March 2026, which materially reduced the planning cushion logistics managers had used to stabilize freight budgets[4]. When the contract-spot gap compresses that sharply, providers are more likely to discover that rates secured during bid season no longer match live operating costs on active lanes. Manufacturers then face mid-cycle contract friction, earlier renegotiation pressure, and less certainty around the real cost of moving time-sensitive industrial freight. This is pushing more agreements toward shorter review cycles and dynamic pricing clauses that can be reset more quickly when lane conditions change. In the United States industrial manufacturing logistics market, operators with better lane visibility, stronger procurement discipline, and faster repricing tools are better positioned to protect margins without losing strategic accounts.
*Our forecasts treat driver/restraint impacts as directional, not additive. The impact forecasts reflect baseline growth, mix effects, and variable interactions.
Segment Analysis
By Service: Transportation Backbone Sustains Market, Value-Added Tier Gains Ground
Transportation accounted for 62.50% of the United States industrial manufacturing logistics market in 2025, reflecting the heavy flow of parts, subassemblies, and finished goods across regional manufacturing networks that require repeated movements before final delivery. Road freight remains the largest transportation sub-segment because United States production clusters depend on short lead times, flexible routing, and frequent plant replenishment that are difficult to support at scale through slower modes alone. Rail still plays an important structural role, enabling manufacturers to use longer-haul and intermodal moves for more stable lane economics, especially on corridors that can tolerate slightly wider lead-time buffers without risking plant continuity. Air freight, sea, and inland waterways serve narrower but important functions, with air supporting urgent and high-value moves while water-linked freight remains relevant for chemicals, bulk metals, and heavy equipment flows that are less time-critical.
The value-added services segment is projected to grow at a 4.20% CAGR from 2026 to 2031, making it the fastest-moving service tier as manufacturers outsource more task-specific operations that sit between storage and transportation. Warehousing and storage remains the most capital-intensive service layer because modern building design, site proximity, compliance processes, and system integration increasingly shape contract value as much as floor space or simple pallet capacity. Manufacturers are using external providers for kitting, sequencing, vendor-managed inventory, labeling, and compliance documentation because these functions require trained labor and operating systems that are difficult to stand up quickly inside the plant organization. In the United States industrial manufacturing logistics industry, service providers that can connect plant-adjacent warehousing, controlled transportation, and execution support in one operating model are gaining an edge over firms that still sell each function separately.

By End-User Industry: Automotive's Scale Masks Structural Complexity, Electronics Accelerates
Automotive held 27.55% of the United States industrial manufacturing logistics market share in 2025, keeping it the largest end-user segment even as its operating needs become more difficult to manage across mixed-powertrain production systems. The challenge is not just volume, because original equipment manufacturers are now balancing electric vehicle, hybrid, and internal combustion schedules simultaneously, which raises the cost of sequencing errors and weakens the usefulness of older carrier-depth assumptions. EASE Logistics reported that daily automotive freight volumes grew 2.8 times year over year from March 2025 to March 2026, which shows how quickly surge conditions can test carrier responsiveness and planning accuracy. In the United States industrial manufacturing logistics market, automotive contracts reward providers that can manage inbound parts timing, short-term production changes, and outbound flow coordination with more discipline than standard industrial freight programs require.
The electronics and semiconductors segment is projected to advance at a 4.70% CAGR from 2026 to 2031, which makes it the fastest-growing end-user category as domestic chip and electronics investment adds more freight density around sensitive inputs and specialized equipment. Semiconductor-related production drives repeated movements for raw materials, cleanroom consumables, fabrication equipment, finished wafers, and downstream component shipments, which makes logistics demand more layered than a simple inbound and outbound model. Bosch began sample production at its first United States silicon carbide semiconductor plant in Roseville in July 2026, supported by a USD 225 million CHIPS Act agreement and a broader USD 2 billion site conversion program, which indicates the scale of industrial movement tied to new fabrication capacity. Machinery and equipment, chemicals and materials, and aerospace and defense remain stable contributors in the United States industrial manufacturing logistics industry because domestic production programs in those sectors continue to create recurring inbound parts demand and scheduled outbound shipment requirements.
By Logistics Model: Asset-Light Retains Scale Advantage, Hybrid Model Captures Growth Premium
Asset-light operators held 43.85% of the total United States industrial manufacturing logistics market size in 2025, reflecting the breadth of digital brokerage and carrier aggregation models that can source capacity across many lanes without relying on large, owned fleets. This model performs well when freight is relatively substitutable and when shippers value broad network access, lower fixed commitments, and the ability to flex across changing production schedules. Its commercial strength is highest in less specialized manufacturing flows where carrier replacement is easier and where contract execution depends more on lane coverage than on strict chain-of-custody or equipment-specific handling. The model becomes less resilient when capacity tightens, tender rejections rise, or priority manufacturing lanes require guaranteed service that cannot be secured consistently through a purely variable carrier base.
Hybrid logistics models are forecast to grow at a 5.10% CAGR from 2026 to 2031, reflecting a clear shift toward contracts that split fixed and flexible capacity by lane criticality. Manufacturers are using this structure to reserve dedicated resources on core inbound and outbound flows while still preserving brokerage access for demand surges, overflow volumes, and network expansion into new production geographies. Uber Freight reported that spot rates in the second half of 2026 were running 20% to 25% above 2025 levels, which strengthens the case for capacity models that combine assurance on critical lanes with flexibility on secondary freight. In the United States industrial manufacturing logistics market, hybrid providers are benefiting because they can match service-level commitments to lane importance rather than forcing shippers to choose between all-variable procurement and fully dedicated networks.
Geography Analysis
The Midwest held a 32.30% share in 2025, making it the largest regional concentration in the United States industrial manufacturing logistics market, as automotive, steel, advanced manufacturing, and semiconductor supply chains remain deeply embedded across its industrial corridor. The region benefits from dense supplier ecosystems and repeated plant-to-plant movement, which keeps freight demand broad across inbound components, intra-network transfers, and outbound finished goods. Large manufacturing projects in Ohio and surrounding states are extending this role by linking new production capacity with multi-year logistics ramp-ups that will continue to shape local transport and warehousing demand. The Chicago I-294 at I-290/I-88 interchange ranked as the top truck bottleneck in the country in 2026, with average rush-hour truck speeds of 33.1 mph, which shows how congestion can directly affect schedule reliability in the region. That constraint increases the value of predictive routing, site proximity, and deeper local carrier networks for contracts tied to Midwest manufacturing output.
The Southeast is projected to grow at a 4.48% CAGR from 2026 to 2031, which makes it the fastest-growing region in the United States industrial manufacturing logistics market as port-linked freight and inland production investment increasingly reinforce each other. Growth is being supported by a combination of coastal gateway access, manufacturing expansion across the auto belt, and continued demand for large-format logistics facilities that can serve multi-state distribution patterns. C.H. Robinson described the Southeast in mid-2026 as tight and sensitive to short-term demand spikes, particularly in Georgia, where produce movements and nearshoring-related inbound freight were raising outbound pricing pressure. This keeps the region attractive for operators that can combine port access, inland warehousing, and flexible truck procurement without losing service discipline during short-lived capacity swings.
The Northeast remains a high-value corridor in the United States industrial manufacturing logistics market because it combines East Coast port connectivity with concentrated manufacturing and pharmaceutical activity across several dense freight states. The I-95 at SR 4 interchange in Fort Lee, New Jersey ranked as the second-most congested truck bottleneck nationally in 2026, which adds time risk to outbound flows linked to the largest port complex on the East Coast. The Southwest draws strength from cross-border trade intensity through Laredo, Texas, which processed USD 344.6 billion in truck freight in 2025, while the West continues to support semiconductor, aerospace, and technology-linked industrial movement. Across these regions, logistics capacity is still following manufacturing investment with a lag, which creates openings for providers that placed assets and operating teams early in reshoring-oriented corridors.
Competitive Landscape
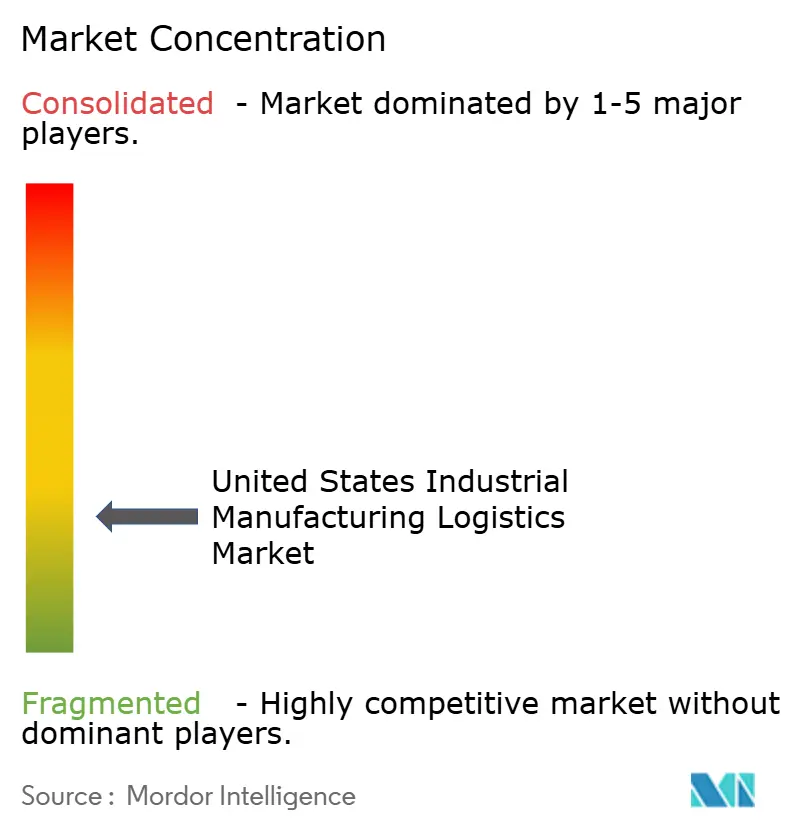
The United States industrial manufacturing logistics market is fragmented. The larger firms compete on corridor coverage, platform depth, and the ability to connect transportation, warehousing, and value-added execution within a single commercial relationship rather than selling isolated services. The competitive bar is rising because manufacturing customers increasingly want visibility, compliance support, and more predictable service handoffs across multi-node domestic and cross-border networks. DSV completed its acquisition of DB Schenker in April 2025 for approximately USD 15.8 billion. That transaction increased pressure on rivals that lack comparable procurement scale, international reach, or the capacity to support complex multinational manufacturing programs.
The United States industrial manufacturing logistics market still has clear room in secure freight, compliance-heavy handling, and integrated cross-border services where generalist capacity alone is not enough to win and retain premium industrial business. C.H. Robinson acquired DeSpir Logistics in July 2026 for approximately USD 75 million in cash, adding secure transportation and cargo escort capabilities across healthcare, aerospace, life sciences, and high-value retail verticals. The move shows that specialized freight niches are important enough to justify targeted acquisitions rather than slower internal capability development. Providers that can combine customs execution, traceability, secure handling, and dedicated corridor capacity are building stronger switching costs with manufacturing shippers that run high-consequence supply chains.
Cold chain density and automation are also influencing relative positioning in the United States industrial manufacturing logistics market because network design and operating systems are becoming harder to separate from core logistics service quality. Americold formed a USD 1.3 billion North American cold storage joint venture with EQT in May 2026 that covered 12 facilities and around 124 million cubic feet, which signaled a network-scale investment approach rather than isolated asset growth. Lineage announced plans in 2025 to invest approximately USD 1 billion in 2 automated cold storage warehouses with Tyson Foods as the anchor customer, adding more than 80 million cubic feet and nearly 260,000 pallet positions through its LinOS platform. As investment keeps shifting toward specialized infrastructure and integrated execution tools, providers with those capabilities are better placed to defend service levels and pricing than operators competing mainly on general freight coverage.
United States Industrial Manufacturing Logistics Industry Leaders
-
C.H. Robinson Worldwide, Inc.
-
XPO, Inc.
-
United Parcel Service, Inc.
-
DHL Group
-
Ryder System, Inc.
- *Disclaimer: Major Players sorted in no particular order
Recent Industry Developments
- July 2026: C.H. Robinson acquired DeSpir Logistics for approximately USD 75.00 million in cash, adding specialized secure transportation and cargo escort capabilities across the healthcare, aerospace, life sciences, and high-value retail verticals. The deal is expected to be slightly accretive in 2026 and follows C.H. Robinson’s Q4 2025 acquisition of Breaker19, an oilfield logistics specialist, underscoring its multi-stage push into premium freight segments.
- July 2026: Ryder System pre-leased the entire 400,000 ft² Kurv Gratigny warehouse near Miami's Opa-locka Executive Airport. The deal is the largest known new industrial transaction in Miami-Dade County in 2026 to date, reflecting the company's geographic expansion into a key Southeast distribution hub amid growing logistics demand in the region.
- April 2025: DSV completed its acquisition of DB Schenker from Deutsche Bahn for approximately USD 15.80 billion. The deal doubled DSV's size, establishing a combined logistics revenue base across more than 90 countries with a workforce of approximately 160,000 employees.
- April 2025: Lineage announced plans to deploy approximately USD 1 billion in capital for two fully automated cold-storage warehouses, with Tyson Foods as the anchor customer. The facilities will add more than 80 million ft³ and nearly 260,000 pallet positions to its network, operating on LinOS, its proprietary warehouse execution platform.
United States Industrial Manufacturing Logistics Market Report Scope
| Transportation | Road |
| Rail | |
| Air | |
| Sea and Inland Waterways | |
| Warehousing and Storage | |
| Value-added Services |
| Automotive |
| Electronics and Semiconductors |
| Machinery and Equipment |
| Chemicals and Materials |
| Aerospace and defense |
| Other End-User Industries |
| Asset-Light |
| Asset-Heavy |
| Hybrid |
| Northeast |
| Southwest |
| West |
| Southeast |
| Midwest |
| By Service | Transportation | Road |
| Rail | ||
| Air | ||
| Sea and Inland Waterways | ||
| Warehousing and Storage | ||
| Value-added Services | ||
| By End-User Industry | Automotive | |
| Electronics and Semiconductors | ||
| Machinery and Equipment | ||
| Chemicals and Materials | ||
| Aerospace and defense | ||
| Other End-User Industries | ||
| By Logistics Model | Asset-Light | |
| Asset-Heavy | ||
| Hybrid | ||
| By Geography | Northeast | |
| Southwest | ||
| West | ||
| Southeast | ||
| Midwest |
Key Questions Answered in the Report
What is the current size of United States industrial manufacturing logistics?
It stands at USD 415.15 billion in 2026 and is forecast to reach USD 494.65 billion by 2031 at a 3.57% CAGR.
Which service category leads logistics spending for industrial manufacturers in the United States?
Transportation is the largest service category, with 62.50% share in 2025, reflecting the heavy movement of parts, sub-assemblies, and finished goods across production networks.
Which end-user segment is growing fastest in this space?
Electronics and semiconductors is the fastest-growing end-user segment, with a projected 4.70% CAGR from 2026 to 2031.
Why is cross-border trade with Mexico so important for logistics providers?
United States-Mexico freight reached USD 872.8 billion in 2025, and trucks carried 73.6% of that value, making border execution and corridor capacity central to service quality.
Which United States region offers the strongest growth outlook through 2031?
The Southeast has the strongest regional growth outlook, with a projected 4.48% CAGR, supported by port access, inland manufacturing growth, and tight freight conditions.
What kind of providers are best positioned to win new contracts?
Providers with cross-border capability, specialized handling, network density, and the ability to bundle transport, warehousing, and value-added execution are in the strongest position.