United States Green Logistics Market Size and Share
Market Overview
| Study Period | 2020 - 2031 |
|---|---|
| Forecast Data Period | 2026 - 2031 |
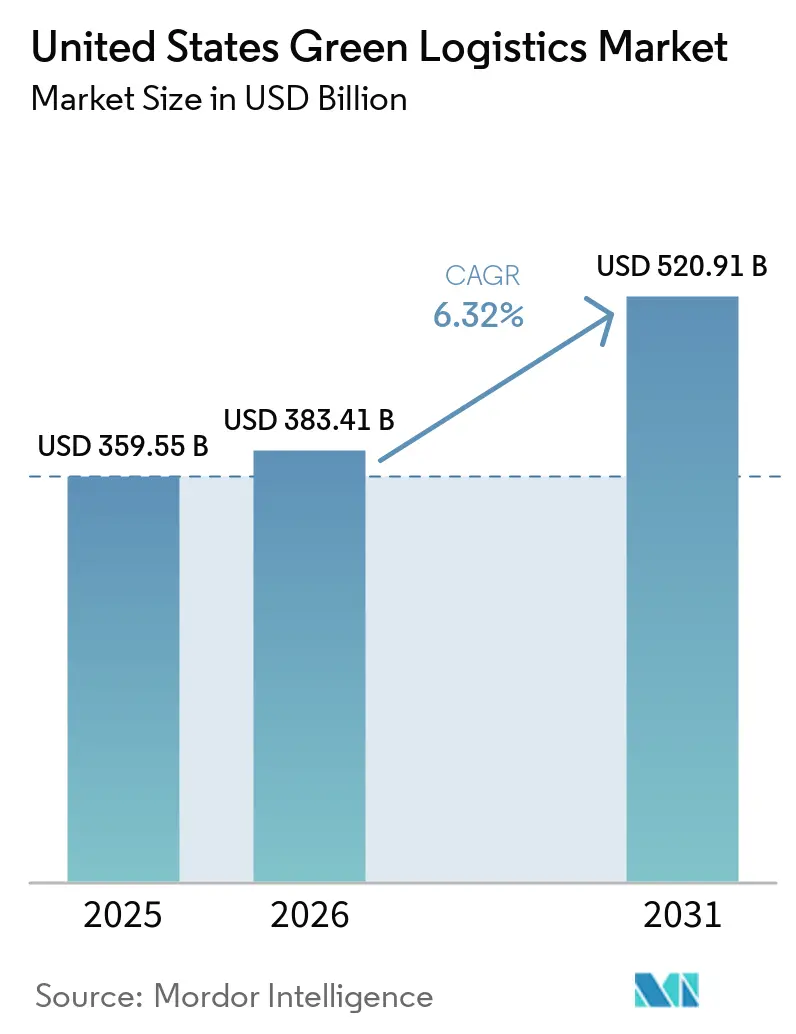
| Base Year Market Size (2025) | USD 359.55 Billion |
| Market Size (2026) | USD 383.41 Billion |
| Market Size (2031) | USD 520.91 Billion |
| Growth Rate (2026 - 2031) | 6.32% CAGR |
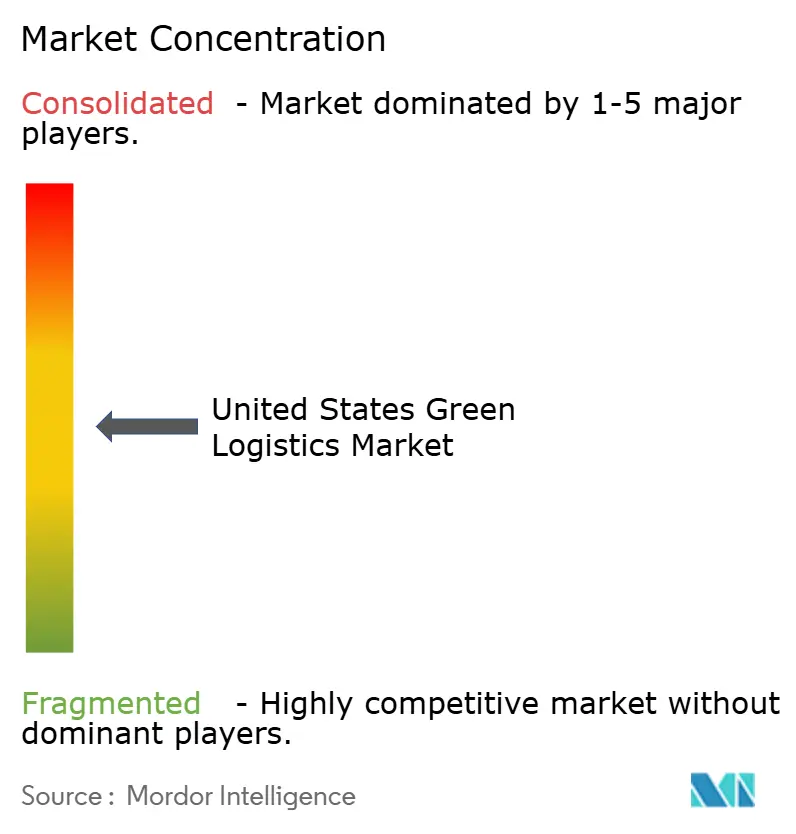
| Market Concentration | Medium |
Major Players *Disclaimer: Major Players sorted in no particular order Image © Mordor Intelligence. Reuse requires attribution under CC BY 4.0. | |
United States Green Logistics Market Analysis by Mordor Intelligence
The United States green logistics market size was valued at USD 359.55 billion in 2025 and estimated to grow from USD 383.41 billion in 2026 to reach USD 520.91 billion by 2031, at a CAGR of 6.32% during the forecast period (2026-2031).
Growth in the United States green logistics market is being supported by large shippers that now treat transport decarbonization as a purchasing requirement, not only a reporting exercise, which is changing carrier selection and contract design across freight networks. The market is also benefiting from wider development of charging corridors, more commercial truck charging sites, and stronger depot electrification activity around freight-heavy ports and warehouse clusters. Another force behind the market is the use of AI-led routing, load matching, and shipment consolidation, which is helping operators reduce empty miles, improve service quality, and document emissions performance with more precision. At the same time, the market is being shaped by a split policy environment, as state-led zero-emission rules remain strict even as federal standards face review, pushing national carriers to plan for the toughest operating jurisdictions. The United States green logistics market still faces a slower transition among small fleets because the private cost gap between battery-electric and diesel trucks remains material, keeping financing, leasing, and multi-fuel operating models central to adoption.
Key Report Takeaways
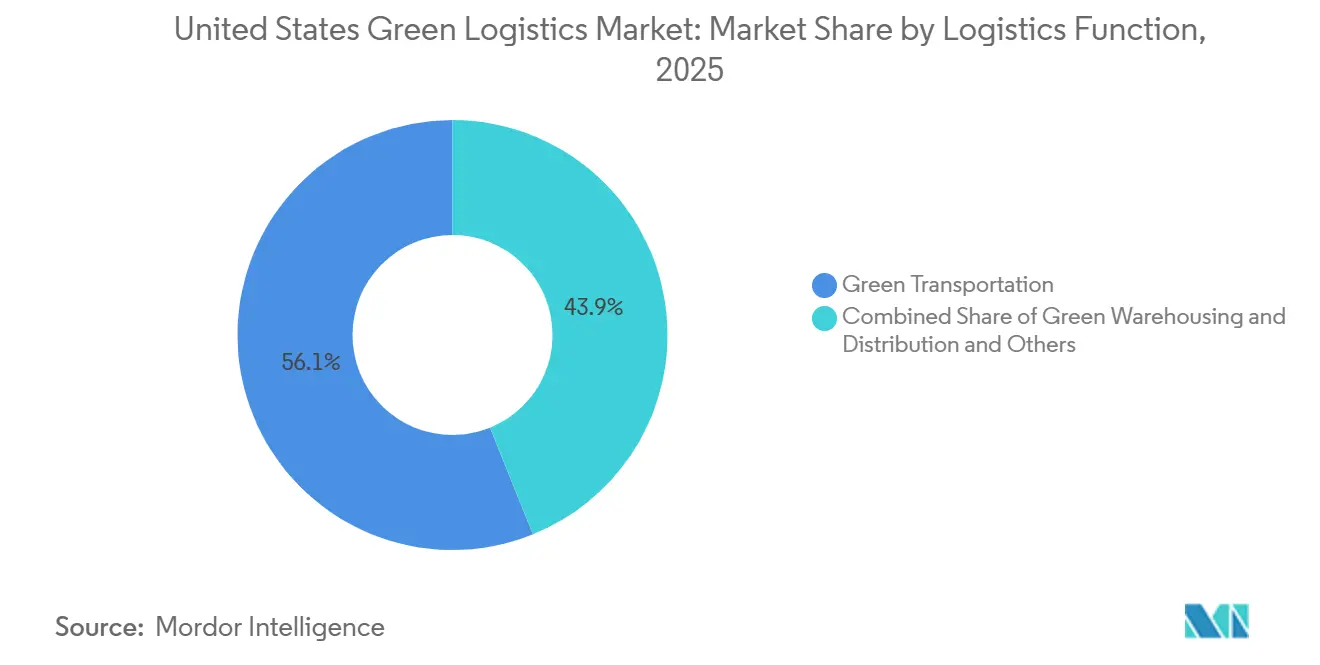
- By logistics function, green transportation accounted for 56.11% of the United States green logistics market size in 2025, while green value-added services and others are forecast to expand at a 10.91% CAGR through 2031.
- By fuel and energy type, electric-powered logistics held 52.76% of the United States green logistics market share in 2025, while hydrogen-powered logistics is projected to grow at a 13.27% CAGR through 2031.
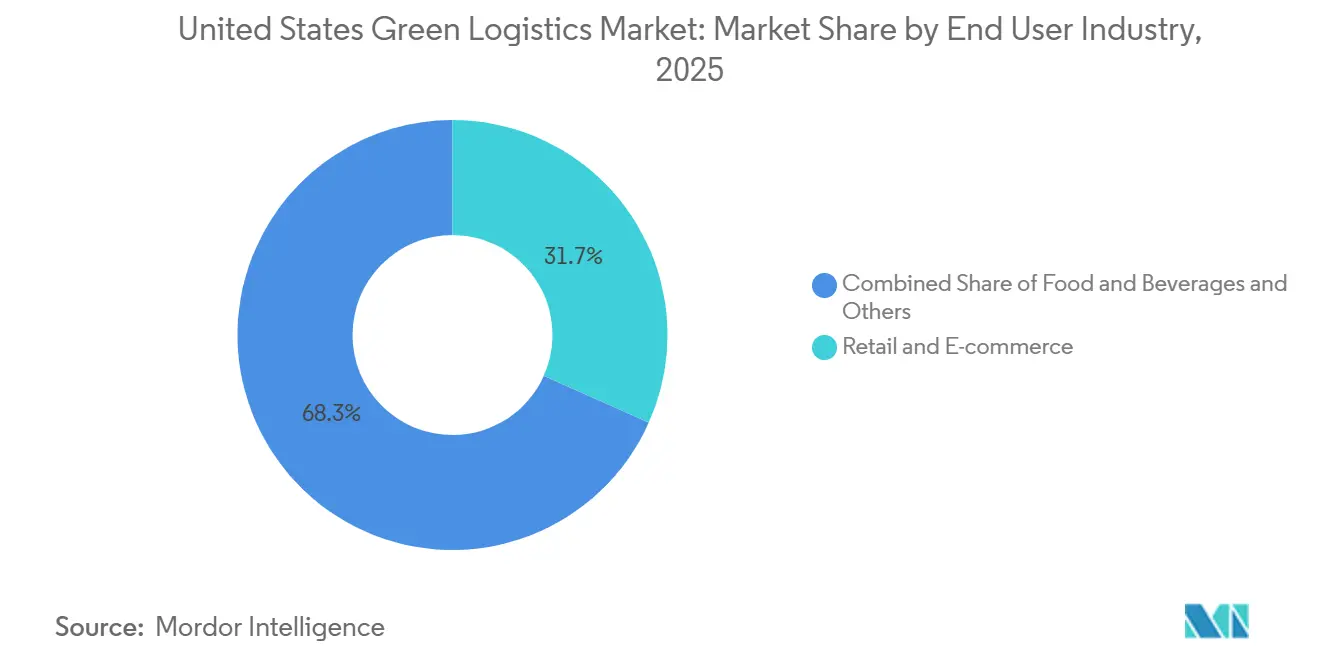
- By end-user industry, retail and e-commerce held 31.68% of the United States green logistics market share in 2025, while chemicals and hazardous materials are forecast to record the highest CAGR of 11.74% through 2031.
- By region, the West captured 27.24% of the United States green logistics market size in 2025, while the Southeast is projected to advance at an 8.61% CAGR through 2031.
Note: Market size and forecast figures in this report are generated using Mordor Intelligence’s proprietary estimation framework, updated with the latest available data and insights as of January 2026.
United States Green Logistics Market Trends and Insights
Drivers Impact Analysis*
| Driver | (~) % Impact on CAGR Forecast | Geographic Relevance | Impact Timeline |
|---|---|---|---|
| Rising shipper decarbonization procurement | +1.4% | Global demand is concentrated in the United States Northeast, West, and Midwest industrial corridors. | Medium term (2-4 years) |
| EPA and state zero-emission compliance pressure | +1.0% | West, especially California, and the Northeast ACT coalition, with national spillover | Short term (≤ 2 years) |
| EV charging and corridor infrastructure buildout | +0.9% | West and Southeast port corridors, and I-10, I-35, and I-5 freight lanes | Medium term (2-4 years) |
| AI-based routing and load consolidation gains | +0.8% | National, with early gains in dense Northeast and Midwest freight networks | Short term (≤ 2 years) |
| Electrified port and warehouse equipment adoption | +0.7% | West, especially Los Angeles, Long Beach, and Oakland, and Southeast ports such as Savannah and Houston | Medium term (2-4 years) |
| Emissions reporting and auditability demand | +0.6% | Global, with stronger pressure on public United States shippers and EU-exposed exporters | Long term (≥ 4 years) |
| Source: Mordor Intelligence | |||
Rising Shipper Decarbonization Procurement
Corporate buying teams are no longer treating low-emission transport as an optional service layer. That change is altering how freight lanes are awarded in the United States green logistics market. Procurement-led network redesign now carries a direct emissions target, which is why carrier scorecards increasingly ask for verified transport emissions data and credible reduction pathways. RMI documented that procurement-led supply chain redesign can yield 30% to 60% reductions in Scope 3 transportation when built into carrier selection and network planning[1]Source: Rocky Mountain Institute, “Accelerating Supply Chain Decarbonization,” RMI, rmi.org. That shift is already visible in large-scale buying models, including the January 2026 Green Market Activation trucking procurement, which brought Amazon, eBay, and Meta together to support Nevoya’s 40-truck all-electric Houston-to-Dallas corridor. The practical effect is that larger carriers with digital reporting tools are winning better access to premium contracts, while smaller fleets risk being pushed out of high-value routing guides. This is one of the clearest reasons the United States green logistics market is moving beyond equipment replacement and toward service differentiation based on measurable emissions performance.
EPA And State Zero-Emission Compliance Pressure
Compliance pressure in the United States green logistics market is coming from two policy directions at the same time, forcing fleets to plan more carefully by route and state. In 2026, the EPA proposed delaying Biden-era vehicle standards, saying they could save USD 1.7 billion in compliance costs, which would normally soften transition pressure at the federal level. Yet state-level electrification rules remain firm, especially in California and other ACT coalition states, and continue to shape vehicle purchasing decisions for carriers that cross multiple regions. The policy split creates a real operational divide between fleets that can localize compliance by geography and those that need a single, broader national standard across their asset base. In practice, carriers serving ports, dense retail corridors, and regulated urban markets still have to size investments to the strictest rulebook rather than the loosest one. That reality continues to support the United States green logistics market even when the federal direction looks less certain.
EV Charging And Corridor Infrastructure Buildout
Charging buildout in the United States green logistics market is moving beyond depot-only models and toward connected freight corridors that support regional and longer-haul truck movement. CALSTART’s medium- and heavy-duty zero-emission infrastructure map listed around 162 facilities across 17 states by May 2026, with 64 new sites added and around 1,500 charging plugs and 32 hydrogen nozzles available for commercial trucks. That growth matters because it lowers route risk for fleets that previously could electrify only fixed local loops. The West is advancing quickly through port-linked projects, while warehouse clusters are also building more shared charging capacity, including the Vernon Hub facility opened by LACI and Prologis along the I-710 corridor in June 2026. Corridor economics are also improving, as a 2025 peer-reviewed study found that long-haul battery-electric trucks produced 64% to 69% lower external climate and health costs than diesel trucks. As a result, infrastructure investment is doing more than supporting adoption; it is expanding the set of lanes where zero-emission logistics can operate with commercial credibility.
AI-Based Routing And Load Consolidation Gains
The United States green logistics market is also benefiting from software-led efficiency, as better planning tools reduce costs and emissions simultaneously. C.H. Robinson said its Lean AI deployment improved on-time pickups by an average of 7%, and one early user reduced shipment loads by 81% across three delivery consolidations, thereby lowering costs by 40%. Penske and Bridgestone reported in April 2026 that data-driven route planning in their Decarbonization Lab showed an estimated 4% to 6% reduction in CO₂ across a scaled fleet. These results matter because every empty mile removed improves truck utilization, lowers fuel use, and strengthens the carrier’s operating margin in one step. That compounding benefit is giving AI-capable operators a stronger commercial case than fleets that still depend on manual planning and fragmented dispatch data. In the United States, the green logistics market means digital capability is now part of the decarbonization story, not a separate productivity theme.
Restraints Impact Analysis*
| Restraint | (~) % Impact on CAGR Forecast | Geographic Relevance | Impact Timeline |
|---|---|---|---|
| High upfront cost of fleet and facility transition | -1.2% | National, with stronger pressure on small and mid-size carriers in the Midwest and Southeast | Medium term (2-4 years) |
| Grid capacity and interoperability bottlenecks | -0.8% | Logistics-intensive Midwest, Southern California drayage corridors, and Northeast urban depots | Medium term (2-4 years) |
| Residual diesel asset lock-in and depreciation risk | -0.6% | National, concentrated among asset-heavy truckload carriers and LTL operators. | Long term (≥ 4 years) |
| Shortage of skilled green logistics operators | -0.4% | National, with higher pressure in the West and Southeast, where zero-emission deployment is faster | Long term (≥ 4 years) |
| Source: Mordor Intelligence | |||
High Upfront Cost Of Fleet And Facility Transition
The largest brake on the United States green logistics market remains the cost of replacing diesel fleets and upgrading sites to support new powertrains. A 2025 Nature Communications study found that battery-electric heavy-duty vehicles had 46% higher private costs in 2025 at USD 0.71 per mile compared with diesel, with the gap narrowing to 33% by 2035 as battery economics improve. That cost burden is heavier for smaller carriers because they lack the same bargaining power, financing options, or route density as large integrated networks. The result is a two-speed transition, where larger fleets can spread capital costs across more lanes while smaller operators postpone investment and remain tied to existing diesel assets. Penske’s 2026 market brief still pointed to multi-powertrain resilience rather than a single straight path to full electrification, which shows how operators are managing cost risk in real time. Until financing structures, incentives, and residual value assumptions improve further, adoption across the United States green logistics market will remain uneven.
Grid Capacity And Interoperability Bottlenecks
Grid readiness is another major constraint on the United States' green logistics market, as infrastructure deployment often outpaces utility and permitting systems' ability to respond. RMI noted in 2026 that charger installation and vehicle procurement can move much faster than grid assessment and interconnection work, which creates a mismatch for fleets trying to electrify depots on schedule. This makes project timing less predictable and can force operators to delay transitions or spend more on on-site storage and backup power. The issue is especially visible in freight-heavy regions, where depots need high-capacity charging while local grids already support intensive industrial loads. Hydrogen can bypass some of those limits when production is co-located, and Hyroad Energy’s fueling site in Katy, Texas, shows how that model can work near freight corridors. Even so, the scale-up challenge remains significant because each site still needs localized capital, technical coordination, and dependable freight demand[2]Source: Clean Trucking, “Hyroad Energy Expands Hydrogen Trucking in Texas,” Clean Trucking, cleantrucking.com .
*Our forecasts treat driver/restraint impacts as directional, not additive. The impact forecasts reflect baseline growth, mix effects, and variable interactions.
Segment Analysis
By Logistics Function: Green Value-Added Services Gaining Share as Data-Driven Logistics Matures
Green transportation led this segment, accounting for 56.11% of the United States green logistics market share in 2025, making it the largest functional block. Road transport remains the main sub-mode within that category, because fleet electrification is spreading first through last-mile, regional distribution, and other shorter-route applications where asset scheduling is easier to control. The segment also benefits from the fact that transport is the most visible source of freight emissions for shippers, so it is often the first area targeted by procurement teams and compliance programs. Rail still plays a meaningful role, especially when customers want a lower-emission option that does not require immediate truck replacement.
The fastest-growing function is green value-added services and others, which is projected to rise at a 10.91% CAGR through 2031 and reflects how sustainability is becoming a sellable service within the United States green logistics industry. Demand in this segment is being driven by emissions measurement, reverse logistics, support for sustainable packaging, and auditable insetting products that can be attached to physical freight movements. This part of the United States green logistics market is growing faster because shippers increasingly want proof, documentation, and reporting discipline alongside transport capacity, not after the shipment is complete.


By Fuel/Energy Type: Hydrogen's Commercial Viability Edges Closer as Infrastructure Co-Locates with Freight Demand
Electric-powered logistics accounted for 52.76% of the United States green logistics market size in 2025, positioning it at the center of the fuel transition. Its lead reflects the early scale of battery-electric deployment in delivery, drayage, and regional routes, where charging patterns are more predictable, and utilization can be managed around depot dwell time. National zero-emission commercial vehicle deployment also continued to build, reinforcing electric logistics as the most established clean-power category in current operations. Biofuel-based logistics still plays a solid transitional role, as fleets can lower emissions without replacing the entire vehicle fleet or waiting for large charging upgrades. Werner Enterprises said in 2025 that most of its diesel purchases already included a biodiesel blend, underscoring why biofuels remain relevant in lanes with slower capital turnover.
Hydrogen-powered logistics is forecast to expand at a 13.27% CAGR through 2031, making it the fastest-growing segment of the United States green logistics market. Its progress is tied less to open network refueling today and more to locations where hydrogen production, truck use, and industrial demand sit close together. Hyundai’s HTWO logistics activity around its Metaplant America operation in Savannah illustrates that model, because a captive industrial ecosystem can support hydrogen truck use earlier than a broad public corridor can. The others category, which includes renewable natural gas and hybrid configurations, is losing relative weight as electric and hydrogen options gain stronger commercial proof points. Penske’s 2026 market brief also noted that fleets using a portfolio of powertrains show greater total cost resilience, which explains why many carriers are still keeping more than one fuel pathway active rather than backing a single solution.
By End-User Industry: Chemicals and Hazardous Materials Emerge as an Unlikely Green Logistics Growth Front
Retail and e-commerce accounted for 31.68% of the United States green logistics market share in 2025, making it the largest end-user segment. This position reflects the buying power of large retailers and platforms that can shape carrier behavior through contract design, lane selection, and strict service-level requirements. The segment also sets the pace for last-mile and middle-mile electrification, because order density and route repetition support faster adoption of cleaner vehicles and digital planning tools. Manufacturing and industrial ranked second, helped by nearshoring-linked activity across domestic production corridors that increasingly need lower-emission transport solutions. This keeps the United States green logistics market closely tied to broader decisions on sourcing, inventory placement, and plant expansion.
Chemicals and hazardous materials are projected to post the fastest CAGR of 11.74% through 2031, a notable growth point for the United States green logistics industry. The segment is benefiting from stricter transport handling requirements and from the operational fit of zero-emission vehicles in controlled, shorter-route hazardous movements where range pressure is lower. Healthcare and pharmaceuticals are also benefiting from tighter cold-chain quality expectations, which are driving investment toward more efficient, better-documented logistics systems.
Geography Analysis
The West held a 27.24% share in 2025, making it the largest regional block in the United States' green logistics market. California remains the anchor of that position because its fleet rules, drayage requirements, and dense freight economy create the strongest policy and operational push for cleaner logistics. The region also has a stronger infrastructure base than most other parts of the country, with more charging and refueling sites already mapped for medium- and heavy-duty commercial use. Port-adjacent and warehouse-adjacent charging investments are adding another layer of support, including the Vernon Hub project, opened by LACI and Prologis in June 2026, along a core freight corridor[3]Source: Los Angeles Cleantech Incubator, “LACI Partners With Prologis,” LACI, laincubator.org. The Southwest stays closely tied to the West because Texas and cross-border freight corridors are becoming part of the same green logistics buildout, especially where hydrogen fueling can be tied to major freight demand nodes.
The Southeast is forecast to grow at an 8.61% CAGR through 2031, making it the fastest-growing region in the United States green logistics market share outlook. Growth there is being supported by port diversification, expanding automotive production, and more captive freight demand around large industrial campuses. Hyundai’s Savannah-area operation is important because it demonstrates how hydrogen-powered logistics can be directly linked to plant-level freight needs, rather than waiting for a broader public network. The Northeast also remains significant because it combines dense freight demand with stronger climate disclosure and pressure for zero-emission policies than many inland regions.
The Midwest occupies a different position in the United States green logistics market because its industrial freight base is large, but utility and grid constraints can slow electrification timelines. Even with that challenge, the region still supports green logistics demand through intermodal and rail-linked pathways that can cut emissions without full truck fleet replacement. Norfolk Southern’s RailGreen initiative is relevant here because Midwest freight nodes such as Chicago remain central to national rail flows and can offer a lower-emission alternative for shippers seeking verified reductions. Taken together, regional performance shows that the United States green logistics market is not expanding through a single uniform model, because each geography is moving according to its mix of regulations, infrastructure, and shipper concentration.
Competitive Landscape
The United States green logistics market is moderately fragmented, with global integrators, asset-based carriers, and third-party providers competing through a mix of physical assets, digital tools, and reporting capability. Large operators such as UPS, FedEx, DHL Group, and Amazon Freight have an advantage because they can fund fleet upgrades, absorb pilot risk, and build customer-facing systems that document emissions in more detail. In 2026, UPS expanded RFID deployment across its United States network, aiming for more than 100 million sensor implementations, demonstrating how visibility investments are improving both operations and shipment-level data quality. Schneider National also crossed 10 million zero-emission miles with its Freightliner eCascadia fleet in February 2026, providing a clear proof point in execution rather than just targets[4]Source: Schneider National, “Schneider Marks Major Gains in Fuel Efficiency and Zero Emission Progress,” Business Wire, businesswire.com. These moves matter because they set a higher standard for what major customers now expect from carriers serving the United States green logistics market.
Another area of competition in the United States green logistics market is the software and data layer that sits on top of transport and warehousing services. GXO launched GXO IQ in 2025 as an AI-first platform for logistics operations, reflecting how warehouse productivity, planning, and real-time orchestration are becoming part of the green logistics offer. C.H. Robinson’s Always On Logistics Planner and Lean AI program point in the same direction because they combine cost reduction, service improvement, and emissions efficiency within a single operating model. This creates a gap in the middle of the market, where many smaller carriers still lack the reporting tools and optimization systems that larger shippers increasingly expect.
Partnership-based decarbonization is emerging as a third competitive model in the United States' green logistics market. DSV’s April 2026 collaboration with Microsoft, United Airlines, and Phillips 66 to unlock around 11 million gallons of sustainable aviation fuel shows how logistics companies are using joint procurement to scale lower-emission options that would be harder to buy alone. C.H. Robinson’s participation in RailGreen demonstrates a similar approach in rail, where verified low-carbon fuel investments can be translated into customer-facing emissions-reduction value. As standards, disclosure, and customer scrutiny continue to rise, the United States green logistics market is likely to keep rewarding carriers that can combine credible operating change with clear documentation and scalable partner networks.
United States Green Logistics Industry Leaders
UPS
FedEx
DHL
XPO, Inc.
GXO Logistics, Inc.
- *Disclaimer: Major Players sorted in no particular order

Recent Industry Developments
- April 2026: DSV, in collaboration with Microsoft, United Airlines, and Phillips 66, unlocked around 11 million gallons of sustainable aviation fuel, expected to reduce lifecycle greenhouse gas emissions by around 100,000 tons compared to conventional jet fuel. The multi-party structure demonstrates how logistics integrators, airlines, and fuel producers can coordinate to scale sustainable aviation fuel beyond what any single buyer could achieve.
- April 2026: Amazon Freight partnered with Swedish EV trucking firm Einride to deploy 75 battery-electric heavy-duty trucks in Amazon's Relay middle-mile network across 5 United States locations, projected to enable up to 3 million electric freight miles annually. The partnership marks Amazon's extension of electrification from last-mile delivery vans into Class 8 middle-mile operations.
- January 2026: FedEx expanded its use of blended sustainable aviation fuel to Dallas-Fort Worth and New York JFK. This marks the company's fifth major US airport deployment for 2025. Secured agreements provide the equivalent of 5 million gallons of neat SAF, supporting lower-carbon air freight operations nationwide.
- January 2026: CMA CGM and United States infrastructure investor Stonepeak announced the formation of United Ports LLC, a joint venture in which Stonepeak invests USD 2.4 billion for a 25% minority stake.


United States Green Logistics Market Report Scope
| Green Transportation | Road |
| Air | |
| Sea and Inland Waterways | |
| Rail | |
| Green Warehousing & Distribution | |
| Green Value-added Services and Others |
| Electric-Powered Logistics |
| Biofuel-Based Logistics |
| Hydrogen-Powered Logistics |
| Others |
| Retail & E-commerce |
| Manufacturing & Industrial |
| Automotive |
| Healthcare & Pharmaceuticals |
| Food & Beverages |
| Chemicals & Hazardous Materials |
| Others |
| Northeast |
| Southeast |
| Midwest |
| Southwest |
| West |
| By Logistics Function | Green Transportation | Road |
| Air | ||
| Sea and Inland Waterways | ||
| Rail | ||
| Green Warehousing & Distribution | ||
| Green Value-added Services and Others | ||
| By Fuel / Energy Type | Electric-Powered Logistics | |
| Biofuel-Based Logistics | ||
| Hydrogen-Powered Logistics | ||
| Others | ||
| By End-user Industry | Retail & E-commerce | |
| Manufacturing & Industrial | ||
| Automotive | ||
| Healthcare & Pharmaceuticals | ||
| Food & Beverages | ||
| Chemicals & Hazardous Materials | ||
| Others | ||
| By Region | Northeast | |
| Southeast | ||
| Midwest | ||
| Southwest | ||
| West |


Key Questions Answered in the Report
What is the 2031 outlook for green logistics revenue in the United States?
The United States green logistics market is expected to reach USD 520.91 billion by 2031, rising from USD 383.41 billion in 2026 at a 6.32% CAGR.
Which logistics function is the largest today?
Green transportation led with 56.11% share in 2025, making it the core revenue base across current operations.
Which fuel type is growing the fastest in freight decarbonization?
Hydrogen-powered logistics is projected to grow the fastest, with a 13.27% CAGR through 2031, even though electric-powered logistics remains the largest segment today.
Which customer sectors are driving the most demand?
Retail and e-commerce held the largest share at 31.68% in 2025, while chemicals and hazardous materials are forecast to expand the fastest at 11.74% CAGR.
Which United States region is leading the transition?
The West led with a 27.24% share in 2025 due to stronger state rules, port-linked electrification, and a denser charging footprint.
Why are software and reporting tools becoming more important in freight?
AI-led planning, route consolidation, and emissions documentation now affect both costs and contract eligibility, which is why companies such as C.H. Robinson, GXO, and UPS are investing heavily in digital platforms.
Page last updated on:


