United States Global Capability Centers Market Size and Share
Market Overview
| Study Period | 2020 - 2031 |
|---|---|
| Forecast Data Period | 2026 - 2031 |
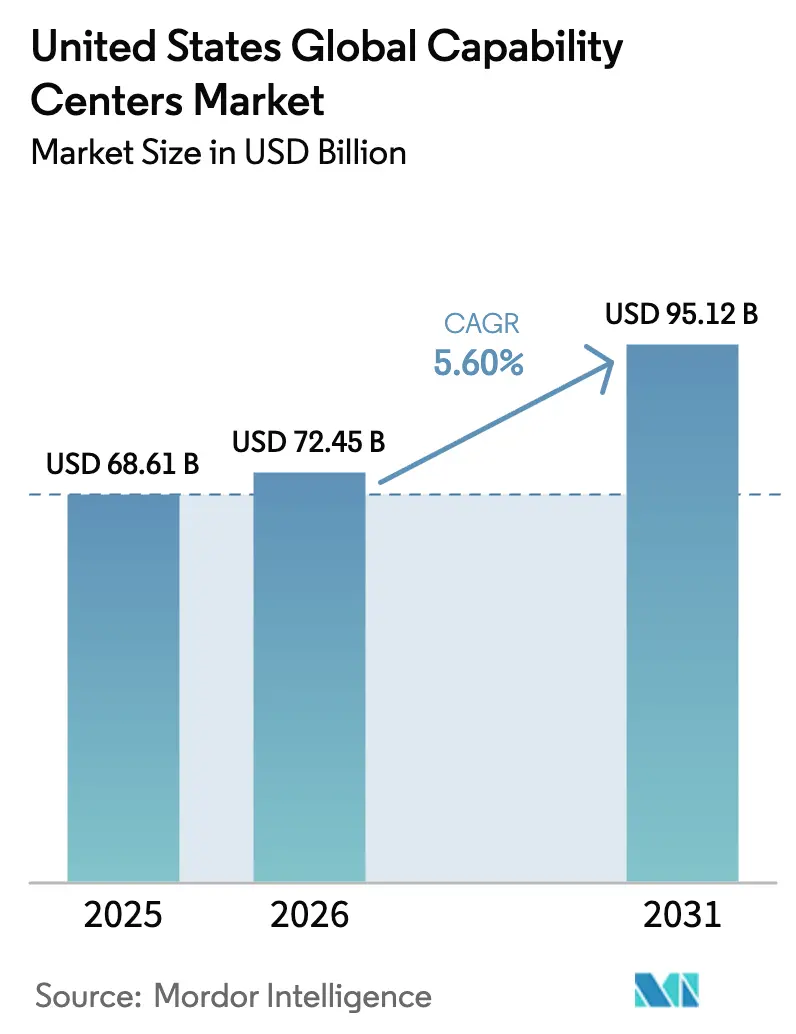
| Base Year Market Size (2025) | USD 68.61 Billion |
| Market Size (2026) | USD 72.45 Billion |
| Market Size (2031) | USD 95.12 Billion |
| Growth Rate (2026 - 2031) | 5.60% CAGR |
| Market Concentration | Medium |
Major Players *Disclaimer: Major Players sorted in no particular order Image © Mordor Intelligence. Reuse requires attribution under CC BY 4.0. | |
United States Global Capability Centers Market Analysis by Mordor Intelligence
The United States Global Capability Centers Market size was valued at USD 68.61 billion in 2025 and estimated to grow from USD 72.45 billion in 2026 to reach USD 95.12 billion by 2031, at a CAGR of 5.60% during the forecast period (2026-2031). Escalating digital-first strategies, heightened data-sovereignty rules, and supply-chain resiliency mandates are prompting companies to build domestic hubs that move beyond legacy cost-arbitrage plays. Enterprise demand for cloud modernization, AI-enabled engineering, and rapid product iteration keeps information-technology GCCs in the spotlight, while state incentive programs lower entry barriers for new locations. Talent shortages remain an ever-present catalyst, compelling firms to create on-shore centers that serve as magnets for niche skills. Together, these forces sustain robust momentum for the United States' global capability centers market, despite persistent cost pressures.
Key Report Takeaways
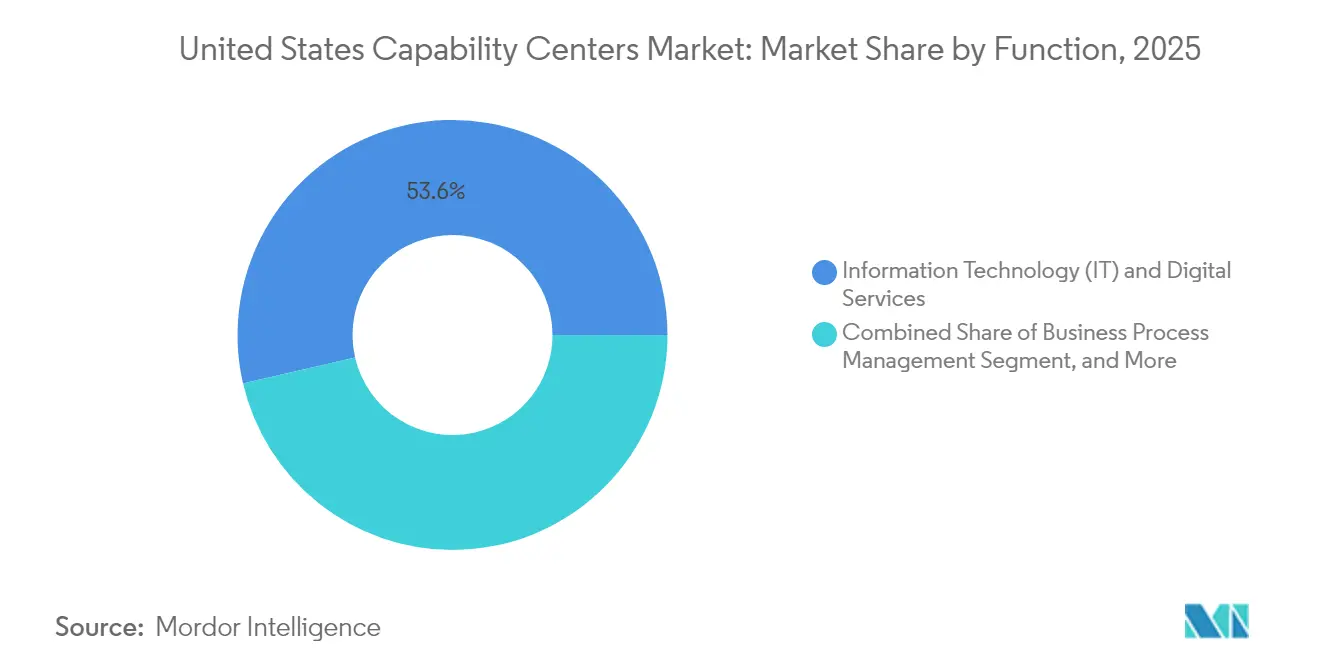
- By function, information technology and digital services led with 53.62% of the United States global capability centers market share in 2025; knowledge process outsourcing is projected to expand at a 6.99% CAGR through 2031.
- By engagement model, captive self-build approaches held a 57.10% share of the United States' global capability centers market size in 2025, while the hybrid build-operate-transfer model is projected to advance at a 6.58% CAGR through 2031.
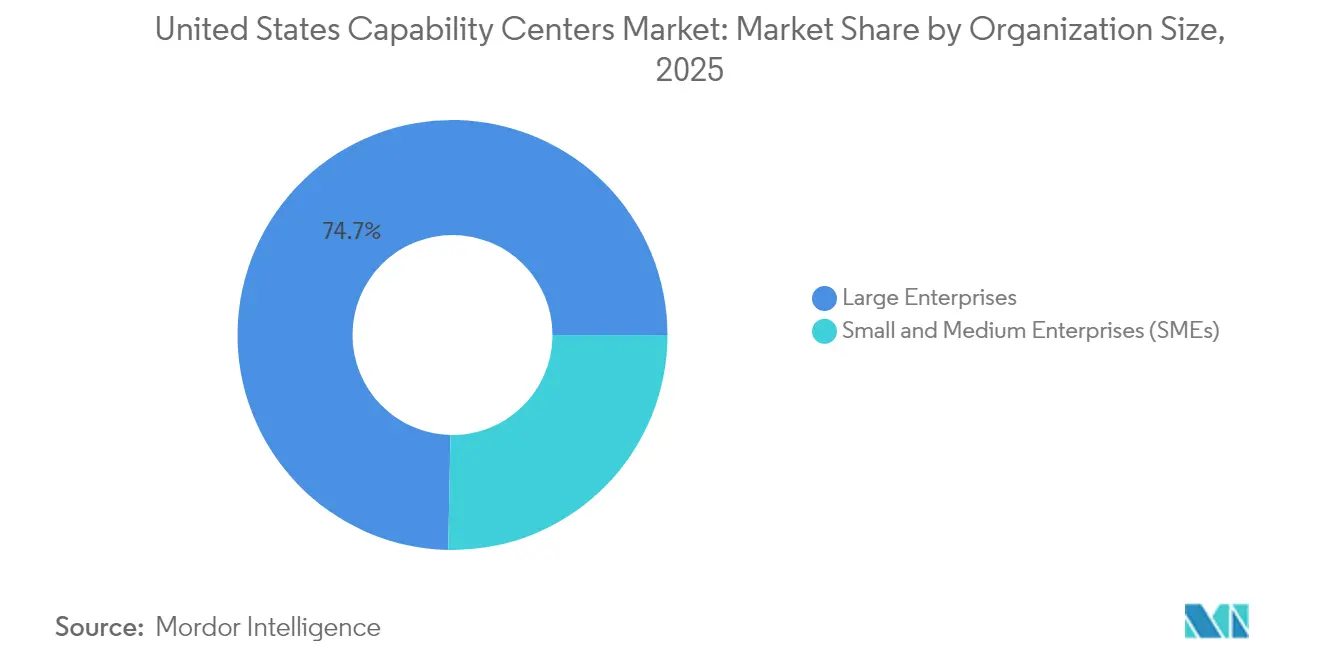
- By organization size, large enterprises commanded 74.68% of the 2025 value, whereas small and medium enterprises are set to grow at a 7.21% CAGR through 2031.
- By industry vertical, banking, financial services, and insurance accounted for a 33.20% share of the United States' global capability centers market size in 2025; healthcare and life sciences are projected to grow at a 6.26% CAGR between 2026 and 2031.
Note: Market size and forecast figures in this report are generated using Mordor Intelligence’s proprietary estimation framework, updated with the latest available data and insights as of 2026.
United States Global Capability Centers Market Trends and Insights
Drivers Impact Analysis*
| Driver | (~) % Impact on CAGR Forecast | Geographic Relevance | Impact Timeline |
|---|---|---|---|
| Rising demand for nearshore agile delivery capabilities | +1.2% | National, with a concentration in technology corridors | Medium term (2-4 years) |
| Accelerating digital transformation mandates among United States enterprises | +1.8% | Global, with primary impact in North America | Short term (≤ 2 years) |
| Shortage of niche tech talent is pushing captives onshore | +1.4% | National, acute in Tier-1 cities | Long term (≥ 4 years) |
| Heightened data-sovereignty and compliance requirements | +0.9% | National, with spillover to allied jurisdictions | Medium term (2-4 years) |
| Availability of state-level incentives for high-skill job creation | +0.7% | Regional, concentrated in Texas, Florida, and North Carolina | Short term (≤ 2 years) |
| Expansion of hyperscaler cloud regions within the United States | +0.6% | National, with emphasis on data center hubs | Long term (≥ 4 years) |
| Source: Mordor Intelligence | |||
Rising Demand for Nearshore Agile Delivery Capabilities
Enterprises seek quicker release cycles and stronger collaboration, which pure offshore models cannot always deliver. Time-zone compatibility within the Americas improves daily stand-ups and reduces rework across software sprints, making the nearshore option a default for many digital products. Mexico and selected Latin American hubs have become logical spokes, while a U.S. command-center hub orchestrates architecture, security, and stakeholder alignment. Firms design this hub-and-spoke structure to maintain strategic oversight domestically and execute tasks in a distributed manner. The arrangement allows the United States' global capability centers market to serve both resilience and speed objectives without sacrificing cost efficiency.[1]Bloomberg Newsroom, “Why U.S. Data Rules Are Driving On-Shore Technology Hubs,” bloomberg.com
Accelerating Digital Transformation Mandates among United States Enterprises
Cloud migration, AI engineering, and real-time analytics are no longer discretionary projects; they underpin growth and competitive advantage. Large platform vendors are investing directly in GCC infrastructures to propel product pipelines, illustrated by a USD 200 million ServiceNow outlay that created new domestic centers for low-code innovation. Similar moves are reverberating across mid-tier firms, which now view GCCs as the epicenter for agile pilots and governance of generative AI. This wave of investment sustains the United States' global capability centers market as organizations recognize that proximity shortens feedback loops between business and engineering teams.
Shortage of Niche Tech Talent Pushing Captives On-Shore
The scarcity of AI, cybersecurity, and cloud-architecture skills forces companies to anchor critical knowledge domestically to retain intellectual property control. Surveys from talent-management specialists show two-thirds of IT hiring managers struggle to fill advanced roles, a gap that GCCs directly mitigate by consolidating scarce expertise in focused hubs.[2]ManpowerGroup, “2024 U.S. Talent Shortage Survey,” manpowergroup.com Firms layer hybrid staffing strategies on top, allowing domestic architects to guide distributed developers, thereby balancing cost and quality while growing the United States' global capability centers market.
Heightened Data-Sovereignty and Compliance Requirements
Rules, such as Executive Order 14117 and cross-border data proposals, elevate liability when sensitive information is moved offshore. Financial institutions and healthcare providers now keep personally identifiable data inside U.S. borders to streamline audits and breach responses. Domestic GCCs integrate with hyperscaler regions that guarantee in-country storage, meeting residence mandates without slowing innovation. Compliance-driven workloads, therefore, remain onshore, helping the United States' global capability centers market maintain a stable growth trajectory.
Restraints Impact Analysis*
| Restraint | (~) % Impact on CAGR Forecast | Geographic Relevance | Impact Timeline |
|---|---|---|---|
| High labor cost versus offshore alternatives | -2.1% | National, most acute in Tier-1 technology corridors | Long term (≥ 4 years) |
| Intense competition for specialised tech talent in tier-1 cities | -1.3% | Regional, concentrated in Silicon Valley, Seattle, and Austin | Medium term (2-4 years) |
| Uncertain federal immigration policy outlook impacting talent pipelines | -0.8% | National, with implications for H-1B dependent organizations | Short term (≤ 2 years) |
| Rising commercial real estate costs in prime technology corridors | -0.6% | Regional, affecting San Francisco, New York, and Boston markets | Medium term (2-4 years) |
| Source: Mordor Intelligence | |||
High Labor Cost versus Offshore Alternatives
Domestic salary levels for senior cloud or AI engineers remain significantly higher than those for equivalent roles in Asia. While productivity and reduced coordination overhead narrow the delta, the headline payroll gap still strains business cases for routine work. Companies respond by automating transactional tasks and reserving the United States' global capability centers market resources for high-value engineering and design. Total-cost-of-ownership models that factor in quality lapses, travel, and tariffs tilt decisions toward selective on-shoring, but expense sensitivity persists and tempers growth.[3]Association for Advancing Automation, “Reshoring and Nearshoring Trends Making North America Competitive,” automate.org
Intense Competition for Specialised Tech Talent in Tier-1 Cities
The concentration of unicorns, hyperscalers, and venture-funded startups in major metropolitan areas fuels bidding wars for the same cybersecurity and DevSecOps talent pool. This drives compensation packages and attrition rates higher, posing a challenge to smaller GCC entrants. Employers are increasingly scouting secondary markets and exploring hybrid work patterns to widen their candidate pools. In the long run, diffusion of talent can smooth cost curves, but near-term pressure limits headcount expansion for some centers.[4]fDi Intelligence, “The U.S. Report 2024,” fdiintelligence.com
*Our forecasts treat driver/restraint impacts as directional, not additive. The impact forecasts reflect baseline growth, mix effects, and variable interactions.
Segment Analysis
By Function / Capability – Digital Services Maintain Primacy while Knowledge Processes Surge
Information technology and digital services contributed the largest slice of 2025 revenue, underscoring their role in delivering scalable cloud foundations and microservice architectures. Many corporations expanded DevOps pods, site reliability teams, and platform engineering squads within their hubs to accelerate modernization timelines. Simultaneously, knowledge process outsourcing recorded the fastest trajectory, with a 6.99% CAGR, as enterprises upgraded GCCs into analytics, actuarial, and pricing engines that guide core business decisions. The United States global capability centers market size for knowledge-intensive work is projected to close nearly half the existing gap with pure IT by 2031 as AI-enabled insights become table stakes.
Demand for IP protection and tighter alignment with business leadership keep advanced R&D, product design, and validation activities domestic. Automotive and semiconductor players, for example, rely on these centers to shorten prototyping cycles. With cloud waste and security threats escalating, cybersecurity operations functions are also migrating onshore for 24/7 monitoring, led by staff cleared for U.S. data-handling standards. These dynamics reinforce a strategic shift from labor arbitrage to capability arbitrage, boosting the overall resilience of the United States' global capability centers market.


By Engagement Model – Hybrid Structures Balance Speed and Control
Captive self-build remains the default architecture because it gives companies end-to-end governance over source code, data, and culture. Yet the skill gap renders greenfield builds time-consuming, which raises interest in build-operate-transfer paths delivered by seasoned partners. Hybrid variants, where the partner co-owns or manages a center for three to five years before a structured handover, are expanding at a 6.58% CAGR. This approach enables enterprises to tap into experienced recruitment funnels and operating playbooks without sacrificing ultimate ownership and control.
Virtual captive arrangements are also on the rise, particularly among mid-market firms that want dedicated teams but cannot shoulder facility or HR administration. Providers establish legal entities, hire employees, and manage compliance, while clients guide the roadmap. As automation platforms ease onboarding, these flexible models unlock entry points for firms previously priced out of the United States global capability centers market, further broadening its reach.
By Organization Size – SME Adoption Democratizes the Landscape
Large enterprises still dominate spending because they operate multi-function hubs spanning engineering, finance, and procurement. These centers often exceed 1,000 employees and tap sizable capital budgets for immersive labs and cyber-range facilities. Despite scale advantages, growth momentum is shifting toward small and medium-sized enterprises, whose 7.21% CAGR signals widening access. Managed service frameworks and cloud-native toolchains reduce initial outlays, enabling SMEs to spin up a 50-person analytics pod in weeks instead of months.
Lower barriers allow startups and mid-caps to retain intellectual property domestically, essential when developing proprietary algorithms or regulated fintech products. Many use a staged-investment playbook, starting with a quality-assurance nucleus before layering on product engineering. Such modular expansion underscores how the United States' global capability centers market empowers firms of all sizes to retain critical know-how at home while still leveraging distributed talent networks for scalability.
By Industry Vertical – Healthcare and Life Sciences Accelerate Post-Pandemic Expansion
Financial services led early adoption because data-protection rules compelled banks to control processing in-country, accounting for 33.20% of the 2025 value. Wealth-management and payments players add quantitative research and fraud analytics pods that thrive under stringent security mandates. The healthcare and life sciences sectors are now delivering the fastest growth, at a 6.26% CAGR, as telehealth, real-world evidence studies, and genomics analytics intensify computational and governance needs. Domestic GCCs help providers comply with HIPAA and FDA audit trails while accelerating algorithm validation for clinical decision support.
Industrial manufacturers, energy giants, and retailers also scale centers to oversee Industry 4.0 rollouts, sensor data analytics, and omnichannel personalization engines. These sector-specific shifts bolster overall diversification, ensuring the United States' global capability centers market is not overly reliant on a single vertical.
Geography Analysis
exas leads the way in location choice, powered by the Jobs, Energy, Technology, and Innovation Act, which grants property tax reductions of 50%-75% for qualified projects. Austin’s pipeline of computer science graduates, Dallas’s telecom heritage, and Houston’s expertise in the energy domain provide firms with a broad skill mix. North Carolina’s Research Triangle and Florida’s fintech corridor offer similar incentives, making them attractive for mid-sized centers looking to avoid overcrowded labor markets.
Virginia houses the world’s densest cluster of hyperscale data centers, a magnet for data-intensive GCCs needing low-latency cloud on-ramps. Proximity to Washington, D.C., also appeals to regulated sectors requiring collaborative ties with federal agencies. California and New York, despite premium costs, remain critical for innovation labs tied to venture-capital ecosystems and client headquarters.
Secondary metros such as Phoenix, Denver, and Nashville grow in stature as enterprises diversify their footprint risk. Semiconductor investments spurred by the CHIPS and Science Act encourage Arizona-based engineering hubs, while clean-energy incentives nurture battery analytics centers along the Southeast “battery belt.” Together, these patterns distribute the United States' global capability centers market across a widening set of states, mitigating saturation in traditional hubs.
Competitive Landscape
The provider ecosystem is moderately fragmented, with no single vendor holding a dominant share. Global consultancies, Indian IT majors, and specialized niche firms all stake claims, resulting in the top five players holding a nominal share of the market revenue. Accenture, IBM, and Cognizant leverage wide client rosters and transformation expertise to win large, multi-tower mandates. Meanwhile, product companies like ServiceNow and Salesforce pursue captive builds to safeguard innovation pipelines.
Competition hinges less on labor cost and more on domain accelerators, AI toolchains, and compliance frameworks. Vendors acquiring cybersecurity, cloud engineering, or data governance boutiques can quickly expand their vertical depth. Automation-first operating models that embed bots for provisioning and testing lower total cost, while Gen-AI copilots reduce ticket resolution times. Providers that demonstrate measurable productivity gains win out as clients evaluate total value rather than hourly rates.
Mid-tier specialists carve lanes by focusing on sectors such as life sciences or automotive embedded software. These firms often co-locate near OEM clusters for faster iteration. In parallel, real estate developers are tailoring campus-as-a-service offerings, complete with fiber redundancy and renewable energy credits, further professionalizing the ecosystem supporting the United States' global capability centers market.
United States Global Capability Centers Industry Leaders
Accenture plc
International Business Machines Corporation
Capgemini SE
Cognizant Technology Solutions Corporation
Tata Consultancy Services Limited
- *Disclaimer: Major Players sorted in no particular order

Recent Industry Developments
- July 2025: Costco Wholesale confirms its first global capability center in Hyderabad, India. The retailer will begin with approximately 1,000 technology and research professionals who will advance digital initiatives across the company’s global network.
- July 2025: Albertsons Companies bolsters its Bengaluru hub and targets 1,000 new technology hires over the next 18 months to deepen artificial-intelligence and data-driven retail programs.
- July 2025: State Street Corporation opens a 210,000-square-foot facility in Coimbatore that can accommodate approximately 2,400 employees, complementing its recently inaugurated Chennai center and extending multi-city support for custody, asset management, and technology operations.
- May 2025: ServiceNow invests USD 200 million in ANSR Global to speed up the rollout of capability centers that enhance product development and customer success.


United States Global Capability Centers Market Report Scope
The scope of the global capability center study for the market segmentation by the Function/Capability for (i) Information Technology (IT) and Digital Services segment is limited to Software Development, Cloud and Infrastructure Management, Cybersecurity, Data Analytics and AI/ML; (ii) Engineering / ER&D segment is limited to Product Design and Testing, Embedded Systems, Digital Twin / Simulation; (iii) Business Process Management (BPM) segment is limited to Finance and Accounting, HR, Payroll and Talent Management, Procurement, Customer Service; and (iv)Knowledge Process Outsourcing (KPO) segment is limited to Market Research and Insights, Risk and Compliance, Legal and Regulatory Support, Strategy and Consulting Support. Similarly, for segmentation by the Engagement Model, scope for (i) Hybrid Build-Operate-Transfer (BOT) is limited to Joint Venture / Strategic Partnership and Virtual Captive Model. The rest of the segment scope is as specified for the listed segment.
| Information Technology (IT) and Digital Services |
| Engineering / ER&D |
| Business Process Management (BPM) |
| Knowledge Process Outsourcing (KPO) |
| Captive (Self-Build) / In-House |
| Build-Operate-Transfer (BOT) |
| Hybrid Build-Operate-Transfer (includes Joint Venture / Strategic Partnership and Virtual Captive Model) |
| Large Enterprises |
| Small and Medium Enterprises (SMEs) |
| Banking, Financial Services, and Insurance (BFSI) |
| Telecom and IT |
| Healthcare and Life Sciences |
| Manufacturing, Automotive and Industrial |
| Retail and Consumer Goods |
| Other Industry Verticals |
| By Function / Capability | Information Technology (IT) and Digital Services |
| Engineering / ER&D | |
| Business Process Management (BPM) | |
| Knowledge Process Outsourcing (KPO) | |
| By Engagement Model | Captive (Self-Build) / In-House |
| Build-Operate-Transfer (BOT) | |
| Hybrid Build-Operate-Transfer (includes Joint Venture / Strategic Partnership and Virtual Captive Model) | |
| By Organization Size | Large Enterprises |
| Small and Medium Enterprises (SMEs) | |
| By Industry Vertical | Banking, Financial Services, and Insurance (BFSI) |
| Telecom and IT | |
| Healthcare and Life Sciences | |
| Manufacturing, Automotive and Industrial | |
| Retail and Consumer Goods | |
| Other Industry Verticals |


Key Questions Answered in the Report
What is the current value of the United States' global capability centers market?
It is expected to reach USD 72.45 billion in 2026, with a 5.60% CAGR through 2031.
Which function generates the most revenue inside U.S. capability centers?
Information technology and digital services account for the largest share at 53.62% in 2025.
Why are healthcare firms expanding domestic capability centers?
Post-pandemic digitization and stricter data governance rules make onshore hubs essential for HIPAA compliance and AI-driven diagnostics.
How are small and medium enterprises using capability centers?
SMEs leverage cloud-native frameworks and managed services to spin up focused pods without large capital outlays, growing at a 7.21% CAGR.
Which states offer the strongest incentives for new centers?
Texas, North Carolina, and Florida provide property-tax abatements and job-creation credits that improve project economics.
What challenges could slow market growth?
High domestic labor costs and fierce competition for specialized talent in tier-1 cities remain the primary constraints.
Page last updated on:


