
United States Fixed Wireless Access Market Size and Share
Market Overview
| Study Period | 2020 - 2031 |
|---|---|
| Forecast Data Period | 2026 - 2031 |
| Base Year Market Size (2025) | USD 10.56 Billion |
| Market Size (2026) | USD 12.23 Billion |
| Market Size (2031) | USD 23.94 Billion |
| Growth Rate (2026 - 2031) | 14.38 % |
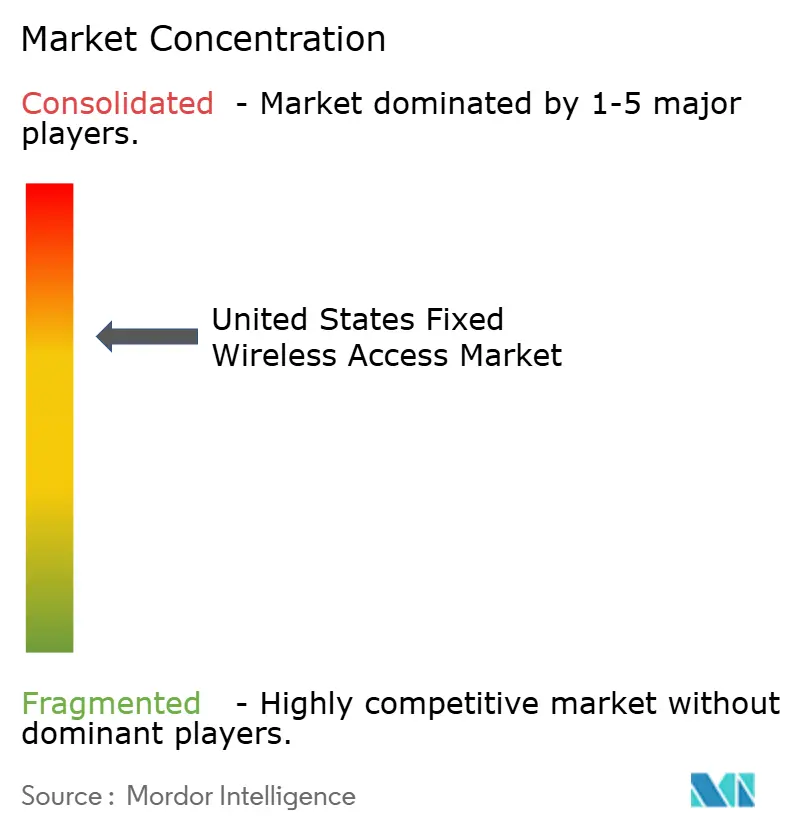
| Market Concentration | Medium |
Major Players *Disclaimer: Major Players sorted in no particular order Image © Mordor Intelligence. Reuse requires attribution under CC BY 4.0. | |
United States Fixed Wireless Access Market Analysis by Mordor Intelligence
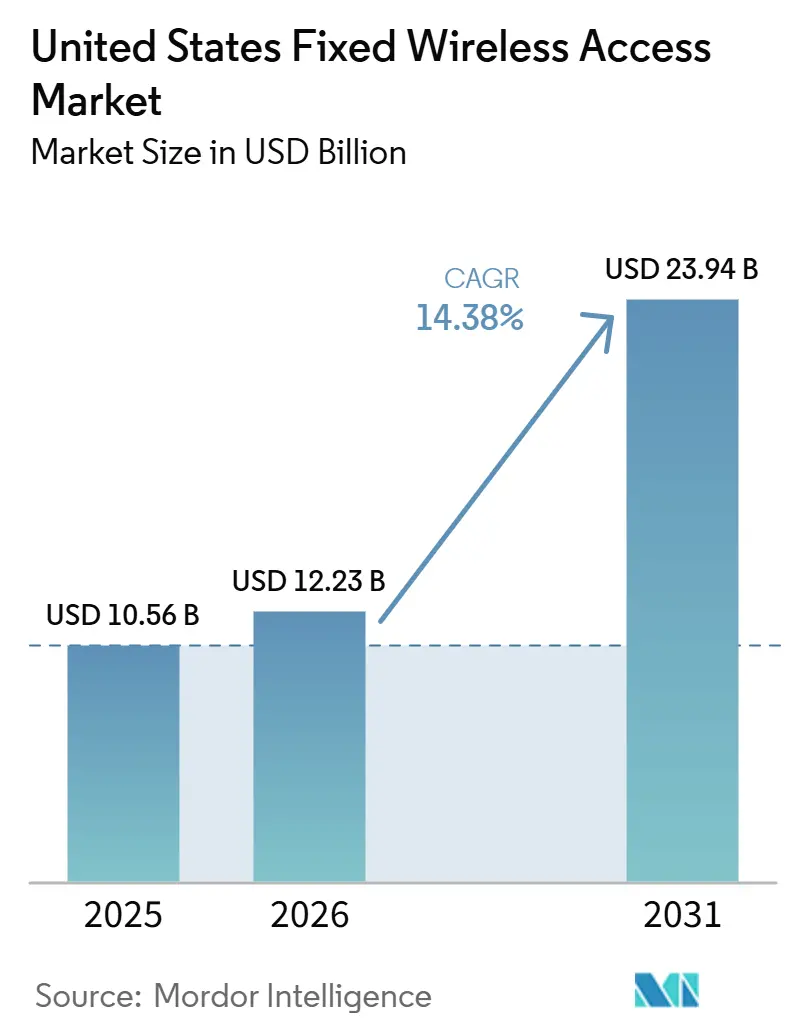
The United States Fixed Wireless Access Market size is projected to expand from USD 10.56 billion in 2025 and USD 12.23 billion in 2026 to USD 23.94 billion by 2031, registering a CAGR of 14.38% from 2026 to 2031. The United States fixed wireless access market expanded as broadband users sought a lower-cost, faster-to-activate option than many wired services. National carriers pushed this shift by expanding 5G coverage, growing the installed base, and treating fixed wireless as a core broadband product rather than a niche extension. Demand also moved beyond households as enterprises, public agencies, and site-based users required resilient links that could be activated without long construction timelines. At the same time, the United States fixed wireless access market faced a practical limit in spectrum capacity, especially in dense areas where usage per connection is materially higher than on mobile plans. Competitive pressure will remain high as carriers, regional providers, and equipment vendors seek to maintain margins while shifting the revenue mix toward managed services and higher-value connectivity packages.
Key Report Takeaways
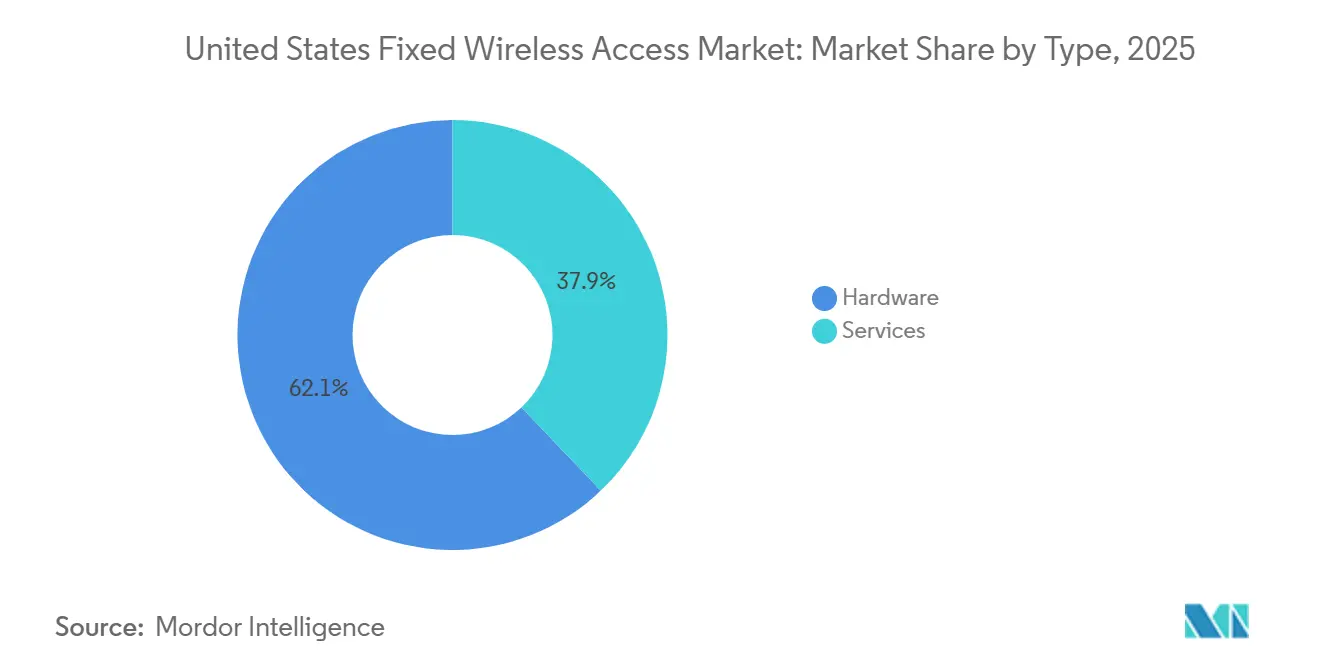
- By type, the hardware segment held 62.12% revenue share in the United States fixed wireless access market in 2025, while services are projected to expand at 15.55% CAGR through 2031.
- By application, residential connections accounted for 65.33% revenue share in the United States fixed wireless access market in 2025, while government and public safety are projected to expand at 14.88% CAGR through 2031.
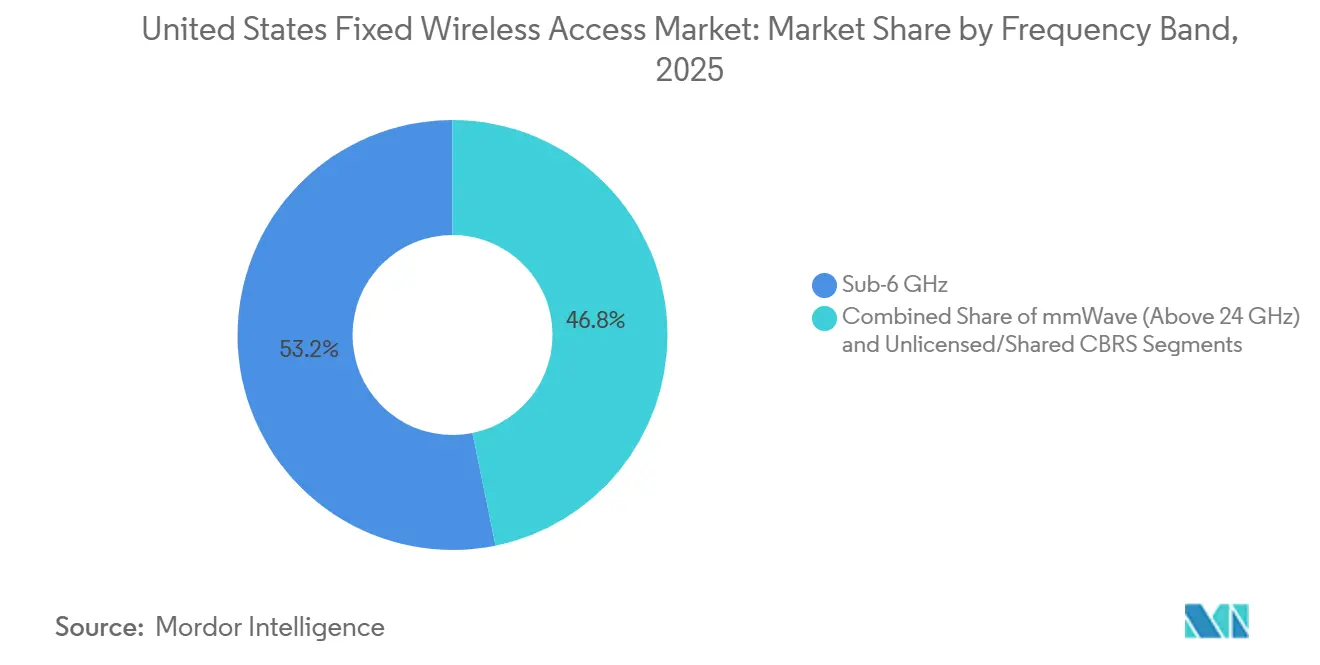
- By frequency band, Sub-6 GHz held 53.21% revenue share in the United States fixed wireless access market in 2025, while mmWave (above 24 GHz) is projected to expand at 15.11% CAGR through 2031.
- By deployment mode, indoor CPE held 63.44% revenue share in the United States fixed wireless access market in 2025, while self-install window-mount CPE is projected to expand at 15.77% CAGR through 2031.
Note: Market size and forecast figures in this report are generated using Mordor Intelligence’s proprietary estimation framework, updated with the latest available data and insights as of January 2026.
United States Fixed Wireless Access Market Trends and Insights
Drivers Impact Analysis*
| Driver | (~) % Impact on CAGR Forecast | Geographic Relevance | Impact Timeline |
|---|---|---|---|
| 5G Rollout Accelerating Gigabit-Class Fixed Wireless Access Adoption | +4.2% | Global, with the United States leading at the national operator level | Short term (≤ 2 years) |
| Rural Broadband Funding Favoring Rapid-Deploy Connectivity | +3.3% | National, with strongest gains across Midwest, South, and Mountain West rural markets | Medium term (2-4 years) |
| Fixed Wireless Access as a Fiber Deferral Strategy for Cost-Constrained ISPs | +2.5% | National, concentrated in suburban and exurban markets | Short term (≤ 2 years) |
| Enterprise Network Resilience Demand for Primary and Backup Broadband | +1.8% | National, with early concentration in major metropolitan and secondary metro areas | Medium term (2-4 years) |
| AI-Optimized CPE and Self-Install to Cut Acquisition and Support Costs | +1.2% | Global, with North America leading commercial deployment | Medium term (2-4 years) |
| Private Spectrum and Mid-Band Capacity Reuse Improving Economics | +0.8% | National, concentrated in industrial corridors, enterprise campuses, and rural broadband zones | Long term (≥ 4 years) |
| Source: Mordor Intelligence | |||
5G Rollout is Expanding Gigabit-Class Fixed Wireless Access
The United States fixed wireless access market is benefiting from a stronger 5G performance base than earlier LTE-based offerings could deliver. Mid-band spectrum in C-band (3.45 GHz) and CBRS has widened the serviceable footprint for home broadband and supported speeds that meet mainstream broadband use. The three largest carriers added nearly 1 million FWA net connections in the first quarter of 2026, extending a multi-quarter pattern in which this category has captured most U.S. broadband growth.[1]Ericsson, “Fixed Wireless Access Outlook,” Ericsson Mobility Report, ericsson.com That pace matters because it shows that 5G coverage expansion is now translating into subscriber additions at scale rather than staying as a technical network milestone. The United States fixed wireless access market is also moving into higher-value business use cases, as 5G-based service tiers can support more demanding traffic profiles than earlier FWA offerings. This keeps network rollout, spectrum reuse, and service differentiation tightly linked over the forecast period.
Rural Broadband Funding is Improving the Case for Rapid Deployment
The United States fixed wireless access market has benefited from rural broadband funding because wireless networks can be deployed faster than trench-heavy wired projects. That timing matters in low-density areas where service gaps remain large, and households cannot wait through long construction cycles. The appeal is strongest in the Midwest, the South, and the Mountain West, where geography and lower population density can slow wireline expansion. This funding backdrop also supports regional providers that already have tower access, local coverage knowledge, and lower time-to-service than large-scale wired builds. The United States fixed wireless access market should continue to see stronger rural participation as these operators convert approved projects into live coverage. That makes funding a market access lever as much as a short-term demand stimulus.
Fixed Wireless Access is Serving as a Fiber Deferral Tool for Cost-Constrained ISPs
The United States fixed wireless access market is also growing, as smaller and mid-tier providers use FWA to monetize addresses before fiber reaches them. This approach lets an operator serve customers from existing tower assets in weeks rather than waiting for a lengthy construction program to finish. The model is attractive because revenue begins earlier, subscriber relationships are secured sooner, and capital can be directed first to the highest-return fiber routes. Industry thinking has moved away from viewing FWA only as a temporary bridge, and large U.S. carriers have treated it as a durable broadband layer with room for further share gains. The United States fixed wireless access market therefore benefits when providers use wireless to sequence investment more carefully, rather than leaving areas unserved during the fiber build cycle. This has made FWA a practical part of capital planning rather than only a stopgap product.
Enterprise Demand for Resilience is Broadening the Revenue Base
The United States fixed wireless access market is expanding into enterprise settings, where uptime, failover, and faster provisioning are stronger buying factors. Business users are no longer relying solely on wireless for backup in every case, because some now want primary and standby paths under a single managed arrangement. T-Mobile US launched SuperBroadband in April 2026, combining its 5G Advanced network with Starlink broadband for business customers and offering a financially backed 99.99% uptime guarantee in covered areas.[2]T-Mobile US, “T-Mobile Reinvents Business Internet From the Ground Up and the Sky Down With ‘SuperBroadband,’” Nasdaq, nasdaq.com That kind of offer shows how the United States fixed wireless access market is moving toward service-layer value, centralized management, and contract-based enterprise relationships. It also reduces the market’s dependence on pure residential volume, which is more exposed to pricing pressure. As a result, resilience-led demand is supporting a broader and more stable revenue mix.
Restraints Impact Analysis*
| Restraint | (~) % Impact on CAGR Forecast | Geographic Relevance | Impact Timeline |
|---|---|---|---|
| Mid-Band Spectrum Capacity Limits in High-Usage Markets | -0.4% | National, most acute in dense suburban and urban markets | Short term (≤ 2 years) |
| Fiber and Cable Price Competition Compressing Fixed Wireless Access Margins | -0.3% | National, concentrated in suburban and urban markets with active fiber overbuilds | Medium term (2-4 years) |
| mmWave Coverage and Line-of-Sight Sensitivity in High-Density Areas | -0.2% | National, primarily affecting dense urban deployments | Long term (≥ 4 years) |
| Uneven Economics Where Fiber Payback Accelerates in Select Suburbs | -0.1% | National, concentrated in higher-income suburban clusters | Long term (≥ 4 years) |
| Source: Mordor Intelligence | |||
Mid-Band Spectrum Limits are Constraining High-Usage Corridors
The United States fixed wireless access market faces a real ceiling in dense usage corridors because FWA traffic loads are far heavier than those of ordinary smartphone traffic. When many home broadband users are added to shared cellular infrastructure, congestion risk rises faster than in mobile-only growth scenarios. This makes address-level eligibility a network management issue rather than a simple coverage issue in some suburban and urban pockets. The constraint is especially important because subscriber growth can slow even in areas where 5G coverage is already available. The United States fixed wireless access market will remain exposed to this issue until additional spectrum is not only assigned but fully deployed in operating networks. That leaves capacity planning as one of the clearest near-term limits on otherwise strong demand.
Fiber and Cable Pricing Pressure is Tightening Margins
The United States fixed wireless access market also faces margin pressure as fiber builders and cable operators defend or expand their customer bases. In competitive suburbs, the selling point of FWA is shifting away from price alone because bundles, promotions, and upgraded wired speeds narrow the gap. That puts pressure on providers that rely mainly on low monthly pricing to win share. The strain is sharper for smaller operators because they must compete against national carriers with deeper spectrum assets and against incumbent cable providers protecting existing subscribers. The United States fixed wireless access market, therefore, has to compete on activation speed, flexibility, and managed service quality as much as on monthly cost. This restraint does not remove demand, but it does make profitable growth harder in overlap zones.
*Our forecasts treat driver/restraint impacts as directional, not additive. The impact forecasts reflect baseline growth, mix effects, and variable interactions.
Segment Analysis
By Type: Services Momentum Signals a Recurring-Revenue Shift
Hardware captured 62.12% of the United States fixed wireless access market share in 2025, supported by widespread 5G CPE deployment as operators upgraded customer gateways and access units. The segment still reflects the volume effect of residential expansion because every new subscriber connection needs a device and, in many cases, related access infrastructure. Equipment design continues to improve as vendors push better indoor reception, near-window placement, and stronger uplink performance. Vantiva introduced its Hawk 5G FWA home gateway in March 2026 with Power Class 1.0 support, a near-window form factor, and a third-generation indoor antenna system aimed at improving mid-band efficiency and extending usable cell reach.[3]Vantiva, “Vantiva Unveils New Hawk 5G FWA Home Gateway, Designed for 5G SA,” Vantiva, vantiva.com
The United States fixed wireless access market size for services is projected to expand at 15.55% CAGR over 2026-2031, ahead of hardware, as carriers shift toward managed connectivity and enterprise-grade packages. This pattern matters because the installed base is now large enough for support, orchestration, and contract-backed service layers to carry a larger share of the value pool. The move also fits a broader telecom pattern in which device economics mature while software, lifecycle support, and performance assurance become more important. T-Mobile US reinforced that direction in 2026 by combining 5G and satellite connectivity into a managed business offer rather than competing only on access hardware. Within the United States fixed wireless access industry, this shift suggests that long-term profitability will depend less on unit shipments alone and more on how effectively providers bundle service quality, orchestration, and resilience.


By Application: Residential Demand Anchors Revenue While Government Use Cases Gain Speed
Residential accounted for 65.33% of the United States fixed wireless access market in 2025, making it the primary driver of current revenue. The segment was led by suburban and semi-rural households seeking a practical alternative to cable and DSL with faster activation and lower monthly pricing. This base enabled the United States fixed wireless access market to scale quickly, as carriers could add subscribers without waiting for last-mile infrastructure. It also created a broad installed base that supported later upselling into improved devices, stronger indoor coverage options, and higher-value plans.
Government and public safety are projected to expand at 14.88% CAGR through 2031, the fastest rate across application segments in the United States fixed wireless access market. This part of the market is supported by first-responder communications, facility connectivity needs, and public network resilience requirements that place emphasis on the speed of deployment and service continuity. Industrial use is also building as site-based operators use wireless connectivity for logistics, utilities, and operational settings where fast coverage and controlled deployment matter. Commercial demand remains important because small businesses and multisite users value short installation times and the ability to activate service without long construction dependencies. Within the United States fixed wireless access industry, this evolving mix should reduce the market’s historical dependence on household demand alone by the end of the forecast period.
By Frequency Band: Sub-6 GHz Holds the Core While mmWave Builds Targeted Scale
Sub-6 GHz held a 53.21% share in 2025 and remained the backbone of the United States fixed wireless access market, as it balances coverage depth with workable capacity for suburban and rural service. C-band, CBRS, and 3.45 GHz assets have been central to this position because they provide carriers and service providers with a broader, more practical footprint than very high-frequency alternatives. This made Sub-6 GHz the primary path for scaling household broadband across wide geographic areas. It also kept the United States fixed wireless access market closely tied to spectrum efficiency, propagation quality, and the pace at which national carriers could expand mid-band coverage.
The United States fixed wireless access market for mmWave is projected to expand at a 15.11% CAGR through 2031, driven by targeted use in apartment buildings and enterprise settings that require very high throughput. The opportunity is real, but it is selective because mmWave performance can fall sharply when line-of-sight conditions weaken or when users move deeper into around-corner street segments. A 2025 IEEE INFOCOM study based on 28 GHz measurements in Manhattan found more than 20 dB of path-gain drop within around-corner segments at 20 meters, with downlink rates dropping by more than 10 times after 50 meters in some dense urban conditions. That evidence explains why mmWave in the United States fixed wireless access market works best where building layout, site density, and fallback connectivity are tightly managed. The segment can still lift average revenue per user in premium use cases, but it is unlikely to replace Sub-6 GHz as the broad coverage engine.

By Deployment Mode: Self-Install Window-Mount CPE is Improving the Cost Equation
Indoor CPE retained a 63.44% share in 2025 and remained the leading deployment mode in the United States fixed wireless access market, as it is well-suited to mass residential rollouts. Operators favor this model when they want to avoid truck rolls, lower activation costs, and keep the sign-up process simple for households and small businesses. Nokia’s FastMile line reflects this approach with indoor gateways, indoor-outdoor receivers, and mobile app support that guides placement, activation, and in-home Wi-Fi setup. The value of indoor CPE in the United States fixed wireless access market is therefore tied not only to hardware sales, but also to easier installation workflows and lower operating expenses.
Self-install window-mount CPE is projected to expand at 15.77% CAGR through 2031, the fastest pace among deployment modes in the United States fixed wireless access market. This format matters because it aims to achieve better signal quality without forcing the customer to mount fully outdoors, drill holes, or run cables. Vantiva’s 2026 Hawk gateway also reflected this near-window design logic by positioning the unit for stronger 5G reception while preserving a more consumer-friendly setup path. As device intelligence improves, this model should narrow the performance gap between conventional indoor placement and more complex outdoor installations. That makes the window-mount option one of the clearest cost and experience levers inside the United States fixed wireless access market.
Geography Analysis
The United States fixed wireless access market showed its strongest near-term momentum in rural parts of the South, the Midwest, and the Mountain West, where lower wireline density leaves a wider opening for rapid broadband deployment. These areas remain attractive because service can be activated more quickly than in markets that rely on longer construction programs. The appeal is even stronger where terrain, distance between homes, and lower address density weaken the economics of extensive last-mile wireline expansion. For the United States fixed wireless access market, those conditions keep rural and semi-rural coverage central to subscriber growth during the current phase of buildout. They also give regional providers a clearer role, as local tower assets and local service knowledge still matter in less-dense territory.
The United States fixed wireless access market faces a more competitive landscape in suburban areas of the Northeast and the mid-Atlantic, where fiber expansion and upgraded cable networks have narrowed the pricing gap that once favored wireless more clearly. In these markets, the main selling point is often faster activation and less installation friction rather than price alone. This dynamic keeps FWA relevant, but it also means providers must compete harder on reliability, support, and package design. The United States fixed wireless access market, therefore, grows differently in suburbs, with overlap competition becoming a much larger factor than in more lightly served regions.
The United States fixed wireless access market is most constrained in dense urban areas such as New York, Los Angeles, and Chicago, where spectrum capacity is tighter, and wireline alternatives are widely available. Urban growth remains viable in targeted apartment-building deployments and in enterprise use cases where backup links, managed WAN setups, and higher uplink quality deliver value beyond headline price. AT&T, T-Mobile, and Verizon announced in 2026 that they planned a joint venture to eliminate dead zones by pooling spectrum resources and jointly investing in direct-to-device satellite technologies, a move that could strengthen coverage continuity in underserved and hard-to-reach areas over time. Even so, the United States fixed wireless access market in dense cities is likely to remain more capacity-constrained than in rural or semi-rural regions in the near term.
Competitive Landscape
The United States fixed wireless access market is moderately concentrated at the national carrier level and more fragmented across regional providers and equipment suppliers. The three largest US service providers had a combined FWA base of over 17 million connections by the first quarter of 2026, indicating that scale at the subscriber level remains concentrated even though the broader vendor field is diverse. T-Mobile US has competed through rapid scale, sustained connection additions, and a widening role in business connectivity rather than only consumer broadband. Verizon has emphasized performance-led positioning and enterprise-grade service logic, while AT&T has pursued a later, but more aggressive, expansion path to raise its market presence. This keeps the United States fixed wireless access market active on both network reach and service-layer differentiation.
The equipment side of the United States fixed wireless access market remains competitive because hardware design, signal optimization, and installation ease all affect the provider cost model. Vantiva’s Hawk 5G gateway showed one route to differentiation through near-window placement, Power Class 1.0 support, and higher indoor efficiency for 5G Standalone networks. Nokia has taken a parallel route by offering indoor, indoor-outdoor, and outdoor FastMile options, along with app-based installation and controller software that simplify deployment at scale. In the United States fixed wireless access market, that means competitive advantage increasingly depends on reducing deployment friction and improving service quality over the lifetime of the network, not just on shipping more devices.
A second strategic layer in the United States fixed wireless access market is the move toward managed resilience and multi-path connectivity for enterprises. T-Mobile US made that direction clear with SuperBroadband, which combined 5G and Starlink connectivity into a single managed business offering with centralized administration and a defined uptime commitment. AT&T, T-Mobile, and Verizon also signaled a willingness to collaborate on coverage gaps through their announced joint venture, pointing to a more coordinated approach when individual economics are weak in isolation. These moves suggest that the United States fixed wireless access market is no longer competing solely on access speed, as managed service quality, coverage continuity, and deployment efficiency are becoming central to strategy.
United States Fixed Wireless Access Industry Leaders
Verizon Communications Inc.
T-Mobile US, Inc.
AT&T Inc.
Rise Broadband, Inc.
Nextlink Internet
- *Disclaimer: Major Players sorted in no particular order

Recent Industry Developments
- May 2026: AT&T, T-Mobile US, and Verizon announced an agreement in principle to form a joint venture designed to eliminate wireless coverage dead zones across the United States by pooling ground-based spectrum resources across all 3 carriers. The initiative was expected to expand FWA addressable coverage in rural and exurban corridors where no single carrier currently had sufficient spectrum depth to justify standalone deployment.
- April 2026: T-Mobile US launched SuperBroadband, combining 5G Business Internet with Starlink low-earth-orbit satellite connectivity under a single managed service contract, targeting multi-location enterprises seeking simplified and resilient broadband management. The service promised 99.99% uptime with 1 contract, 1 bill, and centralized network management through T-Mobile's T-Platform portal.
- March 2026: Vantiva unveiled the Hawk 5G FWA home gateway at Mobile World Congress 2026, featuring Power Class 1.0 support for enhanced uplink performance and extended cell radius. The design was intended to replace outdoor-mounted units in the majority of residential deployment scenarios, reducing installation complexity while maintaining outdoor-grade signal performance.


United States Fixed Wireless Access Market Report Scope
The United States fixed wireless access (FWA) market's revenue is generated through the sale of FWA hardware, including customer premises equipment (CPE) and access units, as well as recurring subscription fees, installation and activation services, managed connectivity services, maintenance, and network support provided by fixed wireless service providers operating across Sub-6 GHz, mmWave, and CBRS frequency bands. The United States fixed wireless access market report is segmented by type (hardware (consumer premise equipment (CPE), access units (femto and picocells), and services), application (residential, commercial, industrial, and government and public safety), frequency band (sub-6 GHz, mmwave (above 24 GHz), and unlicensed/shared CBRS), and deployment mode (indoor CPE, outdoor CPE, and self-install window-mount CPE). The market forecasts are provided in value (USD).
| Hardware | Consumer Premise Equipment (CPE) |
| Access Units (Femto and Picocells) | |
| Services |
| Residential |
| Commercial |
| Industrial |
| Government and Public Safety |
| Sub-6 GHz |
| mmWave (Above 24 GHz) |
| Unlicensed/Shared CBRS |
| Indoor CPE |
| Outdoor CPE |
| Self-Install Window-Mount CPE |
| By Type | Hardware | Consumer Premise Equipment (CPE) |
| Access Units (Femto and Picocells) | ||
| Services | ||
| By Application | Residential | |
| Commercial | ||
| Industrial | ||
| Government and Public Safety | ||
| By Frequency Band | Sub-6 GHz | |
| mmWave (Above 24 GHz) | ||
| Unlicensed/Shared CBRS | ||
| By Deployment Mode | Indoor CPE | |
| Outdoor CPE | ||
| Self-Install Window-Mount CPE |


Key Questions Answered in the Report
What is the size of the United States fixed wireless access market in 2026 and how large could it become by 2031?
The United States fixed wireless access market stood at USD 12.23 billion in 2026 and is forecast to reach USD 23.94 billion by 2031, growing at a 14.38% CAGR over 2026-2031.
Which segment led by type in 2025 and which one is growing faster?
Hardware led by type with a 62.12% share in 2025, while services are projected to grow faster at a 15.55% CAGR through 2031.
Why is residential demand still so important for fixed wireless access in the United States?
Residential remained the largest application with a 65.33% share in 2025 because households valued lower monthly pricing, faster activation, and a practical alternative to cable and DSL.
What is making government and public safety use cases grow faster?
Government and public safety are projected to expand at 14.88% CAGR through 2031 because these users need resilient communications, rapid deployment, and reliable site connectivity.
Why does Sub-6 GHz remain more important than mmWave?
Sub-6 GHz held a 53.21% share in 2025 because it offers a better balance of coverage and capacity, while mmWave is growing quickly but works best in more selective, high-throughput settings.
How are companies changing competition in this space?
Carriers are moving beyond access pricing and are focusing more on managed resilience, enterprise-grade offers, easier installation, and stronger coverage continuity through initiatives such as SuperBroadband and the proposed joint venture.
Page last updated on:





