
United States Finished Vehicle Logistics Market Size and Share
Market Overview
| Study Period | 2020 - 2031 |
|---|---|
| Forecast Data Period | 2026 - 2031 |
| Base Year Market Size (2025) | USD 38.33 Billion |
| Market Size (2026) | USD 40.29 Billion |
| Market Size (2031) | USD 51.11 Billion |
| Growth Rate (2026 - 2031) | 4.87 % |
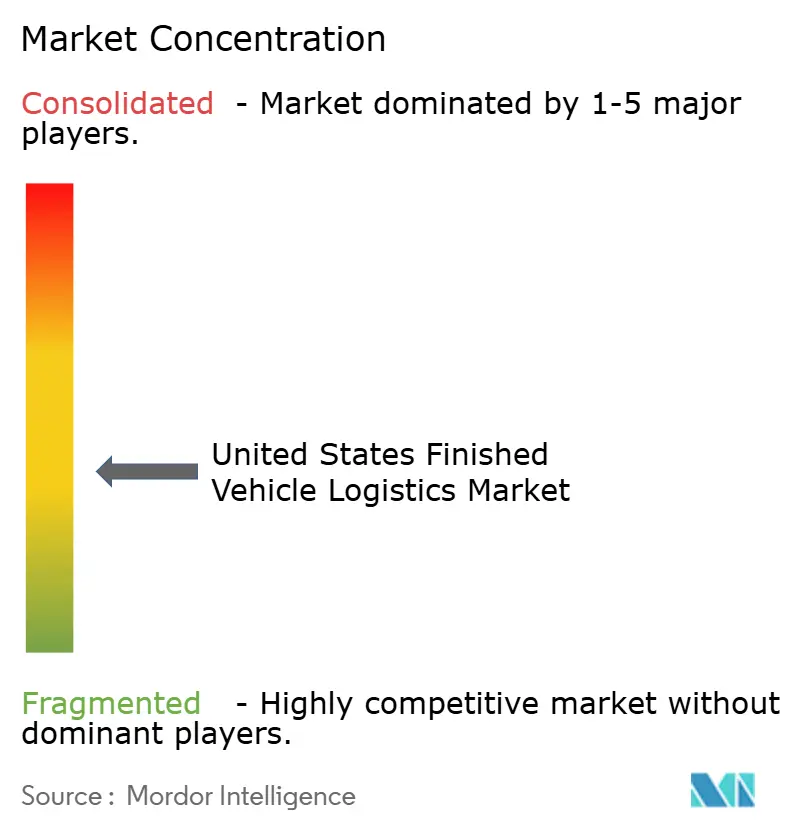
| Market Concentration | Medium |
Major Players *Disclaimer: Major Players sorted in no particular order Image © Mordor Intelligence. Reuse requires attribution under CC BY 4.0. | |
United States Finished Vehicle Logistics Market Analysis by Mordor Intelligence
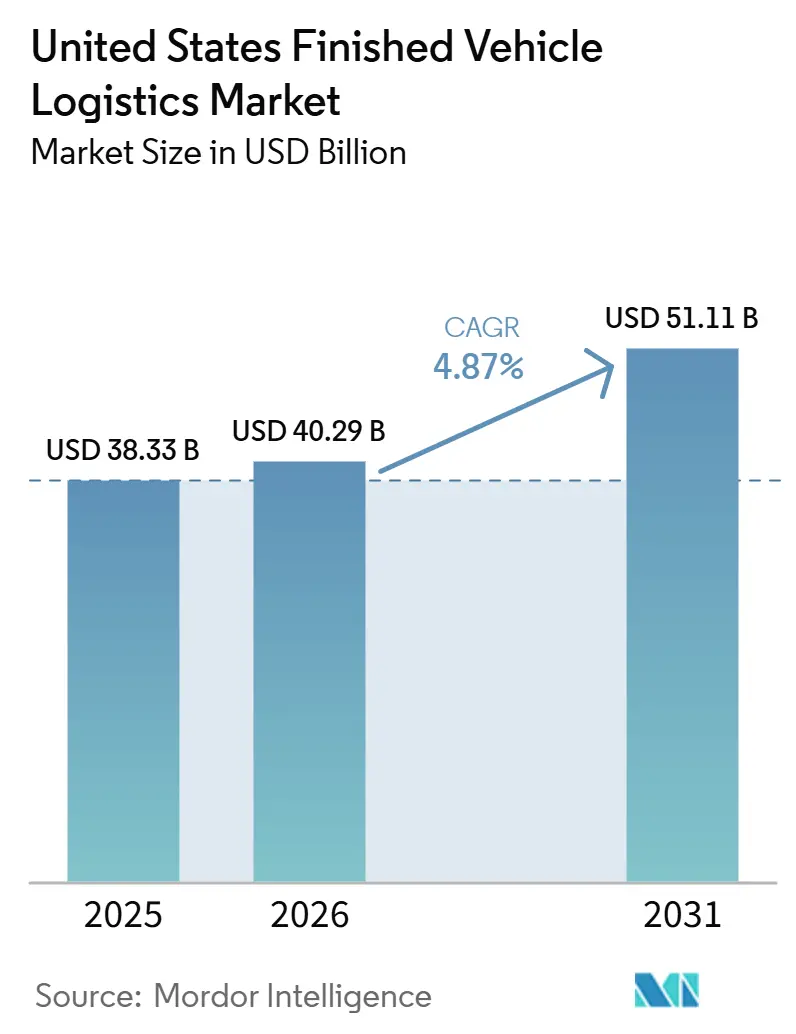
The United States finished vehicle logistics market size was valued at USD 38.33 billion in 2025 and estimated to grow from USD 40.29 billion in 2026 to reach USD 51.11 billion by 2031, at a CAGR of 4.87% during the forecast period (2026-2031).
Production localization is reshaping route design in the United States finished vehicle logistics market, because a larger domestic manufacturing footprint is reducing some long-haul import-related moves while increasing the density of regional dispatch cycles and dealer drops. EV handling is adding a more demanding operating layer, since battery condition checks, compliant processing routines, and added dwell requirements are increasing the importance of vehicle processing centers in the United States finished vehicle logistics market. OEM procurement is also moving toward software-led execution, with better visibility, exception management, and routing control becoming more important in carrier selection and contract renewal decisions. The opportunity set is widening beyond pure transport, because compounds, value-added services, and compliance-ready handling are capturing more of the revenue pool as vehicle complexity rises. These conditions keep the United States finished vehicle logistics market on a steady expansion path, while raising the premium on scale, regional density, and disciplined execution across road, rail, and port-linked networks.
Key Report Takeaways
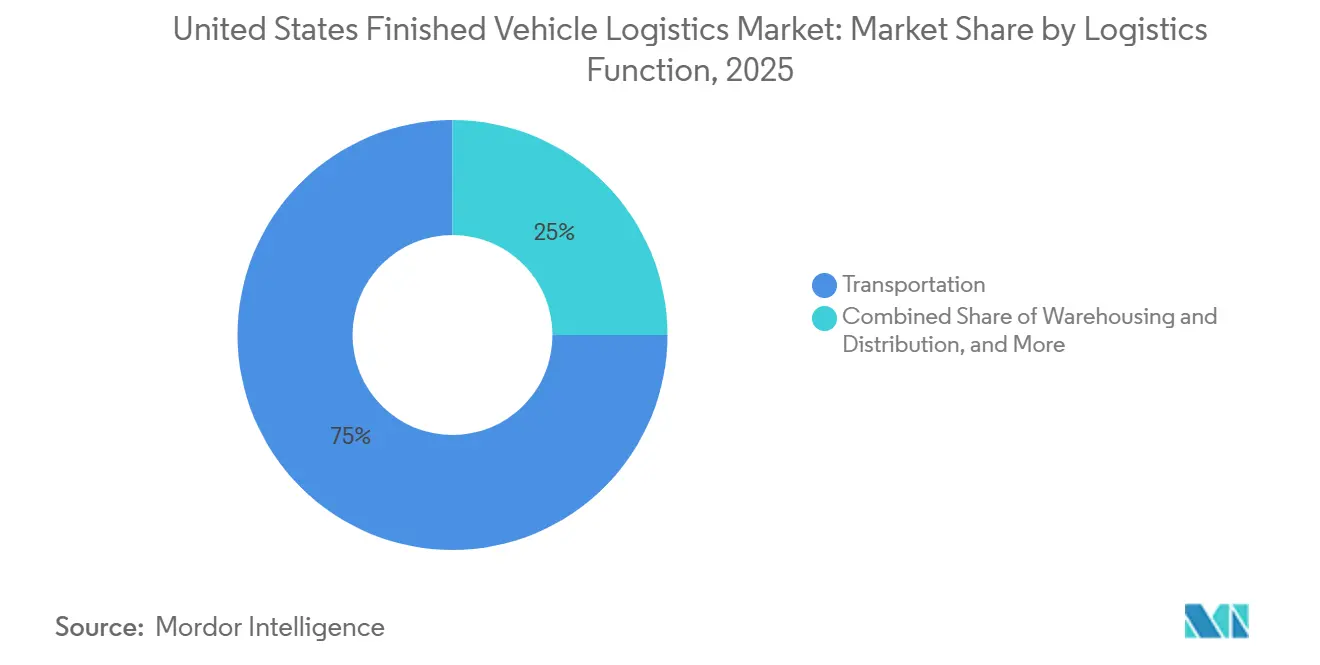
- By logistics function, transportation held 75.00% of the United States finished vehicle logistics market share in 2025, while warehousing and distribution is projected to grow at a 6.62% CAGR through 2031.
- By destination, domestic flows accounted for 76.11% of the United States finished vehicle logistics market size in 2025, while international corridors are forecast to expand at a 6.22% CAGR through 2031.
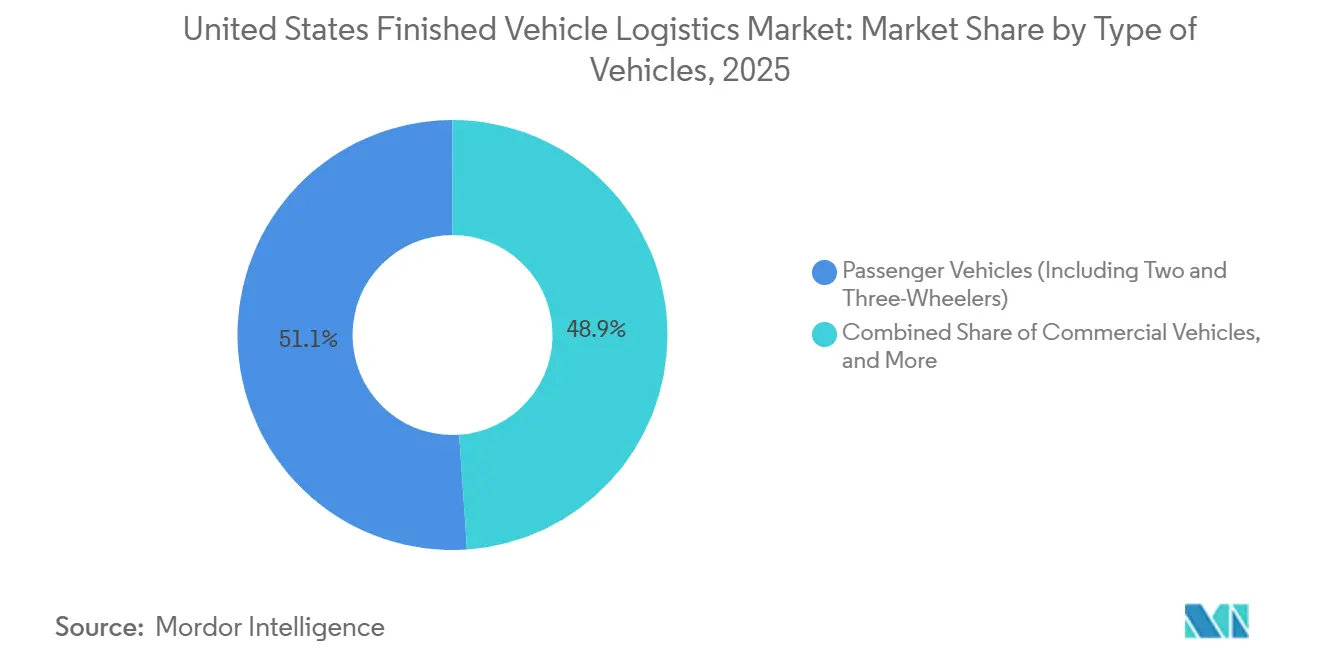
- By type of vehicles, passenger vehicles held 51.07% of the United States finished vehicle logistics market share in 2025, while commercial vehicles are projected to advance at a 5.31% CAGR through 2031.
- By end-user industry, OEMs captured 68.35% of the United States finished vehicle logistics market share in 2025, while the others segment is forecast to grow at a 6.01% CAGR through 2031.
- By geography, the Southeast accounted for 24.34% of the United States finished vehicle logistics market size in 2025 and is also the fastest-growing region at a 6.17% CAGR through 2031.
Note: Market size and forecast figures in this report are generated using Mordor Intelligence’s proprietary estimation framework, updated with the latest available data and insights as of January 2026.
United States Finished Vehicle Logistics Market Trends and Insights
Drivers Impact Analysis*
| Driver | (~) % Impact on CAGR Forecast | Geographic Relevance | Impact Timeline |
|---|---|---|---|
| Reshoring and nearshoring of finished vehicle flows | +1.10% | National, with concentration in Midwest and Southeast | Medium term (2-4 years) |
| Electrification and battery-safe handling requirements | +0.80% | National, key clusters in Southeast and Midwest | Long term (≥ 4 years) |
| OEM demand for just-in-sequence delivery | +0.70% | National, anchored to OEM assembly corridors in Midwest, Southeast, and Southwest | Medium term (2-4 years) |
| Real-time visibility and exception management adoption | +0.60% | National | Short term (≤ 2 years) |
| Cross-border compliance complexity on the United States-Mexico corridors | +0.50% | Southwest United States, with spill-over to the Midwest | Short term (≤ 2 years) |
| Autonomy in yard and damage-reduction workflows | +0.50% | National, with highest impact at high-volume VPCs and rail compounds | Long term (≥ 4 years) |
| Source: Mordor Intelligence | |||
Reshoring and Nearshoring of Finished Vehicle Flows Reshaping Domestic Lane Density
Tariff exposure and origin planning are changing flow design across the United States finished vehicle logistics market, because sourcing decisions now affect not only plant economics but also lane density, compound usage, and the balance between domestic and cross-border vehicle movement. The Baker Institute noted that the auto and auto parts sector accounted for nearly one-quarter of all North American trade in 2024, which shows how even a modest production shift can alter vehicle flows across multiple logistics nodes. A higher domestic production mix reduces some port-linked and long-haul inbound moves, but it also increases the number of shorter dispatch cycles between assembly plants, rail compounds, processing centers, and dealers. That change raises stop density and makes scheduling more demanding, especially where new manufacturing corridors do not yet have the same depth of logistics infrastructure as older automotive regions. In the United States finished vehicle logistics market, providers with wide national coverage and flexible equipment positioning are better placed to capture redistributed domestic volumes without sacrificing service quality. Carriers that depend heavily on fixed cross-border patterns face more route-level risk when OEM sourcing priorities shift faster than asset deployment plans[1].
Electrification and Battery-Safe Handling Requirements Adding Infrastructure Complexity
Electrification is adding a more demanding compliance and facility layer to the United States finished vehicle logistics market, because battery-powered vehicles do not move under the same practical handling assumptions as traditional internal combustion platforms. The Federal Register proposed distinct UN designations for lithium-ion battery vehicles, lithium-metal battery vehicles, and sodium-ion battery vehicles in February 2026, which formalized a more detailed regulatory structure for battery-powered transport[2]. That framework increases the need for accurate documentation, standardized classification, and tighter custody procedures before a vehicle leaves the origin point or enters multimodal transit. Vehicle processing centers now need stronger routines for charge verification, controlled dwell management, and response readiness when battery-related issues arise during handling or staging. AIAG's finished vehicle logistics guideline remains the common language for inspection and reporting across OEMs, road carriers, railroads, and ocean operators, which makes process discipline even more important as EV volumes scale. Providers that already invested in compliant handling procedures and EV-ready compounds are therefore positioned to capture a larger portion of the higher-value work attached to these vehicle flows.
OEM Demand for Just-In-Sequence Delivery Driving Software and Network Precision
OEMs are treating sequencing accuracy as a core service requirement in the United States finished vehicle logistics market, because late, misrouted, or poorly synchronized deliveries now affect plant efficiency, compound dwell, and dealer replenishment at the same time. Stellantis North America selected ICL, in collaboration with Agillence, in May 2026 to optimize its finished vehicle logistics network across North America with dealer-level multimodal routing analysis designed to reduce vehicle dwell time at ports and processing centers. That move shows that routing logic, port flow, and dealer delivery timing are increasingly being managed as one network problem rather than as separate transport transactions. C.H. Robinson's 2026 automotive case study showed that combining dedicated shuttle programs, asset management tools, and real-time telematics improved predictability in automotive movements that previously ran on reactive decision-making. In the United States finished vehicle logistics market, providers that cannot connect transport execution with plant, compound, and dealer workflows will find it harder to defend contract value as OEM expectations continue to rise. Providers that can validate timing-sensitive moves quickly and consistently are more likely to expand wallet share with large manufacturing accounts.
Real-Time Visibility and Exception Management Adoption Becoming a Contract Prerequisite
Visibility tools are becoming central to service quality in the United States finished vehicle logistics market, because OEMs increasingly judge suppliers on how quickly they identify, communicate, and correct disruptions before dealer delivery timelines are affected. Penske Logistics received its sixth GM Supplier of the Year Award in June 2026, and the company stated that the recognition reflected new digital tools for real-time visibility and predictive alerts across GM's North American supply chain. IDENTEC Solutions said that dynamic routing, ETA prediction, yard optimization, and live capacity reservation define production-grade finished vehicle logistics platforms in 2026, which shows how software capability is moving into day-to-day operating standards. These tools reduce the time between an exception event and the corrective action, which helps protect dealer commitments, improve compound throughput, and lower the cost of manual coordination. Focalx AI reported that automated damage detection found substantially more incidents than manual records, which points to the cost of weak evidence capture and long exception cycles in vehicle logistics operations. The United States finished vehicle logistics market is therefore rewarding providers that can scale reliable exception management, not just providers that can place trucks, railcars, or vessel slots.
Restraints Impact Analysis*
| Restraint | (~) % Impact on CAGR Forecast | Geographic Relevance | Impact Timeline |
|---|---|---|---|
| Driver shortages and specialized carrier capacity constraints | -0.80% | National, acute in Midwest, Southeast, and Texas | Short term (≤ 2 years) |
| Auto rack and Ro-Ro bottlenecks in peak lanes | -0.50% | National, most severe at major Ro-Ro terminals and Midwest rail ramps | Medium term (2-4 years) |
| Damage, claims, and rework costs on high-value vehicles | -0.40% | National | Medium term (2-4 years) |
| Regulatory and trade friction across border movements | -0.60% | Southwest United States, with spill-over to Midwest logistics hubs | Short term (≤ 2 years) |
| Source: Mordor Intelligence | |||
Driver Shortages and Specialized Carrier Capacity Constraints Tightening Supply
Specialized road capacity remains a limiting factor in the United States finished vehicle logistics market, because finished vehicle hauling requires a skill base that is narrower than the broader truckload labor pool. Car-hauler roles involve multi-level loading discipline, damage prevention during loading and unloading, route familiarity with dealer drops, and operating standards that often differ by OEM program. This makes replacement hiring slower, even when general freight hiring conditions appear to improve, because new drivers need hands-on training before they can be deployed safely on revenue-critical automotive lanes. When capacity tightens, carriers can favor better-yielding moves, which leaves lower-priority lanes exposed to tender rejection, longer wait times, and more variable service. The effect is especially visible when production surges, regional inventories tighten, or dealer replenishment schedules become less forgiving. In the United States finished vehicle logistics market, this creates a persistent ceiling on how quickly road capacity can respond when demand rises faster than training and onboarding cycles.
Damage, Claims, and Rework Costs on High-Value Vehicles Raising Margin Pressure
Damage exposure remains a direct cost restraint on the United States finished vehicle logistics market, because even minor handling incidents can delay delivery, trigger rework, and keep vehicles in exception status for longer than planned. AIAG's M-22 finished vehicle logistics guideline standardizes inspection and reporting language across logistics handoffs, underscoring the importance of condition capture in multi-party automotive movements. When inspection quality varies by location or operator, claims resolution slows, and vehicles remain parked rather than moving into dealer inventory or fleet delivery. Focalx AI linked image-based detection to AIAG M-22 coding and automated claims workflows, which shows how operators are trying to shorten the time between incident identification and administrative closure. The cost exposure is rising because vehicle values are higher, repairs are more specialized, and documentation expectations are stricter than they were in older, less digitized vehicle handling models. Providers with weak evidence capture or inconsistent yard discipline, therefore, face margin erosion that extends well beyond the direct cost of physical damage[3].
*Our forecasts treat driver/restraint impacts as directional, not additive. The impact forecasts reflect baseline growth, mix effects, and variable interactions.
Segment Analysis
By Logistics Function: Road and Rail Remain the Revenue Base While Service Content Expands
Transportation held 75.00% of the United States finished vehicle logistics market size in 2025, and road delivery remained critical on the final leg from rail ramp or port to dealer because that last handoff is where schedule precision and damage control are tested most directly. Rail still moved a large share of new vehicles by unit count, but the road connection kept trucking central to revenue formation because dealer delivery, compound transfer, and appointment-sensitive moves are priced separately from the longer line-haul leg. That structure means the United States finished vehicle logistics market still depends on road and rail coordination rather than on one dominant mode, especially when port arrivals, compound processing, and dealer release timing do not line up perfectly. Multimodal execution matters because delays on either the rail or trucking side can disrupt inventory positioning at the point where vehicles are expected to move into retail or fleet channels. Providers that can coordinate rail interfaces, compound staging, and dealer drop scheduling more tightly are better placed to protect utilization and service consistency as lane patterns continue to shift.
Warehousing and distribution is projected to grow at a 6.62% CAGR from 2026 to 2031, making this part of the United States finished vehicle logistics market size more important to overall value capture as processing and staging requirements become more demanding. EV-related preparation is a major driver, because compounds increasingly need charging capability, battery condition checks, controlled dwell routines, and compliant pre-shipment inspection before a vehicle can move into the next transport stage. Kenco Group said in May 2026 that its warehousing footprint expanded 24.7% year over year to 45.9 million square feet across 134 United States sites, which shows how demand for high-quality distribution space is extending well beyond a narrow set of legacy automotive locations. Value-added services are also drawing more attention because accessory fitting, premium handling, inspection support, and specialized movement of high-value vehicles deliver stronger unit economics than pure line-haul work. ACERTUS expanded into exotic and luxury vehicle transport through its March 2025 acquisition of Bluestar Auto Movers, which shows how service breadth is becoming a competitive lever in higher-margin logistics niches.

By Destination: Domestic Volume Leads While International Corridors Carry Greater Operational Complexity
Domestic flows accounted for 76.11% of the United States finished vehicle logistics market share by destination in 2025, which kept the segment anchored in plant-to-compound and compound-to-dealer movements that operate within a national transport and distribution framework. This reflects the concentration of the United States assembly activity, dealership networks, and fleet delivery programs inside national borders, where routing is simpler than on international corridors but still highly dependent on timing discipline between rail ramps, compounds, and final delivery windows. Domestic movements are operationally more controllable than cross-border or ocean-linked flows, yet they still require dense dispatch planning when lane volumes shift between regions or when OEM output changes by plant. As production localization advances, some domestic lanes become shorter and more frequent, which increases the number of stops and handoffs that carriers must manage in a single operating cycle. Providers with flexible dispatch systems and wider lane coverage can capture these route changes more effectively than operators tied to a narrower set of corridors.
International corridors are projected to grow at a 6.22% CAGR from 2026 to 2031, so the United States finished vehicle logistics market size attached to cross-border and seaborne vehicle movement is still expanding despite tighter compliance needs and more complex paperwork expectations. The segment is split between imports, exports, and lower-volume specialized flows, each of which places different demands on documentation, dwell management, and mode selection. C.H. Robinson said in April 2026 that softer new-vehicle demand was easing some outbound pressure while automotive logistics strategies were shifting toward parts, aftermarket goods, and used vehicle flows, which shows how providers increasingly need flexible handling models instead of single-purpose transport setups. International operators can create more value when they support compliance-heavy movements, manage port or compound dwell more tightly, and offer mode flexibility where fixed service patterns do not fit customer requirements well. The international portion of the United States finished vehicle logistics market therefore carries greater operating complexity, but it also leaves more room for differentiated service and higher-value coordination work.
By Type of Vehicles: Passenger Volume Leads While Commercial EV Mix Changes Asset Productivity
Passenger vehicles, including two and three-wheelers, held 51.07% of the United States finished vehicle logistics market share in 2025, supported by the steady scale of dealer replenishment and consumer-oriented deliveries that keep mainstream network utilization relatively high across most automotive corridors. This segment benefits from broad demand coverage, repeated delivery patterns, and a large installed base of handling knowledge across carriers, compounds, and rail-linked automotive facilities. Off-highway vehicles remain the smallest revenue segment, yet they stay relevant where infrastructure, construction, and energy projects sustain movement volumes even when passenger vehicle demand is less favorable. Rail retains a natural role in long-haul commercial and off-highway moves because it can absorb heavier equipment and larger unit groupings efficiently over longer distances.
Commercial vehicles are forecast to grow at a 5.31% CAGR through 2031, driven by fleet replacement cycles, e-commerce-linked delivery demand, and procurement programs that are gradually expanding the mix of battery-powered units. The commercial segment is changing throughput economics because heavier EV vans, trucks, and utility platforms reduce slot availability on existing transport equipment even when dispatch frequency remains unchanged. That weight effect lowers unit productivity and forces carriers to think more carefully about trailer configuration, route economics, and asset utilization within the United States finished vehicle logistics market. Across vehicle classes, the United States finished vehicle logistics industry rewards operators that can balance safe loading, consistent throughput, compliant battery handling, and low damage incidence without weakening service reliability.
By End-User Industry: OEM Contracts Dominate While Fleet-Oriented Channels Expand Faster
OEMs accounted for 68.35% of the United States finished vehicle logistics market share by end-user industry in 2025, which kept contract allocation in the market strongly tied to manufacturing output, dealer replenishment schedules, and the service standards set by large vehicle makers. Their scale gives them influence over route design, data-sharing expectations, timing requirements, and the network structures that carriers and compound operators must support to remain relevant in future tenders. Dealers remained the next major buyer group, and their demand stayed closely linked to model availability, regional inventory needs, and the frequency of deliveries required to keep retail lots stocked without excessive dwell. That growth is widening demand for providers that can handle battery-ready programs, tighter scheduling windows, and more customized operating routines than traditional dealer-bound movements usually require. This part of the United States finished vehicle logistics industry is becoming less uniform because end-user expectations now differ more clearly by channel, with each customer group placing weight on a different mix of price, visibility, handling quality, and program flexibility. The United States finished vehicle logistics industry is also adjusting to more demanding documentation and handling rules for battery-powered commercial vehicles, because regulatory clarity is making specialized transport requirements harder to avoid or defer. The Federal Register proposal for UN3556, UN3557, and UN3558 created a clearer classification structure for lithium-ion, lithium-metal, and sodium-ion battery vehicles, which raises the compliance burden for operators serving commercial EV programs.
The others segment, which includes rental companies, fleet leasing firms, and government and defense fleets, is projected to grow at a 6.01% CAGR through 2031. OEM contracts tend to reward scale, sequencing discipline, and strong exception management because failures can affect multiple distribution nodes at once. Dealer programs depend more heavily on dependable replenishment and quick resolution when timing or damage issues arise close to the final point of sale. Rental, leasing, government, and defense programs create room for differentiated service because they may require dedicated handling, reverse logistics, controlled staging, or stronger documentation around vehicle status. As those channels grow at different speeds, the United States finished vehicle logistics market should favor providers that can serve multiple end-user needs without forcing every account into the same operating template.
Geography Analysis
The Southeast led with 24.34% of revenue in 2025 and is forecast to expand at a 6.17% CAGR through 2031, which makes it the strongest regional pocket of the United States finished vehicle logistics market by both current scale and growth momentum. Its position reflects the alignment between assembly activity, processing demand, and outbound distribution needs that now support both transport-intensive and service-intensive vehicle flows across the region. The Southeast is benefiting from a broader shift of automotive capacity toward newer southern manufacturing corridors, which is drawing more carrier attention, compound investment, and route redesign into the area. Wallenius Wilhelmsen secured a 20-year lease at the Port of Brunswick, which signals confidence in long-run vehicle throughput and export-linked handling demand in the broader southeastern corridor. As production and port activity deepen together, operators with dense coverage across southeastern states should gain better network balance and stronger asset utilization.
The Midwest remains a critical logistics base because it combines long-established assembly footprints, rail connectivity, experienced labor pools, and compound infrastructure that still support a large share of national vehicle movement. That legacy position keeps the region important in the United States finished vehicle logistics market even as faster growth shifts toward southern corridors. The Southwest carries the highest compliance burden because Mexico-facing lanes require tighter documentation, origin traceability, and more disciplined handoff control than purely domestic routes. CPKC said in March 2026 that it certified 14 new Site Ready locations across North America, including United States locations that support future manufacturing and compound access on its network, which strengthens its role in automotive corridor development.
The West remains important for Ro-Ro-linked handling and port-led vehicle distribution, while the Northeast continues to function mainly as an import-facing gateway with inland rail connections into larger consumption and distribution zones. Port of Portland's auto cargo forecast highlights how coordinated port and rail planning supports inland distribution efficiency from coastal entry points. Across regions, higher trucking costs and continuing rail investment are gradually improving the relative appeal of rail on longer lanes within the United States finished vehicle logistics market. Regional winners will be the operators that combine compliant handling, dependable interchange management, and flexible capacity across road, rail, port, and compound nodes[4].
Competitive Landscape
The United States finished vehicle logistics market remains moderately concentrated at the top and fragmented across the broader field, because national road carriers, ocean Ro-Ro specialists, and Class I railroads each control different links of the delivery chain rather than competing from a single, uniform operating base. This structure limits the likelihood of dominance by one model, but it still gives an advantage to providers that can connect multiple legs of the vehicle journey with fewer disruptions and better data visibility. Wallenius Wilhelmsen strengthened its position through USD 4.8 billion in multi-year contract renewals completed in 2025 and a contract backlog above USD 10 billion, which supports long-term scale in vehicle shipping and port-related automotive handling. CPKC is also strengthening its automotive presence by widening access to rail-served industrial sites and future compound locations across its North American network. These advantages matter because OEMs and large fleet customers increasingly prefer providers that can pair physical scale with more predictable service across several transport modes.
Technology deployment is also changing the basis of competition in the United States finished vehicle logistics market, because contract decisions now reflect operating visibility and exception response rather than fleet assets alone. Penske Logistics showed this in June 2026 when GM recognized its digital visibility and predictive alert tools as part of its supplier award decision expanded into luxury and exotic vehicle transport through its March 2025 acquisition of Bluestar Auto Movers, which added a higher-service capability to its broader automotive logistics platform. Providers that can combine software capability with specialized handling are moving toward the most defensible and higher-value contract spaces.
Competitive opportunities are opening fastest in EV-ready processing, premium handling, damage-control workflows, and compliance-heavy cross-border services where customers place greater value on discipline and process reliability. Smaller regional operators can still compete on local density and responsiveness, but the investment bar is rising because data systems, training, and certified procedures now matter more in the United States finished vehicle logistics market than they did when standard line-haul was the main differentiator. The United States finished vehicle logistics market is therefore separating into providers that can scale complex operations and providers that remain more limited to simpler lane structures or narrower customer needs. This pattern supports gradual consolidation pressure at the upper tier even though the wider market base remains fragmented.
United States Finished Vehicle Logistics Industry Leaders
-
United Road Services
-
Wallenius Wilhelmsen
-
Glovis America, Inc.
-
Cassens Transport Company
-
Proficient Auto Logistics, Inc.
- *Disclaimer: Major Players sorted in no particular order
Recent Industry Developments
- May 2026: Stellantis North America selected ICL, in collaboration with Agillence, to optimize its finished vehicle logistics network across North America. The deployment enables dealer-level multimodal routing analysis, supports evaluation of alternative network configurations, and is expected to reduce vehicle dwell time at ports and VPCs while supporting Stellantis's cost-savings initiatives.
- March 2026: CPKC certified 14 new Site-Ready rail-served industrial development locations across six states of the United States, three Canadian provinces, and two Mexican states, adding more than 6,600 acres of immediately developable land and expanding its automotive compound and manufacturing site access across the trinational network.
- January 2026: Wallenius Wilhelmsen signed a one-year shipping contract with a major Asian automotive and heavy equipment manufacturer generating approximately USD 130 million in revenue. By year-end 2025, the company had secured USD 4.8 billion in multi-year contract renewals, building a combined contract backlog of over USD 10 billion.
- December 2025: ACERTUS partnered with 1-800-PACK-RAT to deliver integrated nationwide vehicle transport services for residential and commercial movers, enabling 1-800-PACK-RAT customers to access instant auto shipping quotes and arrange transport through ACERTUS's nationwide carrier network and logistics platform.
United States Finished Vehicle Logistics Market Report Scope
| Transportation | Road |
| Air | |
| Sea and Inland Waterways | |
| Rail | |
| Warehousing and Distribution | |
| Value-added Services and Others |
| Domestic | |
| International | Import/Inbound |
| Export/Outbound |
| Passenger Vehicles (Including Two and Three-Wheelers) |
| Commercial Vehicles |
| Off-Highway Vehicles |
| OEMs |
| Dealers |
| Others (Rental Companies, Fleet Leasing Companies, Government and Defense Fleets, etc.) |
| Northeast |
| Southeast |
| Midwest |
| Southwest |
| West |
| By Logistics Function | Transportation | Road |
| Air | ||
| Sea and Inland Waterways | ||
| Rail | ||
| Warehousing and Distribution | ||
| Value-added Services and Others | ||
| By Destination | Domestic | |
| International | Import/Inbound | |
| Export/Outbound | ||
| By Type of Vehicles | Passenger Vehicles (Including Two and Three-Wheelers) | |
| Commercial Vehicles | ||
| Off-Highway Vehicles | ||
| By End-user Industry | OEMs | |
| Dealers | ||
| Others (Rental Companies, Fleet Leasing Companies, Government and Defense Fleets, etc.) | ||
| By Region | Northeast | |
| Southeast | ||
| Midwest | ||
| Southwest | ||
| West | ||
Key Questions Answered in the Report
How large is the United States finished vehicle logistics market in 2026?
The United States finished vehicle logistics market stands at USD 40.29 billion in 2026 and is projected to reach USD 51.11 billion by 2031 at a 4.87% CAGR.
Which logistics function leads revenue in finished vehicle movement across the United States?
Transportation is the largest function, with 75.00% of revenue in 2025, while warehousing and distribution is the fastest-growing function at a 6.62% CAGR through 2031.
Why is the Southeast leading finished vehicle logistics growth?
The Southeast held 24.34% of revenue in 2025 and is forecast to grow at 6.17% CAGR, supported by growing assembly activity, processing demand, and port-linked automotive flows.
How are EV requirements changing vehicle logistics operations?
EV handling is raising the need for charge verification, compliant processing, and stronger condition management, which is increasing the role of specialized vehicle processing centers and standardized reporting workflows.
Which end-user group is expanding fastest through 2031?
The others segment, which includes rental, fleet leasing, government, and defense users, is the fastest-growing end-user group with a 6.01% CAGR through 2031.
What is shaping competition among the United States finished vehicle logistics providers in 2026?
Scale still matters, but competition is shifting toward digital visibility, exception management, EV-ready handling, and specialized service capability, especially in premium, fleet, and compliance-heavy logistics programs.