
United States Fiber Optic Cable Market Size and Share
Market Overview
| Study Period | 2020 - 2031 |
|---|---|
| Forecast Data Period | 2026 - 2031 |
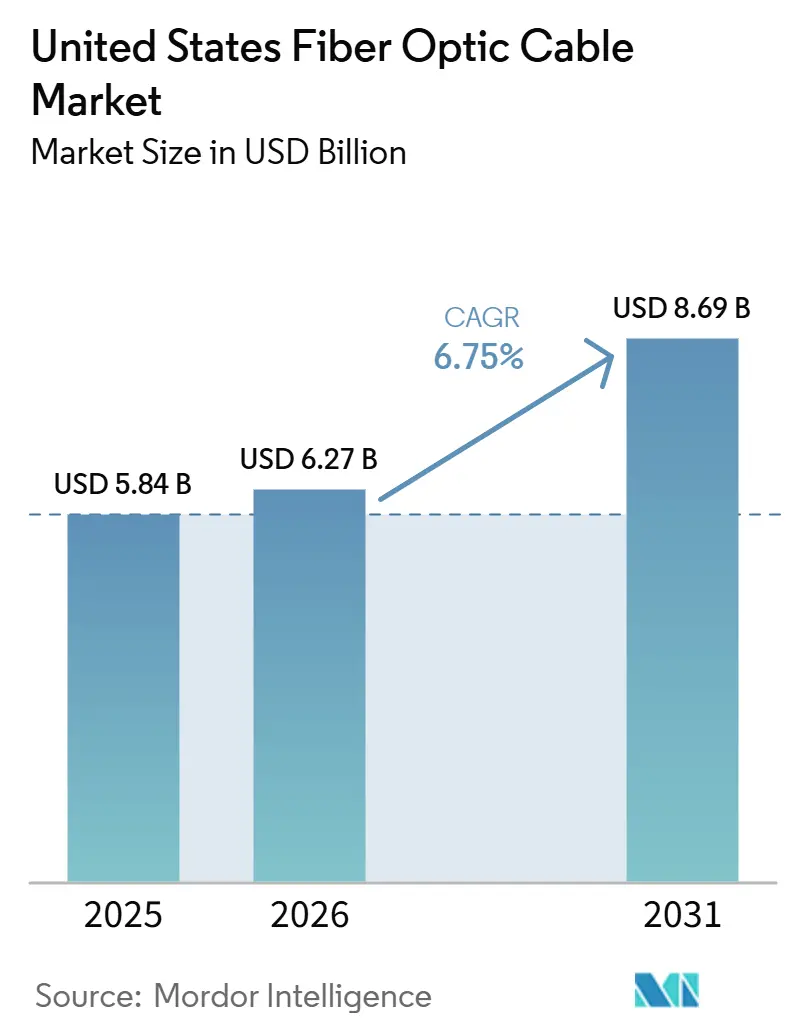
| Base Year Market Size (2025) | USD 5.84 Billion |
| Market Size (2026) | USD 6.27 Billion |
| Market Size (2031) | USD 8.69 Billion |
| Growth Rate (2026 - 2031) | 6.75 % |
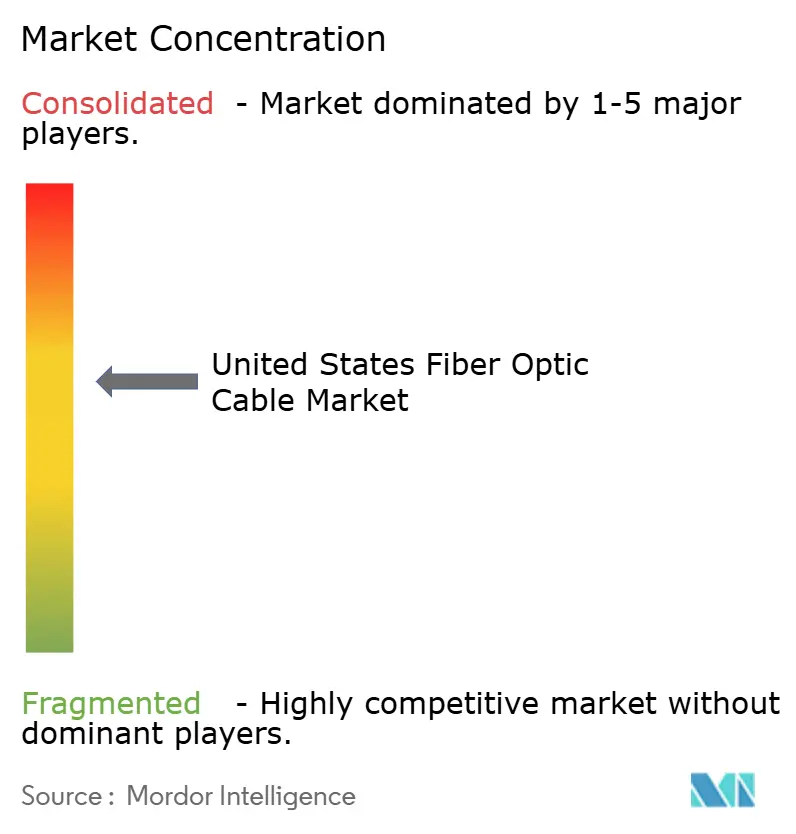
| Market Concentration | Medium |
Major Players *Disclaimer: Major Players sorted in no particular order Image © Mordor Intelligence. Reuse requires attribution under CC BY 4.0. | |
United States Fiber Optic Cable Market Analysis by Mordor Intelligence
The United States fiber optic cable market size is projected to expand from USD 5.84 billion in 2025 and USD 6.24 billion in 2026 to USD 8.69 billion by 2031, registering a CAGR of 6.75% between 2026 and 2031. Demand is moving beyond residential broadband because AI training systems require links between GPU clusters that operate together across long distances. Private spending by cloud providers is supporting domestic manufacturing investments and longer supply agreements. Federal broadband funding supports rural construction, although technology-neutral rules can direct some locations toward fixed wireless or low-Earth-orbit satellite services. Higher construction costs, permit delays, and shortages of trained technicians are making installation speed a more important purchasing factor. The United States fiber optic cable market is, therefore, rewarding suppliers that can provide compliant cable, high-density connectivity, and simpler field installation.
Key Report Takeaways
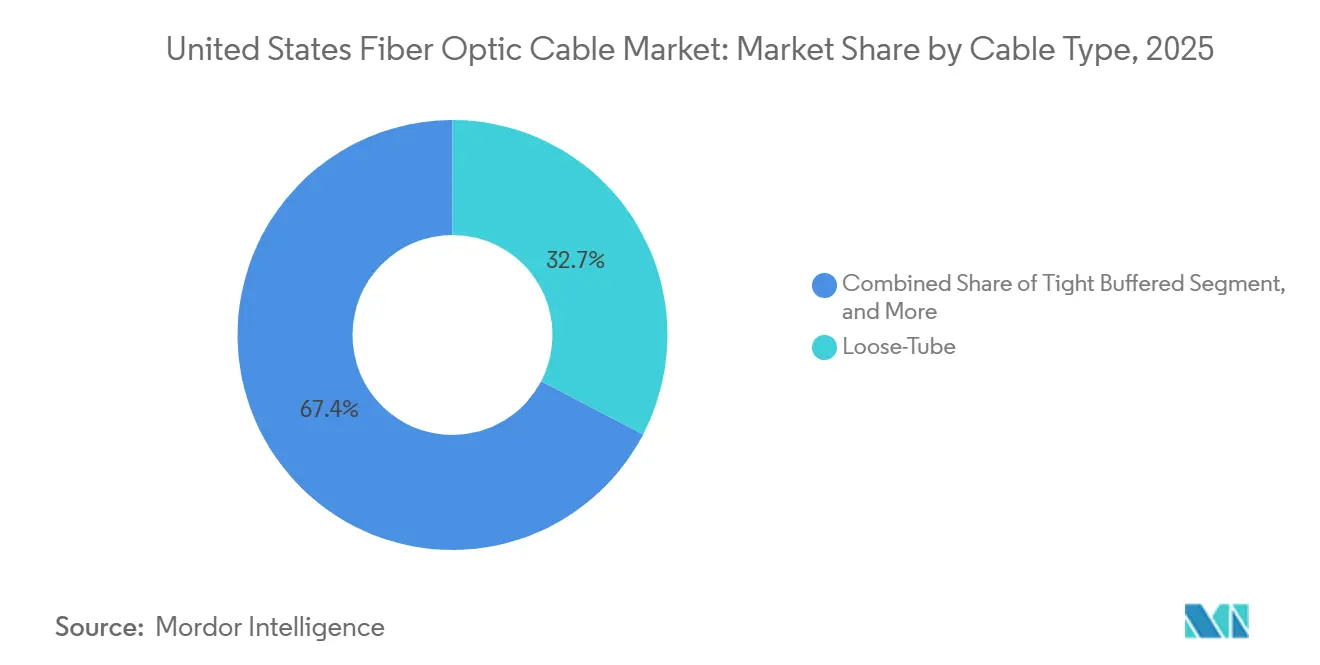
- By cable type, loose-tube cables held 32.65% of the United States fiber optic cable market share in 2025, while tight-buffered cables are projected to expand at a 7.80% CAGR through 2031.
- By mode, single-mode fiber held 61.92% of the United States fiber optic cable market share in 2025, while multimode fiber is projected to expand at a 7.30% CAGR through 2031.
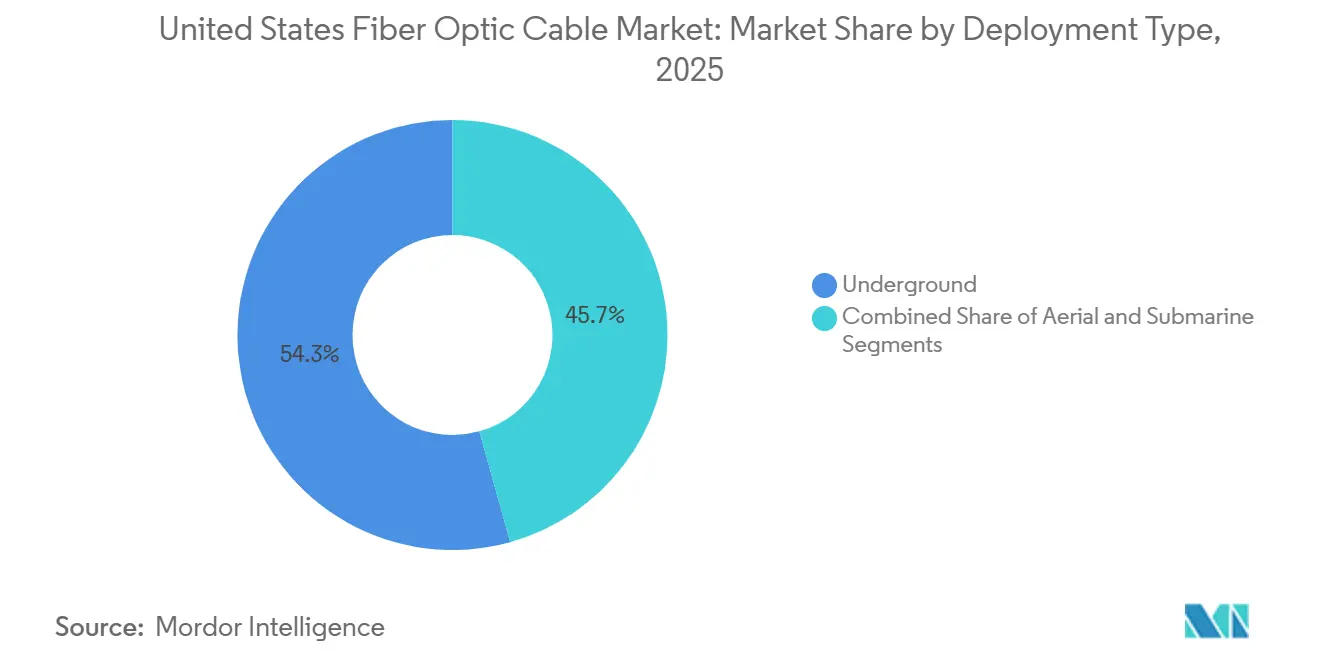
- By deployment type, underground deployment accounted for 54.32% of the United States fiber optic cable market in 2025, while submarine deployment is projected to expand at an 8.90% CAGR through 2031.
- By end-user industry, telecommunications accounted for 43.57% of the United States fiber-optic cable market in 2025 and is projected to expand at a 7.20% CAGR through 2031.
Note: Market size and forecast figures in this report are generated using Mordor Intelligence’s proprietary estimation framework, updated with the latest available data and insights as of January 2026.
United States Fiber Optic Cable Market Trends and Insights
Drivers Impact Analysis*
| Driver | (~) % Impact on CAGR Forecast | Geographic Relevance | Impact Timeline |
|---|---|---|---|
| AI Data Center Interconnect and 800G/1.6T Deployment | +2.0% | National, concentrated in Northern Virginia, Texas, Pacific Northwest, and Ohio data center corridors | Short term (≤ 2 years) |
| Accelerating Fiber-to-the-Home and 5G X-Haul Rollouts | +1.5% | National, with dense metro deployment in Southeast, Mid-Atlantic, and Great Plains | Short term (≤ 2 years) |
| Federal and State Broadband Funding, Including BEAD and RDOF | +1.2% | National, with early construction in rural Southeast, Appalachia, and Great Plains | Medium term (2-4 years) |
| Fiberization of Utility, Grid, and Critical Infrastructure Networks | +0.8% | National, with early gains in Texas, Tennessee, Ohio, and Arizona | Medium term (2-4 years) |
| Domestic Manufacturing and Build America, Buy America Procurement | +0.5% | National, with manufacturing hubs in North Carolina, South Carolina, and Georgia | Medium term (2-4 years) |
| High-Fiber-Count and Pre-Terminated Cable Adoption to Offset Installation Labor Constraints | +0.4% | National, with early adoption in the Northeast, California, and Pacific Northwest | Short term (≤ 2 years) |
| Source: Mordor Intelligence | |||
AI Data Center Interconnect and 800G/1.6T Deployment Fuels Structural Cable Demand
The United States fiber optic cable market is benefiting from the shift from isolated data centers to distributed AI GPU clusters. These clusters need ultra-low-loss, high-fiber-count cable routes that can connect facilities across tens or hundreds of miles. These requirements increase the physical infrastructure needed to operate geographically distributed systems as a unified computing environment. Inside facilities, 800G interfaces support wider use of MPO-24 ribbon connections in new construction. The shift toward 1.6T optical interconnects in 2026 requires more fibers and tighter production tolerances. This favors manufacturers that can sustain product development and deliver consistent high-density products.
Accelerating Fiber-to-the-Home and 5G X-Haul Rollouts Underpin Volume Demand
Fiber broadband infrastructure reached more than 60% of US households by the end of 2025, adding 11.8 million homes during the year.[1]Fiber Broadband Association and Cartesian, “Fiber Deployment Cost Annual Report 2025,” Fiber Broadband Association Fiber-to-the-home construction remains the main volume driver for the United States fiber optic cable market, even as AI-related demand rises. Mid-band 5G densification uses more fiber strands per route mile because cell sites need connections for several sectors and regional aggregation. Carriers are deploying fronthaul, midhaul, and broadband fiber in shared outside-plant systems, which is driving demand for higher-fiber-count cable. Tight-buffered cable is useful in last-mile and cell-site settings because technicians can terminate it without the need for intermediate breakout hardware. Suppliers that can serve both broadband and mobile applications from the same product range can improve their product mix during the deployment cycle.
Federal and State Broadband Funding, Including BEAD and RDOF, Provides Demand Support
The USD 42.45 billion BEAD program is the largest federal broadband commitment in the United States. By April 2026, NTIA had approved 53 of 56 eligible states and territories, and construction contracts were expected to begin in summer 2026.[2]National Telecommunications and Information Administration, “BEAD Program,” NTIA Build America, Buy America requirements apply to federally funded cable and require optical preform fabrication, fiber draw, buffering, stranding, and jacketing to occur in the United States.[3]U.S. Department of Commerce, “Buy America Requirements for Manufactured Products,” Federal Register Domestic producers stated that annual US production capacity was 135 million fiber-kilometers, while BEAD-related demand would use less than 5% of that capacity at its peak. California's approved plan directed 53% of its USD 1.8 billion allocation to fiber and 27% to low-Earth-orbit satellites, which limits the share of program spending that becomes cable purchases. The program gives compliant domestic suppliers a clearer demand base, but it also requires close coordination between material delivery and project schedules.
Fiberization of Utility, Grid, and Critical Infrastructure Networks Opens a New Demand Vertical
Utilities are adding fiber for grid automation through procurement cycles that are separate from broadband grants. Trico Electric Cooperative began construction of its SmartGrid Fiber Backbone in 2026 to connect electric substations, with completion targeted for fall 2026.[4]Trico Electric Cooperative, “Construction Has Begun on Trico’s SmartGrid Fiber Backbone,” Trico Electric Cooperative These projects often use armored and loose-tube cable, which also serves broadband and data center customers. Tennessee utility FiberNET upgraded its edge network to 25G PON in 2026 while using an 800 Gbps long-haul backbone. Utility-owned networks, therefore, use specifications closer to those of commercial telecom networks. This adds a separate source of demand to the United States fiber-optic cable market and increases competition for domestic supply. The opportunity is strongest for manufacturers that can support direct-burial, utility-grade, and high-capacity network requirements.
Restraints Impact Analysis*
| Restraint | (~) % Impact on CAGR Forecast | Geographic Relevance | Impact Timeline |
|---|---|---|---|
| Civil Works, Permitting, and Right-of-Way Cost Inflation | -1.0% | National, most severe in the Northeast, California, and dense urban corridors | Short term (≤ 2 years) |
| Shortage of Qualified Splicing, Testing, and Outside-Plant Technicians | -0.8% | National, most severe in the Southeast and rural states with active BEAD pipelines | Short term (≤ 2 years) |
| Fixed-Wireless and Low-Earth-Orbit Satellite Substitution in Sparse Areas | -0.6% | Rural and suburban markets, particularly in western plains, Appalachia, and tribal lands | Medium term (2-4 years) |
| Preform, Fiber, and Specialized Component Supply Volatility | -0.5% | National, affecting all manufacturers, with greater exposure for import-dependent supply chains | Medium term (2-4 years) |
| Source: Mordor Intelligence | |||
Civil Works, Permitting, and Right-of-Way Cost Inflation Compresses Project Economics
Civil works and permits are now more important to project economics than cable pricing in many projects. Median underground deployment costs reached USD 18.00 per foot in 2025, while aerial costs reached USD 8.00 per foot. The same survey found that 88% of respondents expected higher costs in 2026 because of labor, materials, permitting, and make-ready work. Permits can account for 10% of a project budget and reach 30% in difficult jurisdictions. Rail crossings, transportation department approvals, environmental reviews, historic districts, and municipal moratoria can extend schedules by weeks or months. Microtrenching can reduce costs, but inconsistent restoration rules limit its use across many jurisdictions.
Shortage of Qualified Splicing, Testing, and Outside-Plant Technicians Lengthens Build Schedules
A shortage of trained splicers, fusion testers, and outside-plant workers limits how quickly installed cable can enter service. Labor and materials were the main reasons operators expected higher deployment costs in 2026. The timing of BEAD construction can intensify regional shortages as approved states mobilize projects in rural areas simultaneously. Pre-terminated, high-fiber-count cable assemblies can reduce the field work required for each connection. Clearfield introduced its NOVA Platform in January 2026, and CommScope announced FastSelfClean technology in May 2026 to simplify high-density installation. These products reduce installation effort, but they do not remove the need for a larger skilled workforce during the construction peak
*Our forecasts treat driver/restraint impacts as directional, not additive. The impact forecasts reflect baseline growth, mix effects, and variable interactions.
Segment Analysis
By Cable Type: Loose-Tube Cables Lead Outdoor Infrastructure Demand
Loose-tube cables accounted for 32.65% of the United States fiber optic cable market in 2025. Their moisture resistance and thermal performance make them suitable for outside-plant, aerial, and long-haul routes used by fiber-to-the-home, 5G backhaul, and utility grid projects. Ribbon cable is used in high-density outside-plant builds because mass fusion splicing reduces time per splice, while armored cable is used for direct-burial utility and industrial routes exposed to crushing forces. Corning launched its Contour Flow micro cable at OFC 2026 with 1,728 fibers in nearly half the diameter of legacy ribbon cable and a low-friction jacket for air-jet installation. These designs show that installation method and fiber density are becoming important within established outdoor cable categories.
Tight-buffered cable is projected to grow at a 7.80% CAGR through 2031, the fastest rate among cable types in the United States fiber optic cable industry. Its direct-termination capability suits 800G data center links and enterprise last-mile installations, while pre-terminated trunks place tight-buffered fibers and MPO connectors within a common jacket before delivery. These assemblies can reduce field-termination time by more than half compared with field-polished connections, and ANSI/TIA-568 standards support their use for indoor runs. The move toward 1.6T interconnects is expected to increase fiber counts in these assemblies. Manufacturers with connector and assembly capability can capture cable and connectivity revenue, while cable-only suppliers may face margin pressure.



By Mode: Single-Mode Leads Infrastructure While Multimode Gains AI Demand
Single-mode fiber accounted for 61.92% of the United States fiber-optic cable market in 2025. It remains necessary for metro, long-haul, and fiber-to-the-home networks because no practical substitute serves these distances at the same scale. Its installed base supports demand across public broadband programs and commercial routes. Multimode fiber is projected to grow at a 7.30% CAGR from 2026 to 2031 as AI GPU clusters increase demand for OM4 and OM5 cable in 800G intra-facility networks. IEEE 802.3ck has reinforced the use of multimode in hyperscale procurement specifications for short-reach connections.
Multimode demand is extending beyond lower-cost enterprise local area networks. In AI facilities, 800GBASE-SR8 over OM4 can support intra- and inter-rack links up to 100 meters, with lower transceiver costs than comparable single-mode configurations. OM5 supports wavelength-division multiplexing over short distances and can help manage ribbon density inside server racks. The choice between single-mode and multimode depends heavily on transceiver pricing, which producers must include in demand planning. Prysmian and Corning are positioning OM4 and OM5 as AI data center products, supporting a higher-value mix in the United States fiber optic cable market and favoring suppliers that can provide cable and connectivity components.
By Deployment Type: Underground Leads While Submarine Connections Expand Fastest
Underground deployment accounted for 54.32% of the United States fiber optic cable market in 2025. Buried conduit can operate for more than 30 years and has lower annual maintenance needs than aerial systems, supporting its use despite higher trenching costs. Aerial deployment remains common in rural and mountainous areas where excavation is difficult or costly. The Fiber Broadband Association reported 14% aerial cost inflation in 2025, compared with 3% for underground deployment, while higher pole attachment fees and make-ready costs are causing some operators to reassess aerial construction. Columbus, Ohio’s dual-use grid corridor model embeds fiber conduit during electrical work and can improve underground economics on utility routes.
Submarine deployment is projected to grow at an 8.90% CAGR from 2026 to 2031. Google’s Nuvem system landed in Myrtle Beach, South Carolina, in May 2026 with 16 fiber pairs and 384 Tbps design capacity, while Bifrost reached ready-for-service status in 2025 with 260 Tbps capacity between Singapore and the United States West Coast. Google’s Firmina cable, with 240 Tbps capacity across 14,517 km, entered service in 2026 between the US East Coast and South America, and Vtal announced the 9,700 km Synapse cable between New Jersey and São Paulo. The FCC’s June 2026 draft order extends licensing requirements to owners of Submarine Line Terminal Equipment. The rule adds compliance steps that can affect procurement lead times and vendor qualification.
By End-User Industry: Telecommunications Holds Scale and Shapes Volume
Telecommunications held 43.57% of the United States fiber optic cable market in 2025 and is projected to grow at a 7.20% CAGR through 2031. It is both the largest and fastest-growing end-user category due to BEAD construction, fiber-to-the-home expansion, and 5G xHaul densification, with direct purchasing through telecom operators. This position makes telecommunications the main volume channel through the forecast period. Power utilities are a separate and expanding source of OPGW and ADSS demand at transmission and distribution levels. Grid modernization work in Ohio, Tennessee, and Arizona uses the same domestic supply base as telecom and data center customers.
Data centers and cloud providers account for less cable volume than telecommunications, but their 800G requirements for MPO connector counts, fiber density, and insertion loss are influencing enterprise and carrier standards across the United States fiber optic cable industry. Defense and military applications have the highest value per meter because they require armored, ruggedized, and electromagnetic-interference-shielded systems. Hexatronic launched FieldLink in January 2026, featuring expanded-beam connectors and a MIL TAC cable architecture for field deployments. Healthcare users are adopting distributed fiber sensing cables for temperature, acoustic, and strain monitoring. Industrial and manufacturing facilities use fiber for machine communication and process automation, where resistance to electromagnetic interference is an important advantage over copper.
Geography Analysis
The United States fiber optic cable market is national in scope, but demand patterns differ by region. The Mid-Atlantic and Southeast corridor, including Northern Virginia, Georgia, the Carolinas, and Texas, is a major center for data center demand and domestic cable production. Northern Virginia’s data center concentration creates dense intra-campus and metro fiber requirements that cannot be replaced by wireless networks. Corning’s May 2026 plans for 3 new advanced manufacturing facilities in North Carolina and Texas align production capacity with major consumption areas. The work is supported by Corning’s agreement with Meta and its partnership with NVIDIA, while Texas is developing as an AI data center location because it offers available land, competitive power tariffs, and faster permitting than some Northeastern markets.
Rural and underserved areas in Appalachia, the Great Plains, tribal lands, and the Mountain West are the main targets for BEAD funding. NTIA approval of 53 of 56 eligible entities by April 2026 supports construction activity across these areas. States with easier terrain and stronger contractor capacity can achieve earlier connections, while mountainous and tribal-land projects may continue through 2029. California’s USD 1.8 billion BEAD plan assigned 53% of locations to fiber, 27% to low-Earth-orbit satellite, and 20% to fixed wireless, illustrating how technology-neutral choices can reduce cable demand in some rural areas. The West Coast combines major submarine landing stations with AI campuses, creating demand for terrestrial routes that connect subsea systems to data center clusters.
The Midwest and Mountain West are becoming important through grid modernization rather than broadband grants or hyperscaler budgets. Trico Electric’s Arizona SmartGrid Fiber Backbone and utility projects in Ohio use fiber as part of electrical infrastructure and create demand for armored and direct-burial cable with different purchasing cycles and specifications. Southeastern manufacturing sites can serve these regions with manageable logistics costs and lead times. Pacific cable landings, including Bifrost at Grover Beach, California, also support metro fiber demand in the Pacific Northwest, creating a demand base that is more diverse than consumer broadband alone.
Competitive Landscape
The United States fiber optic cable market is moderately concentrated at the manufacturing level. Prysmian and Corning are 2 of 3 domestic producers of optical fiber and fiber optic cable, and the Buy America rules reinforce the advantage of approved US manufacturing. Large producers are expanding capacity through long-term agreements with data center customers. Prysmian announced a 10-year optical fiber cable supply agreement with Molex valued at up to EUR 5.5 billion (USD 6.3 billion), and committed EUR 1.25 billion (USD 1.4 billion) to more than double US fiber capacity through 2031. These agreements reserve production capacity and help finance new facilities.
Competition also centers on products that reduce installation time in high-density applications. Corning announced its PRIZM TMT ferrule technology in March 2026, using expanded-beam alignment to support AI data center connections. CommScope announced FastSelfClean technology in May 2026, including a planned 144-fiber connector for commercial release in 2027. Clearfield’s NOVA Platform is designed to reduce installation work for high-density data centers and broadband central offices. These products make the installation process efficiency a meaningful basis for competition and allow suppliers with integrated cable and connector capabilities to increase the value of each installation.
Mid-sized suppliers are also strengthening their domestic manufacturing positions. Hexatronic commissioned cable manufacturing lines in Clinton, South Carolina, in the second quarter of 2026 to complete its Build America, Buy America-certified portfolio. The United States fiber optic cable market has opportunities in commercial-scale hollow-core fiber, rural middle-mile and tribal broadband routes, and utility fiber leasing models. Prysmian and Relativity Networks demonstrated a high-density hollow-core fiber cable in Tennessee in 2026, but commercial-scale volume supply is not established, while ISO/IEC 11801 and ANSI/TIA-568 qualification cycles can favor established suppliers.
United States Fiber Optic Cable Industry Leaders
Prysmian Group
Corning Inc.
Nexans SA
CommScope Holding Company Inc.
Furukawa Electric Co., Ltd.
- *Disclaimer: Major Players sorted in no particular order

Recent Industry Developments
- July 2026: Prysmian Group announced a 10-year supply agreement with Molex, a Koch Inc. company, for optical fiber cables for data centers, valued at up to EUR 5.5 billion (USD 6.3 billion), with an EUR 550 million (USD 620 million) upfront payment. Prysmian also committed EUR 1.25 billion (USD 1.4 billion) to more than double its US fiber capacity through 2031, creating over 600 jobs in the United States.
- July 2026: Google formally launched the Nuvem transatlantic subsea cable system, with 16 fiber pairs and a design capacity of 384 Tbps, connecting Myrtle Beach, South Carolina, to Portugal via Bermuda and the Azores. South Carolina landfall was completed in May 2026.
- May 2026: Corning Incorporated and NVIDIA announced a multi-year commercial and technology partnership on May 7, 2026. Corning is expanding US-based optical connectivity manufacturing capacity tenfold and US fiber production capacity by more than 50%, with 3 new facilities in North Carolina and Texas and more than 3,000 US jobs.
- May 2026: CommScope, an Amphenol company, unveiled FastSelfClean high-density fiber connectivity technology at Computex 2026. Its planned FSC144 connector can connect 3,456 fibers per rack unit, and commercial release is planned for 2027.


United States Fiber Optic Cable Market Report Scope
The United States Fiber Optic Cable Market Report is Segmented by Cable Type (Loose-Tube, Tight-Buffered, Ribbon, and Armored), Mode (Single-Mode and Multi-Mode), Deployment Type (Underground, Aerial, and Submarine), End-User Industry (Telecommunications, Power Utilities, Defense and Military, Industrial and Manufacturing, Data Centers and Cloud Service Providers, Healthcare and Medical, and Others). The Market Forecasts are Provided in Terms of Value (USD).
| Loose-Tube |
| Tight-Buffered |
| Ribbon |
| Armored |
| Single-Mode |
| Multi-Mode |
| Underground |
| Aerial |
| Submarine |
| Telecommunications |
| Power Utilities |
| Defense and Military |
| Industrial and Manufacturing |
| Data Centers and Cloud Service Providers |
| Healthcare and Medical |
| Other End-User Industries |
| By Cable Type | Loose-Tube |
| Tight-Buffered | |
| Ribbon | |
| Armored | |
| By Mode | Single-Mode |
| Multi-Mode | |
| By Deployment Type | Underground |
| Aerial | |
| Submarine | |
| By End-User Industry | Telecommunications |
| Power Utilities | |
| Defense and Military | |
| Industrial and Manufacturing | |
| Data Centers and Cloud Service Providers | |
| Healthcare and Medical | |
| Other End-User Industries |


Key Questions Answered in the Report
What is the size of the United States fiber optic cable market?
The United States fiber optic cable market is USD 6.24 billion in 2026 and is projected to reach USD 8.69 billion by 2031, at a 6.75% CAGR.
What is driving fiber optic cable demand in the United States?
AI data center links, fiber-to-the-home deployment, 5G xHaul, BEAD-funded broadband work, and utility grid modernization are supporting demand.
Which cable type is growing fastest in the United States?
Tight-buffered cable is projected to grow at a 7.80% CAGR through 2031 because it supports direct termination in data center and last-mile installations.
Which deployment method is expanding fastest?
Submarine deployment is projected to expand at an 8.90% CAGR through 2031, supported by new hyperscaler-funded cable systems landing in the United States.
Which end-user purchases the most fiber optic cable?
Telecommunications held 43.57% in 2025 and is projected to grow at a 7.20% CAGR through 2031.
How do federal broadband rules affect cable suppliers?
BEAD funding supports construction demand, while Build America, Buy America rules favor cable made through qualifying domestic production processes.
Page last updated on:





