
United States Container Shipping Market Size and Share
Market Overview
| Study Period | 2020 - 2031 |
|---|---|
| Forecast Data Period | 2026 - 2031 |
| Base Year Market Size (2025) | USD 66.49 Billion |
| Market Size (2026) | USD 69.16 Billion |
| Market Size (2031) | USD 83.45 Billion |
| Growth Rate (2026 - 2031) | 3.83 % |
| Market Concentration | Medium |
Major Players *Disclaimer: Major Players sorted in no particular order Image © Mordor Intelligence. Reuse requires attribution under CC BY 4.0. | |
United States Container Shipping Market Analysis by Mordor Intelligence
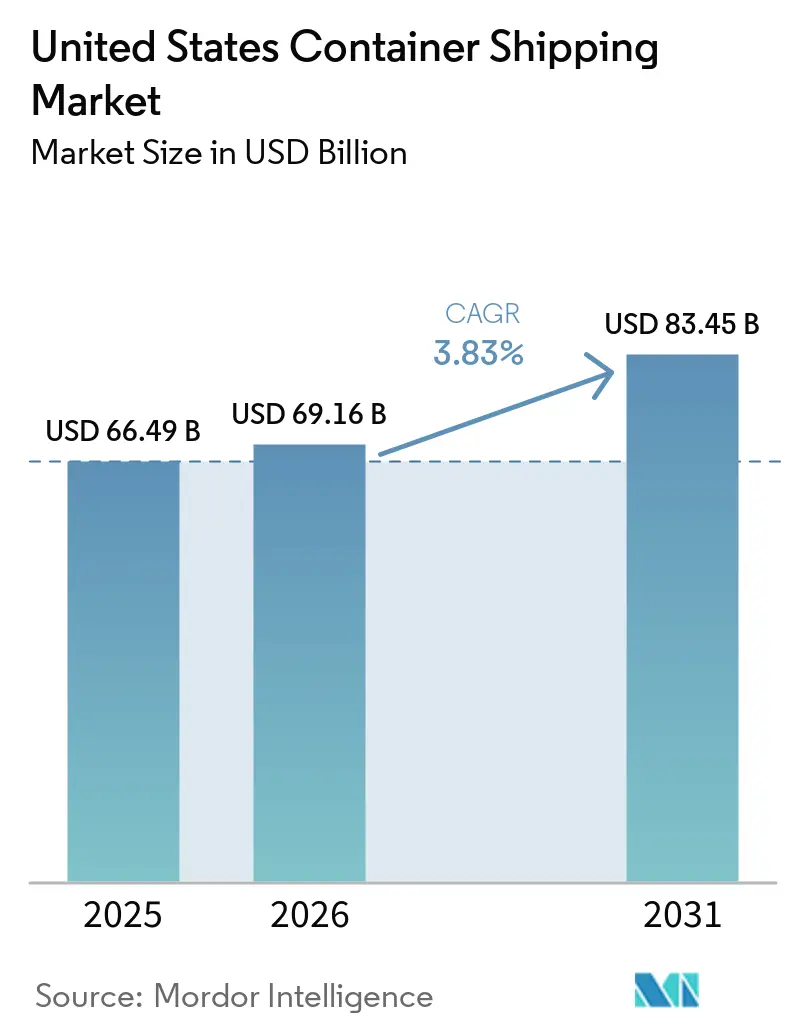
The United States container shipping market size is projected to expand from USD 66.49 billion in 2025 and USD 69.16 billion in 2026 to USD 83.45 billion by 2031, registering a CAGR of 3.83% between 2026 and 2031.
The United States container shipping market is being shaped by a steady rerouting of cargo toward East Coast and Gulf Coast gateways, even though national import volumes have shown limited headline growth. Carrier investment is also moving in the same direction, with new terminal projects, port access arrangements, and network redesigns supporting a more durable shift in trade lane structure. Cold-chain demand is lifting the value mix, as pharmaceutical and food cargo require more specialized equipment and stricter handling standards at key ports. Competition is becoming more selective, with schedule reliability, terminal access, and corridor coverage carrying more weight than rate competition alone. Over the forecast period, the United States container shipping market is likely to reward operators that can combine stable network performance with stronger exposure to nearshoring flows, reefer demand, and Southeast and Gulf Coast expansion.
Key Report Takeaways
- By service type, deep-sea or ocean container shipping led with 58.44% of the United States container shipping market size in 2025, while short-sea container shipping is forecast to expand at a 4.81% CAGR through 2031.
- By container type, dry containers accounted for 76.40% of the United States container shipping market share in 2025, while reefer containers are projected to grow at a 7.43% CAGR through 2031.
- By container size, 40-foot containers accounted for 56.12% of the United States container shipping market size in 2025, while 20-foot containers are projected to advance at a 5.09% CAGR through 2031.
- By load type, full container load held 73.01% of the United States container shipping market share in 2025, while less-than-container-load is forecast to grow at a 6.83% CAGR through 2031.
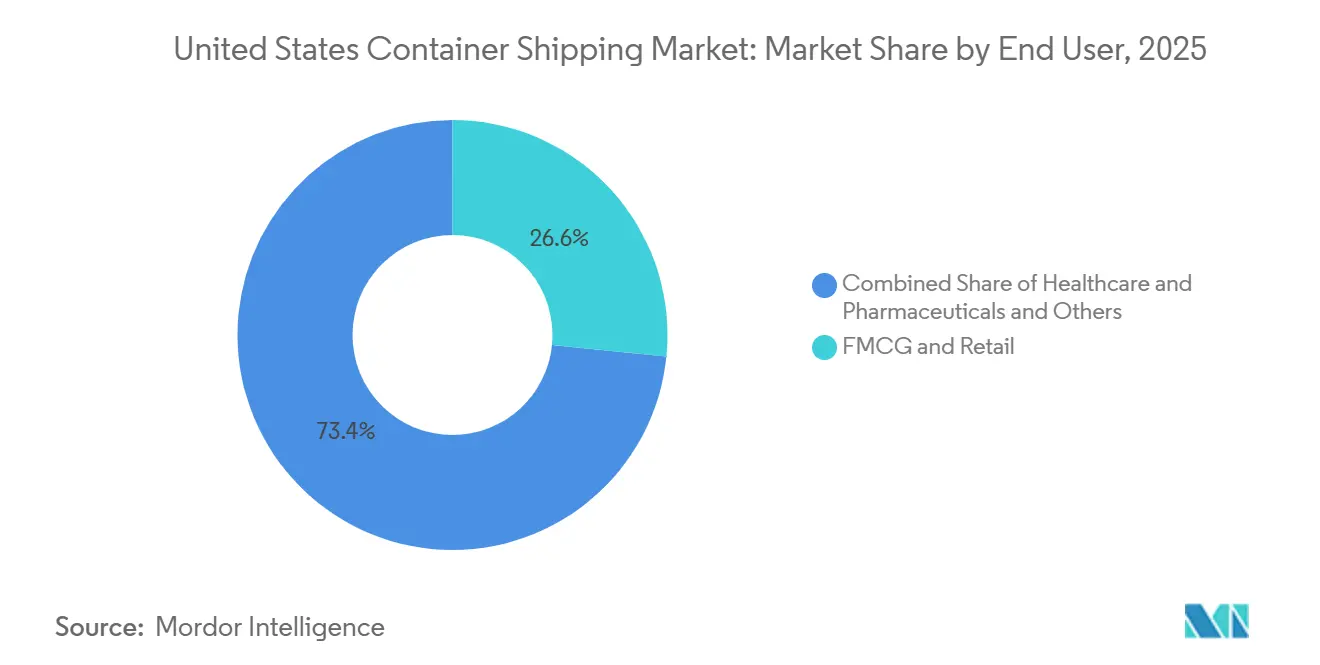
- By end-user industry, FMCG and retail captured 26.59% of the United States container shipping market size in 2025, while healthcare and pharmaceuticals are projected to grow at a 6.15% CAGR through 2031.
- By region, the West held 27% of the United States container shipping market share in 2025, while the Southeast is forecast to grow at a 5.15% CAGR through 2031.
Note: Market size and forecast figures in this report are generated using Mordor Intelligence’s proprietary estimation framework, updated with the latest available data and insights as of January 2026.
United States Container Shipping Market Trends and Insights
Drivers Impact Analysis*
| Driver | (~) % Impact on CAGR Forecast | Geographic Relevance | Impact Timeline |
|---|---|---|---|
| East Coast Nearshoring and Mexico Trade Re-Routing | +1.2% | Southeast, Northeast, Gulf Coast | Medium term (2-4 years) |
| United States Port Modernization and Automation Investments | +0.7% | National, with early gains in Savannah, Long Beach, NY/NJ | Long term (≥ 4 years) |
| Refrigerated Cargo Growth from Healthcare and Food Imports | +0.8% | National, concentrated in Philadelphia, Savannah, and Los Angeles | Medium term (2-4 years) |
| Carrier Network Rebalancing Toward United States Gulf and East Coast Ports | +0.5% | Gulf Coast, Southeast | Short term (≤ 2 years) |
| Shipper Preference for FCL on Time-Sensitive Retail Lanes | +0.4% | West Coast, Northeast | Short term (≤ 2 years) |
| Demand for Schedule Reliability and Data-Visible Ocean Contracts | +0.3% | Global with United States West and East Coast hubs | Medium term (2-4 years) |
| Source: Mordor Intelligence | |||
East Coast Nearshoring and Mexico Trade Re-Routing
The United States container shipping market is seeing a durable change in cargo routing as sourcing shifts away from China and toward Mexico and parts of Southeast Asia. China’s share of total United States containerized imports fell from 40% in mid-2024 to 28.8% by mid-2025, while Indonesia posted 34% import growth to the United States and Thailand posted 28% growth over the same period. This has shortened the average haul for part of the inbound cargo base and improved the economics of shorter sea legs and Gulf-oriented routing. North American East Coast ports raised their share of United States-laden import containers from 46% in Q1 2025 to 46.8% in Q1 2026, showing that the routing shift has already moved from a temporary response to a measurable trade pattern. As nearshoring matures, the United States container shipping market is likely to see more demand concentrated in corridors linking Gulf and East Coast gateways with Mexico-facing and Atlantic-facing supply chains.
United States Port Modernization and Automation Investments
Port modernization is strengthening the operating base of the United States container shipping market by improving berth productivity, crane capability, and landside cargo flow. FY 2025 distribution of USD 774 million across 37 projects under the Port Infrastructure Development Program, reflecting the scale of public support for port upgrades before the current funding window closes. Terminal operators are also investing directly, with modernization at Port Elizabeth and Los Angeles adding taller cranes for larger vessels, while the Pier B rail support project in Long Beach is improving inland cargo handling capacity. These upgrades matter because they reduce dwell time, improve turn efficiency, and widen the set of ports that can handle larger container ships with fewer operational constraints. Over time, the United States container shipping market should benefit from more direct port calls and less leakage of discretionary cargo to non-United States alternatives, where secondary United States ports become more reliable and more efficient.
Refrigerated Cargo Growth from Healthcare and Food Imports
The United States container shipping market is gaining a higher-value cargo mix as refrigerated traffic expands faster than the broader market average. Reefer demand is being supported by healthcare logistics investment, including DHL’s EUR 2 billion (USD 2.2 billion) commitment over five years, with half of that budget directed to the Americas. The pharmaceutical side is especially important because the Drug Supply Chain Security Act requires stronger documentation, serialization, and traceability for drug movements, underscoring the need for controlled, verified cold-chain handling[1]. The result is a more specialized import flow centered on a limited number of ports and logistics corridors that already serve biotech and pharmaceutical clusters. That concentration is giving select terminals a stronger role in the United States container shipping market, even where total reefer volumes remain modest relative to dry cargo.
Carrier Network Rebalancing Toward United States Gulf and East Coast Ports
Carrier investment is turning a trade response into a structural change within the United States container shipping market. The Louisiana International Terminal project has committed USD 1.78 billion in funding and is designed as a major Gulf Coast facility capable of handling the largest vessels[2]. MSC also revised key Asia-to-United States East Coast services in 2026, adding or strengthening direct links from Xiamen to Charleston, Savannah, and New York by changing its Emerald, Empire, and Amberjack rotations. CMA CGM’s United Ports LLC structure also secures terminal access at Los Angeles and New York and New Jersey, which deepens the link between network planning and fixed infrastructure. These moves show that the United States container shipping market is now being shaped as much by carrier control over terminal access as by shipper choice on individual routes.
Restraints Impact Analysis*
| Restraint | (~) % Impact on CAGR Forecast | Geographic Relevance | Impact Timeline |
|---|---|---|---|
| Vessel Overcapacity on Major Transpacific and Transatlantic Loops | -1.0% | West Coast and East Coast transoceanic trades | Medium term (2-4 years) |
| Port Congestion, Labor Disruption Risk, and Dwell-Time Volatility | -0.5% | National, concentrated in Los Angeles, Long Beach, and New York, New Jersey. | Short term (≤ 2 years) |
| United States Trade Policy Volatility and Tariff-Driven Booking Uncertainty | -0.7% | National, most acute on Asia-United States transpacific lanes | Short term (≤ 2 years) to Medium term (2-4 years) |
| Equipment Imbalance, Especially Reefers and 40-Foot High Cubes | -0.3% | National, with sharper reefer imbalance at East Coast gateways | Short term (≤ 2 years) |
| Source: Mordor Intelligence | |||
Vessel Overcapacity on Major Transpacific and Transatlantic Loops
The largest near-term restraint on the United States container shipping market is a global vessel capacity overhang. Global cellular fleet exceeded 33.6 million TEU by March 2026 and that much of the 2026-2028 orderbook is concentrated in very large ships, which increases pressure on long-haul routes serving the United States. Low demolition activity in 2024 and 2025 also delayed capacity adjustment and pushed the supply issue into the current forecast window. For shippers, this can support softer rates in the near term, but it also increases the risk that weaker carriers lose ground or pursue consolidation when pricing remains under pressure. The United States container shipping market, therefore, faces mixed effects, with short-run customer benefits from lower freight rates but heavier strategic pressure on carrier profitability and route discipline.
Port Congestion, Labor Disruption Risk, and Dwell-Time Volatility
Congestion risk remains a meaningful operational restraint across the United States container shipping market, even after throughput conditions improved from the worst dislocation seen in prior years. United States containerized import volumes fell to 2.3 million TEUs in April 2026, while Long Beach also posted a 5.7% decline for the month, which underlines how quickly external disruptions can shift terminal activity. Secondary ports still face labor-retention and process-digitization gaps, which make their performance less stable when cargo is diverted away from the largest gateways. Carriers have already responded by adjusting port rotations to reduce exposure to the most congested terminals, indicating that network planning is being shaped by both landside risk and sea capacity[3]. Higher dwell time also tightens chassis availability, reefer plug access, and equipment turnover, placing a greater cost burden on smaller shippers that lack contract priority.
*Our forecasts treat driver/restraint impacts as directional, not additive. The impact forecasts reflect baseline growth, mix effects, and variable interactions.
Segment Analysis
By Service Type: Short-Sea Routes Gain Relevance Alongside Deep-Sea Scale
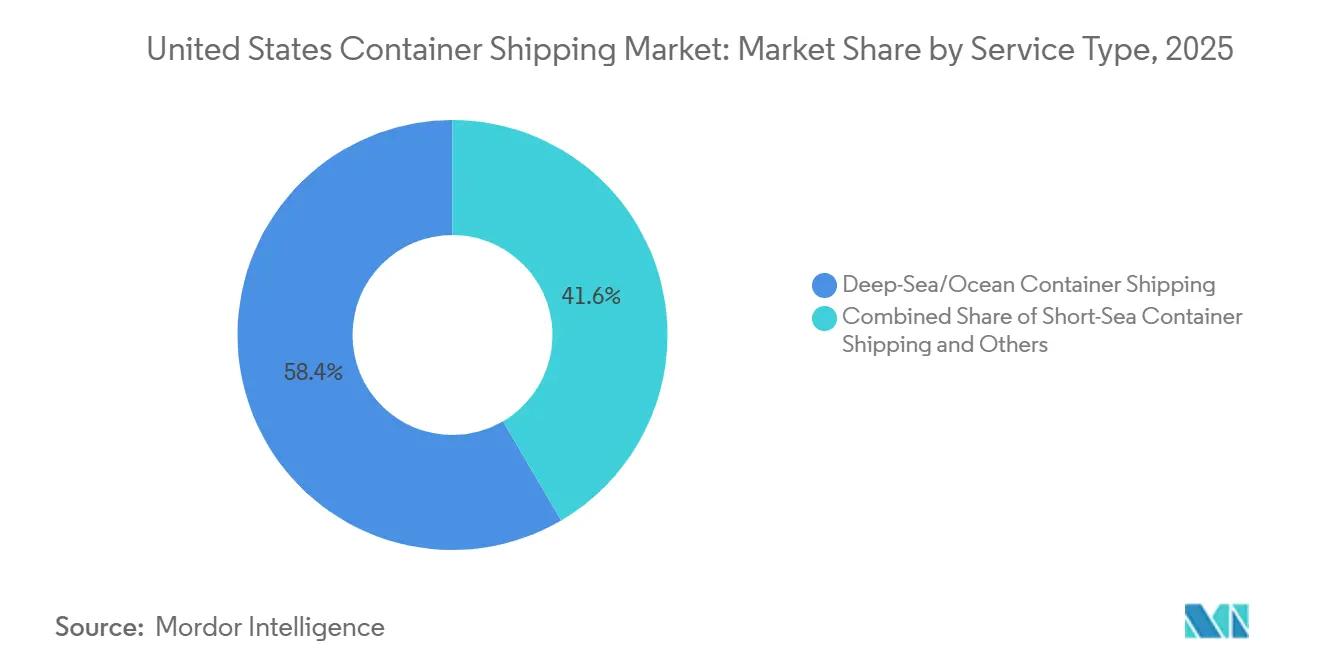
Deep-sea or ocean container shipping accounted for 58.44% of the United States container shipping market share in 2025, making it the core revenue base for the broader system. Its lead came from the long-established transpacific and transatlantic loops that connect United States ports with manufacturing centers in Asia and Europe. That scale remained important in 2025 because large retailers, industrial buyers, and import-dependent manufacturers still relied on these routes for the highest cargo volumes. At the same time, tariff pressure and sourcing diversification weakened the certainty that had previously supported the strongest China-United States mainline economics. The United States container shipping market, therefore, continued to depend on deep-sea services, but the shape of demand inside that segment became less concentrated around a single origin country.
The fastest growth in this category is shifting to short-sea shipping, which is expected to expand at a 4.81% CAGR through 2031. That growth is tied to Mexico nearshoring, Caribbean feeder activity, and Gulf Coast corridor development, which are creating more viable volumes for shorter and mid-distance maritime movements. Alliance reshuffling in 2025 and 2026, which changed schedule design and port pair coverage for shippers using deep-sea networks. As service structures change, short-sea routes are gaining importance because they support flexible cargo handoff between new sourcing points and growing East Coast and Gulf Coast gateways. Within the United States container shipping industry, this segment is no longer merely a secondary support layer, as it is becoming a more direct growth path for ports and carriers exposed to nearshore trade.

By Container Type: Reefer Cargo Lifts Value While Dry Boxes Keep the Base
Dry containers accounted for 76.40% of the United States container shipping market size in 2025, which reflects the wide variety of standard cargo that moves without temperature control. Apparel, electronics, industrial parts, home goods, and general retail shipments all kept this segment firmly in the lead. Its large base also means that even small shifts in retail demand or manufacturing orders can move total market revenue in visible ways. The decline in Chinese-origin imports in 2025 weakened dry container utilization on major transpacific lanes, but it did not diminish the segment’s central role in national cargo flows. Newbuild orders aimed mainly at standard capacity also show that carriers still view dry containers as the main throughput platform for the United States container shipping market.
Reefer containers are projected to grow at a 7.43% CAGR through 2031, making them the fastest-moving container type. This reflects stronger demand for pharmaceutical and food logistics, but the pharmaceutical side has more durable policy support due to traceability and handling requirements under the United States drug regulations. Environmental regulations are increasing retrofit and equipment-replacement needs for reefer-capable fleets, thereby increasing capital intensity in this segment. East Coast ports with established healthcare and life sciences links stand to gain the most, as they already support the compliance, warehousing, and handling routines required for these cargoes. In the United States container shipping industry, reefer growth is therefore changing equipment strategy, terminal priorities, and the value mix more than it is changing total box volume.
By Container Size: Forty-Foot Units Lead While Twenty-Foot Units Improve Momentum
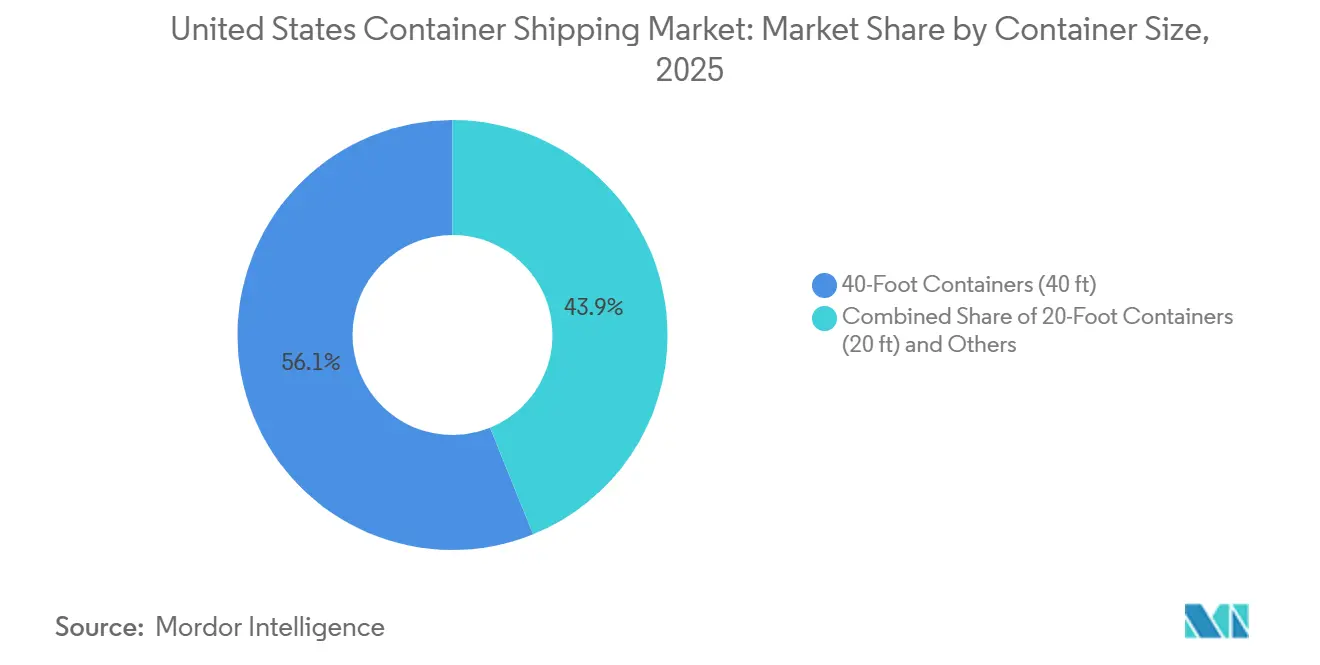
40-foot containers held 56.12% of the United States container shipping market share in 2025, making them the standard box for high-volume import distribution. Their lead reflects the needs of large retailers and major inland distribution systems that favor better cubic utilization across ship, rail, and truck moves. The segment also benefits from the strong role of high-cube boxes in long-haul transpacific movements, where cargo density often fits the forty-foot format. Large-vessel orders aimed at the highest-volume East Asia-to-United States corridors support this segment’s position because they are designed around the same mainline trade logic. In revenue terms, the forty-foot unit remains the clearest indicator of mainstream cargo flow inside the United States container shipping market.
20-foot containers are forecast to grow at a 5.09% CAGR through 2031, the fastest rate among the size segments. That growth is tied to heavier commodities, chemicals, raw materials, and selected agricultural export loads that fit the smaller box more efficiently. As export lanes recover and sourcing patterns continue to shift, demand for twenty-foot containers is becoming more visible on both Pacific and Atlantic services. The segment also benefits from mixed-slot service designs, which allow carriers to match different cargo profiles within a single route structure. Even so, equipment imbalance remains a challenge across the United States container shipping market because high-demand import hubs continue to create repositioning pressure, especially for 40-foot high-cube containers.
By Load Type: FCL Keeps Revenue Control While LCL Benefits from Sourcing Fragmentation
Full container load accounted for 73.01% of the United States container shipping market share in 2025, giving it the dominant position in load type revenue. Large retailers, automotive producers, and electronics shippers favored FCL because it offers simpler handling, more predictable transit times, and greater control over timing. Schedule reliability has become a stronger selling point for premium contract cargo, which supports the FCL model where timing matters more than pure price. Pharmaceutical handling rules further support this segment, as consolidated cargo creates additional documentation and process complexity for some regulated goods. As a result, FCL continues to anchor the operating base of the United States container shipping market even when the pricing environment softens.
LCL is forecast to grow at a 6.83% CAGR through 2031, which makes it the fastest-growing load type. That rise is linked to sourcing diversification, as importers are now combining smaller shipments from multiple origins rather than relying on a single large supplier in China. This creates more frequent consolidation needs and raises the value of flexible inland and port-side logistics services. Carriers and intermodal partners are responding with products that target smaller cargo lots and time-sensitive inland distribution, especially for Midwest-linked freight corridors. In the United States container shipping market, LCL is gaining relevance not because it threatens FCL dominance, but because many importers' shipment profiles are becoming more fragmented.
By End-User Industry: Retail Leads Volume While Healthcare Raises Value Density
FMCG and retail accounted for 26.59% of the United States container shipping market share in 2025, maintaining their position as the largest end-user segment. This position came from the broad mix of consumer goods that move through United States ports every day, including apparel, housewares, packaged foods, and electronics. The segment remained large even though tariff-related front-loading in early 2025 was followed by softer activity later in the year, which made the demand pattern less stable than its headline scale suggested. Manufacturing and automotive cargo also remained important in the same period, especially at ports with strong inland rail access to industrial centers. Even amid volatility, consumer- and retail-linked flows continued to set the base tempo of the United States container shipping market.
Healthcare and pharmaceuticals are projected to grow at a 6.15% CAGR through 2031, making it the fastest-growing end-user group. Its rise reflects the need for temperature-controlled components, specialized documentation, and regulated handling for both imported inputs and finished products. Growing use of Foreign Trade Zones near major port complexes, which deepens cargo stickiness at selected gateways and changes local warehouse demand. Because the compliance burden spans customs, drug regulation, and controlled substance rules, only a limited number of port complexes can efficiently serve the full range of pharmaceutical cargo. That gives healthcare a stronger strategic role in the United States container shipping market than its current share alone would suggest.
Geography Analysis
The West held 27% of the United States container shipping market share in 2025, making it the single largest regional segment by revenue. Its position rests on the San Pedro Bay complex, where Los Angeles and Long Beach remain the largest container gateway cluster in the Western Hemisphere. Los Angeles handled 890,861 TEUs in April 2026 and posted 5.7% growth, while Long Beach handled 817,992 TEUs and declined 5.7% in the same month, showing that performance can diverge even within the same regional system. Modernization in Los Angeles also strengthened the West Coast's case for larger vessel calls and helped protect throughput amid mounting competition from the East. Even so, West Coast growth over the long term has been flatter than its historic status would suggest.
The Southeast is the fastest-growing region, with the United States container shipping market size for this geography projected to rise at a 5.15% CAGR through 2031. Savannah’s berth and inland rail expansion is strengthening that trajectory by extending the port’s reach into major manufacturing and distribution corridors. Direct carrier calls are also expanding, including services linking Southeast ports with Vietnam and wider Asia-origin cargo streams. Gulf Coast investment aligns with this direction because the Louisiana International Terminal is adding future capacity to the broader Southeast and Gulf growth zone. The Northeast still accounts for a significant share of revenue through New York and New Jersey, while the Midwest remains central as the inland destination for intermodal flows from both coasts.
The Southwest and Midwest have smaller direct coastal shares, but they matter because they absorb and redirect container flows when major gateways face pressure. Houston’s role is rising with carrier-backed infrastructure commitments and stronger Gulf routing interest tied to network rebalancing. East Coast ports increased their share of laden United States imports from 46% in Q1 2025 to 46.8% in Q1 2026, while the West Coast saw a decline in imports during the same period, confirming the directional shift already visible in carrier strategy[4]. Established gateways also retain an advantage because long-standing customs, inspection, and vessel control processes create barriers to emerging alternatives seeking to attract direct mainline calls.
Competitive Landscape
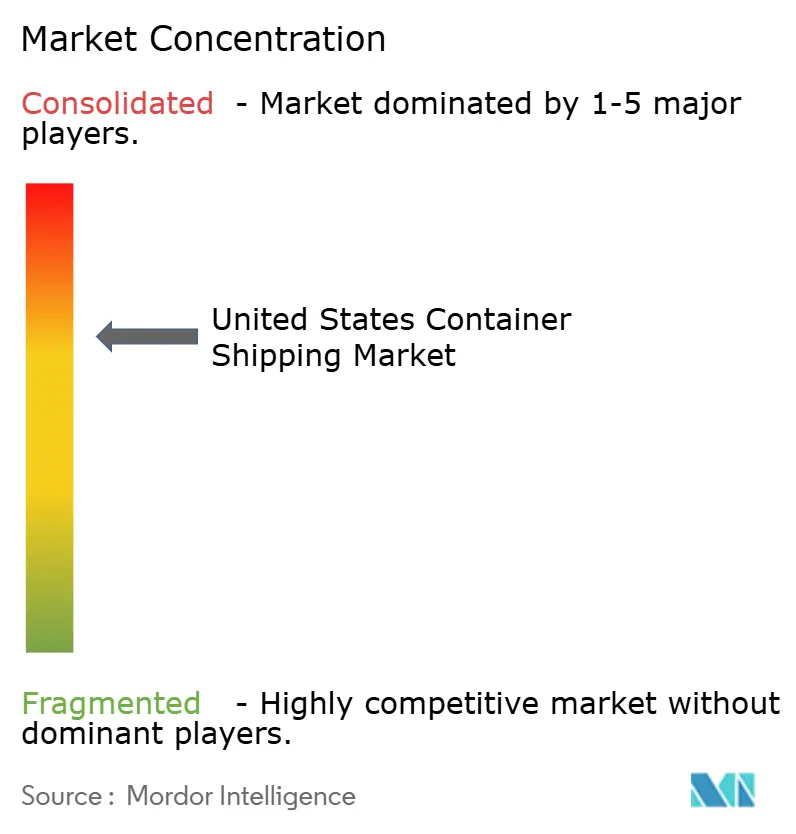
The United States container shipping market remains moderately to highly concentrated at the carrier level, with MSC, Maersk, CMA CGM, COSCO Shipping, and Hapag-Lloyd controlling the largest share of deployed long-haul capacity. MSC alone operates a fleet of over 7.26 million TEU and represents 21.5% of global capacity, which gives it unusual scale as both an operator and an infrastructure investor. Its role in the Louisiana International Terminal project shows how vertical integration is moving beyond vessel ownership and into secured United States port access. Hapag-Lloyd’s planned acquisition of ZIM for USD 4.2 billion will raise its global share to 9.2% and create a combined fleet of more than 3 million TEU, comprising more than 400 vessels. That deal will also strengthen Gemini's position in the United States trades and intensify pressure on competing alliances and vessel-sharing arrangements.
Schedule reliability is now one of the clearest non-price differentiators in the United States container shipping market. The Gemini Cooperation sustained 90%+ reliability through its early operating period and also won the Northwest Seaport Alliance’s carrier performance award for the December 2025 to May 2026 period. That matters because premium retail, healthcare, and electronics cargo is moving toward more reliable service rather than only lower freight rates. CMA CGM is taking a similar long-view approach through the United Ports LLC structure, which secures terminal exposure at Los Angeles and New York and New Jersey while supporting future network flexibility. The result is a competitive field where the strongest carriers are pairing transport capacity with harder-to-replicate physical access points.
There is also a second tier of competition around domestic and regional relevance. Matson and Crowley operate in Jones Act-linked domestic lanes where deep-sea global carriers do not compete directly, which protects a distinct space inside the broader United States container shipping market. Matson’s Aloha Class LNG-powered vessel program supports that position by renewing fleet capacity for Hawaii and related trades. COSCO’s direct service upgrades and e-commerce-oriented transit offerings show that digital service design and cargo visibility are also becoming useful tools for attracting mid-value, time-sensitive freight. Competitive advantage in this market is therefore spreading across scale, reliability, control of infrastructure, and product design rather than relying solely on vessel capacity.
United States Container Shipping Industry Leaders
-
Mediterranean Shipping Company (MSC)
-
A.P. Moller - Maersk A/S
-
CMA CGM Group
-
COSCO SHIPPING Holdings Co., Ltd.
-
Hapag-Lloyd AG
- *Disclaimer: Major Players sorted in no particular order
Recent Industry Developments
- April 2026: MSC restructured its three core Asia to United States East Coast services, Empire, Amberjack, and Emerald, replacing congested port calls and granting Xiamen direct access to Charleston, Savannah, and New York on the Emerald service. The restructuring is designed to improve schedule reliability across China-to-the-United States East Coast lanes ahead of peak season.
- March 2026: MSC's Terminal Investment Limited, Ports America, and Port NOLA formally incorporated Louisiana International Terminal Holdings LLC to develop and operate the Louisiana International Terminal in St. Bernard Parish, Louisiana.
- February 2026: Hapag-Lloyd signed a definitive merger agreement to acquire 100% of ZIM Integrated Shipping Services at USD 35 per share in cash, totaling approximately USD 4.2 billion.
- January 2026: CMA CGM and Stonepeak launched United Ports LLC, a joint venture backed by a USD 2.4 billion Stonepeak investment for a 25% stake in 10 CMA CGM-operated terminals globally, including Fenix Marine Services in Los Angeles and Port Liberty in New York and New Jersey.
United States Container Shipping Market Report Scope
| Deep-Sea/Ocean Container Shipping |
| Short-Sea Container Shipping |
| Feeder and Coastal/Domestic Container Shipping |
| Dry Containers (General Purpose) |
| Reefer Containers |
| 20-foot Containers (20 ft) |
| 40-foot Containers (40 ft) |
| Other Specialized Sizes |
| Full-Container-Load (FCL) |
| Less-Than-Container-Load (LCL) |
| FMCG and Retail |
| Manufacturing and Automotive |
| Healthcare and Pharmaceuticals |
| Electronics and Electrical Equipment |
| Industrial Chemicals and Raw Materials |
| Others |
| Northeast |
| Southeast |
| Midwest |
| Southwest |
| West |
| By Service Type | Deep-Sea/Ocean Container Shipping |
| Short-Sea Container Shipping | |
| Feeder and Coastal/Domestic Container Shipping | |
| By Container Type | Dry Containers (General Purpose) |
| Reefer Containers | |
| By Container Size | 20-foot Containers (20 ft) |
| 40-foot Containers (40 ft) | |
| Other Specialized Sizes | |
| By Load Type | Full-Container-Load (FCL) |
| Less-Than-Container-Load (LCL) | |
| By End-User Industry | FMCG and Retail |
| Manufacturing and Automotive | |
| Healthcare and Pharmaceuticals | |
| Electronics and Electrical Equipment | |
| Industrial Chemicals and Raw Materials | |
| Others | |
| By Region | Northeast |
| Southeast | |
| Midwest | |
| Southwest | |
| West |
Key Questions Answered in the Report
What is the 2031 value outlook for container shipping in the United States?
The United States container shipping market is forecast to reach USD 83.45 billion by 2031 from USD 69.16 billion in 2026, with a 3.83% CAGR over 2026-2031.
Which service type currently leads revenue?
Deep-sea or ocean container shipping led the market in 2025 with a 58.44% share, supported by major transpacific and transatlantic trade loops.
Which container type is growing fastest?
Reefer containers are projected to grow the fastest at a 7.43% CAGR through 2031, driven by pharmaceutical and food cold-chain demand.
Why is the Southeast growing faster than other United States regions?
The Southeast is projected to grow at a 5.15% CAGR because Savannah and nearby corridors are gaining direct carrier calls, berth upgrades, and inland rail reach.
What is driving growth in less-than-container-load shipments?
LCL is expected to grow at a 6.83% CAGR as sourcing spreads across more countries, leading to more small-lot and multi-origin shipments.
How concentrated is competition among major carriers?
Competition is centered on a limited group of large global carriers, but the market still has room for regional and domestic specialists in selected lanes.