
United States Co-Living Market Size and Share
Market Overview
| Study Period | 2020 - 2031 |
|---|---|
| Forecast Data Period | 2026 - 2031 |
| Base Year Market Size (2025) | USD 1.65 Billion |
| Market Size (2026) | USD 1.7 Billion |
| Market Size (2031) | USD 3.5 Billion |
| Growth Rate (2026 - 2031) | 15.53 % |
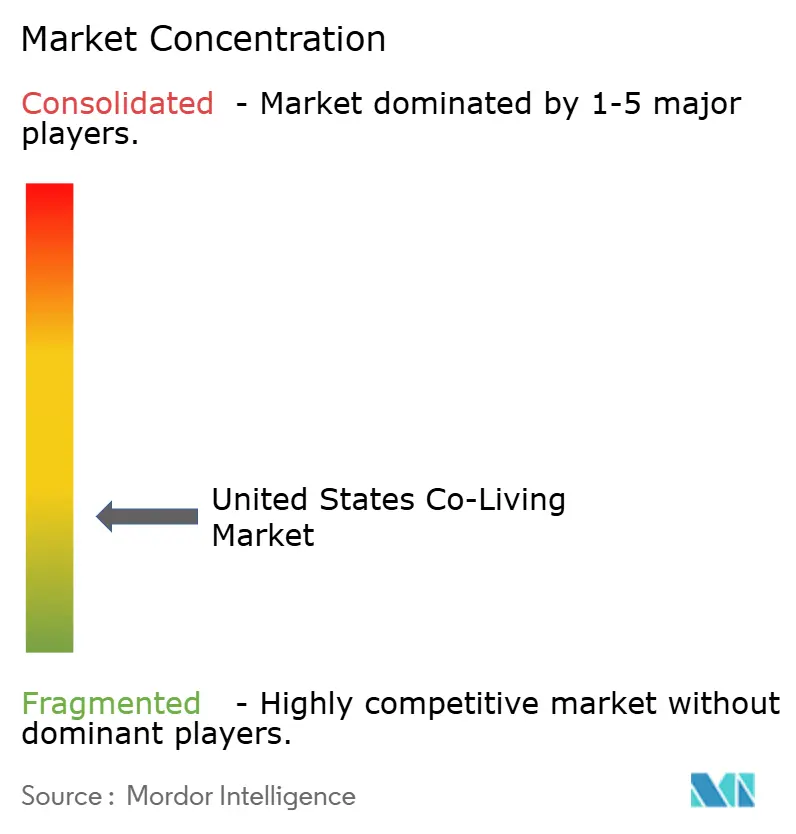
| Market Concentration | Low |
Major Players *Disclaimer: Major Players sorted in no particular order Image © Mordor Intelligence. Reuse requires attribution under CC BY 4.0. | |
United States Co-Living Market Analysis by Mordor Intelligence
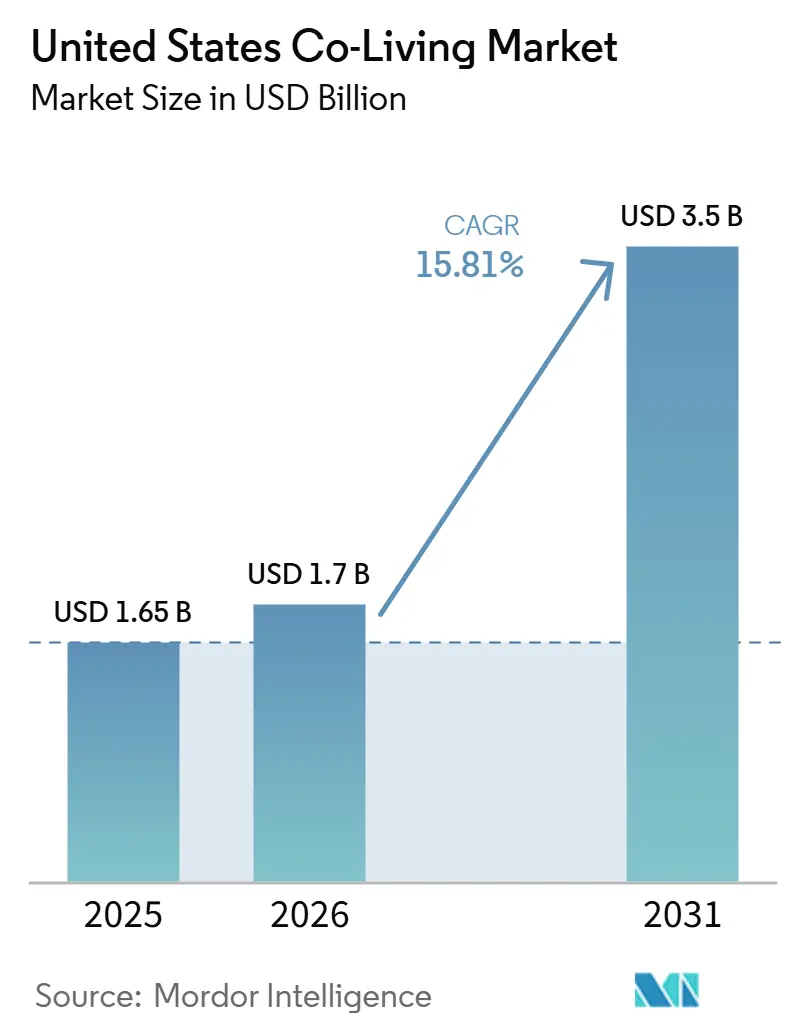
The United States Co-Living Market size is expected to increase from USD 1.65 billion in 2025 to USD 1.7 billion in 2026 and reach USD 3.5 billion by 2031, growing at a CAGR of 15.53% over 2026-2031.
The affordability gap has become a durable demand base for the United States co-living market, as 22.7 million renter households were cost-burdened in 2024, and 12.1 million spent more than 50% of their income on rent and utilities. This pressure is no longer limited to lower-income renters, as households earning USD 45,000 to USD 74,999 recorded a 9.5 percentage point rise in burden rates since 2019, widening the addressable base for the United States co-living market. Remote and hybrid work have also supported demand, as 22% of the United States workers worked from home at least part-time in 2025, keeping short-cycle lease formats relevant for mobile renters in the United States co-living market. On the supply side, regulatory costs accounted for more than 40% of new apartment construction costs in 2026, which has limited conventional rental expansion and strengthened the value case for the United States co-living market as a lower-cost operating format. Competitive conditions are tightening as larger asset-light operators absorb distressed inventory, while zoning variation and privacy concerns continue to shape execution standards across the United States co-living market.
Key Report Takeaways
- By property configuration, studio / entire unit led with a 45% revenue share in 2025, while shared rooms are forecast to expand at a 16.00% CAGR through 2031.
- By business model, the asset-light management agreement segment held 46.8% of the United States co-living market share in 2025 and recorded the highest projected CAGR of 16.50% through 2031.
- By price band, mid-scale accounted for 41% of the United States co-living market size in 2025 and is advancing at a 16.55% CAGR through 2031.
- By end user, working professionals led with 55% of demand in 2025, while students are projected to expand at a 16.90% CAGR through 2031.
- By city, New York City accounted for 27% of demand in 2025, while Austin is forecast to grow at a 17.00% CAGR through 2031.
Note: Market size and forecast figures in this report are generated using Mordor Intelligence’s proprietary estimation framework, updated with the latest available data and insights as of January 2026.
United States Co-Living Market Trends and Insights
Drivers Impact Analysis*
| Drivers | (~) % Impact on CAGR Forecast | Geographic Relevance | Impact Timeline |
|---|---|---|---|
| High Urban Rental Costs Drive Co-Living Demand | +4.8% | National, most acute in New York City, San Francisco Bay Area, and Los Angeles | Long term (≥ 4 years) |
| Demand for Flexible Lease Terms Boosts Market Adoption | +3.5% | National, with concentrated adoption in Austin, New York City, and Los Angeles | Medium term (2-4 years) |
| Remote and Hybrid Work Culture Supports Flexible Living Models | +2.8% | National, with early gains in Austin, Denver, and Nashville | Medium term (2-4 years) |
| Landlord Interest in Higher Asset Utilization Expands Co-Living Supply | +2.2% | National, with early gains in Sun Belt markets including Austin and Atlanta | Short term (≤ 2 years) |
| Preference for Community-Oriented Living Increases Shared Housing Adoption | +2.0% | National, with high concentration in New York City and the San Francisco Bay Area | Medium term (2-4 years) |
| Growth in Single-Person Households Expands Co-Living Demand | +1.3% | National, with stronger relevance in large urban and secondary growth metros | Long term (≥ 4 years) |
| Source: Mordor Intelligence | |||
High Urban Rental Costs Drive Co-Living Demand
The affordability crisis remains the strongest demand driver for the United States co-living market. The Joint Center for Housing Studies reported in April 2026 that 22.7 million renter households were cost-burdened in 2024, up from 20.4 million in 2019. The same release showed that lower-income renters had only USD 210 per month left after housing costs, a record low that strengthened the case for shared living formats. Demand has also shifted toward the middle of the market, as households earning USD 45,000 to USD 74,999 saw a 9.5 percentage-point increase in burden rates since 2019. Low-rent apartment stock priced below USD 600 per month in real terms fell by 30% between 2014 and 2024, which left fewer conventional options for renters who need lower monthly outlays. Pew also noted that co-living rooms in Austin rent for USD 500 to USD 700 per month, versus USD 1,282 for a comparable studio, while Washington, D.C. co-living options start at USD 1,000 versus USD 1,900 for a studio.
Demand for Flexible Lease Terms Boosts Market Adoption
Lease flexibility has become a core purchase criterion in the United States co-living market. Outpost Group’s May 2026 tenant survey found that 57% of residents viewed lease flexibility as a must-have or highly important feature. The same survey showed that 65% of respondents were aged 18 to 30, which supports the link between mobility and shorter lease preferences. Job moves and relocations are now a direct housing trigger, giving operators with faster onboarding and no broker fees a stronger retention position in the United States co-living market. By January 2026, PadSplit had demonstrated the scale of this demand pattern by reaching more than 29,000 room listings across 35 United States metros through a model that enabled weekly payment cycles and move-ins within 48 hours. Flexible terms also fit hybrid workers who want urban access without committing to standard annual leases, which keeps this feature central to product design across the United States co-living market.
Remote and Hybrid Work Culture Supports Flexible Living Models
Remote and hybrid work continue to support the United States co-living market by keeping housing decisions more mobile. The Federal Reserve Bank of Minneapolis reported that 22% of workers in the United States worked from home at least part-time in 2025, and that rate had remained stable for 2 consecutive years. Stable remote participation means that renters still value location flexibility, shorter commitments, and furnished formats that reduce moving friction in the United States co-living market. Operators also benefit because hybrid residents tend to fit higher-value room types and managed living formats. The same work pattern has increased the appeal of shared lounges, coworking areas, and event programming, as daily office interaction remains below pre-pandemic levels in many jobs. This combination of flexible tenure and built-in social infrastructure gives the United States co-living market a clear position against conventional apartments that offer privacy but less operational flexibility.
Landlord Interest in Higher Asset Utilization Expands Co-Living Supply
Landlord and operator interest in higher asset utilization is supporting near-term growth in the United States co-living market. Property owners are looking for formats that can boost occupancy, increase revenue per square foot, and better utilize large apartments or underused residential stock. This is becoming more relevant as conventional rental development faces cost pressure, with regulatory costs accounting for more than 40% of new apartment construction costs in 2026. Co-living gives landlords a way to increase income density without taking on full development risk, while operators can scale faster through management agreements and similar asset-light structures. The pattern is already visible in Sun Belt cities such as Austin and Atlanta, where operators are expanding into markets that offer room for faster conversion and more flexible housing formats.
Restraints Impact Analysis*
| Restraints | (~) % Impact on CAGR Forecast | Geographic Relevance | Impact Timeline |
|---|---|---|---|
| Zoning and Local Housing Regulations Restrict New Developments | -1.8% | National, most acute in SF Bay Area and NYC | Long term (≥ 4 years) |
| High Insurance and Compliance Costs Increase Operating Expenses | -1.4% | National, greater in high-density coastal metros | Medium term (2-4 years) |
| Operator Execution Risks and Asset-Heavy Models Limit Market Expansion | -1.1% | National, with greater relevance in high-cost urban markets and expansion-led operator networks | Medium term (2-4 years) |
| Tenant Privacy Concerns Reduce Adoption of Shared Living Models | -0.9% | National, concentrated in tech-heavy metros including SF, NYC, and Austin | Medium term (2-4 years) |
| Source: Mordor Intelligence | |||
Zoning and Local Housing Regulations Restrict New Developments
Zoning fragmentation remains a major brake on the United States co-living market. Pew documented that Colorado, Hawaii, Washington, Oregon, and Iowa moved shared-housing legislation forward in 2024, indicating that enabling policy is spreading but remains uneven. Even with that progress, local restrictions continue to vary by city, building type, and occupancy rules, complicating scale-up plans for operators in the United States co-living market. This patchwork raises the cost of permits, fire compliance, building-code checks, and operating procedures for converted properties. Larger platforms can absorb those requirements more easily than smaller operators, which has started to push the United States co-living market toward consolidation. The result is slower expansion in premium metros, even as renter demand conditions remain strong.
High Insurance and Compliance Costs Increase Operating Expenses
The high insurance and compliance burden is limiting the pace of expansion in the United States co-living market, especially in dense urban areas where shared housing faces closer scrutiny. Operators must manage occupancy permits, fire code compliance, building code requirements for converted properties, and resident data protections across different local and state frameworks, which raises operating costs and slows portfolio scaling. This burden is heavier for smaller platforms because they often lack dedicated compliance teams and must spread these fixed costs across fewer units. The pressure is more visible in coastal markets, where regulatory standards are stricter, and resident density is higher, making underwriting and property conversion more complex. Privacy-related oversight has added another layer, as operators of smart-access systems and building sensors face stronger expectations regarding consent, disclosure, and data-handling practices. As a result, the United States co-living market is favoring operators that can absorb insurance, legal, and compliance costs while still maintaining occupancy and pricing discipline.
*Our forecasts treat driver/restraint impacts as directional, not additive. The impact forecasts reflect baseline growth, mix effects, and variable interactions.
Segment Analysis
By Property Configuration: Shared Rooms Gain as Affordability Pressure Deepens
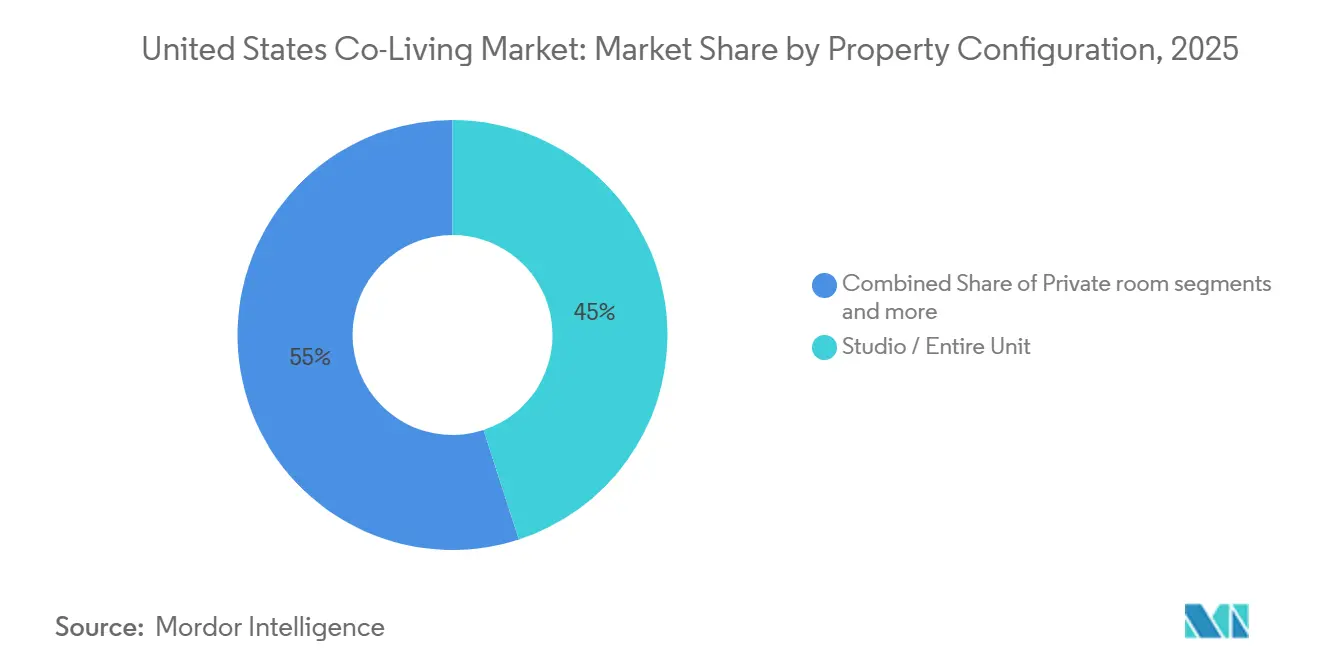
Studio / entire-unit held 45% of the United States co-living market in 2025, keeping it the leading format by configuration. This share reflects demand from residents who want more autonomy than a shared room can offer, while still preferring furnished spaces and managed services over a standard apartment lease. In the United States, the co-living industry serves as a bridge between conventional private rental and operator-led shared housing. Private Room remained the practical midpoint because it balances privacy with lower monthly cost and continues to fit a large working-professional base in urban cores.
The shared room segment is projected to grow at a 16.00% CAGR from 2026 to 2031, making it the fastest-expanding configuration in the United States co-living market. That growth reflects stronger affordability pressure, even as privacy concerns remain part of the category discussion. Outpost Group’s 2026 tenant survey showed that 97% of residents ranked price as very important, which supports the value logic behind shared formats[1]. Operators are also using a mix of Studio, Entire Unit, Private Room, and Shared Room inventory to improve revenue per square foot and align product choices with different renter budgets. The United States co-living market for Shared Rooms is therefore being shaped first by cost sensitivity, while room design and privacy management continue to influence product acceptance.
By Business Model: Asset-Light Management Agreement Consolidates its Structural Advantage
Asset-light management agreements accounted for 46.8% of the United States co-living market share in 2025 and are forecast to grow at a 16.50% CAGR through 2031. This dual position shows why the United States co-living market has moved toward fee-based operating structures under current capital conditions. Operators using this model generate income by managing third-party-owned assets rather than carrying large real estate exposure on their own balance sheets. That structure has gained credibility because earlier asset-heavy expansion models faced severe strain when occupancy and capital assumptions did not hold.
Asset-light master lease / lease arbitrage still has a role when landlords prefer guaranteed rent over management fees and operators want greater revenue control without ownership. Own-develop-operate remains relevant in purpose-built projects where design, coworking integration, and amenity planning can justify higher capital intensity. In 2026, regulatory costs accounted for more than 40% of new apartment construction costs, adding further pressure to capital-intensive approaches in the United States co-living market. This cost burden has widened the economic gap between asset-light, flexible platforms and operators that must underwrite land, construction, and long payback periods. The United States co-living market size tied to management agreements is therefore expanding because the model can scale with lower balance-sheet risk and better capital efficiency.
By Price Band: Mid-Scale Converges as the Market’s Value Center
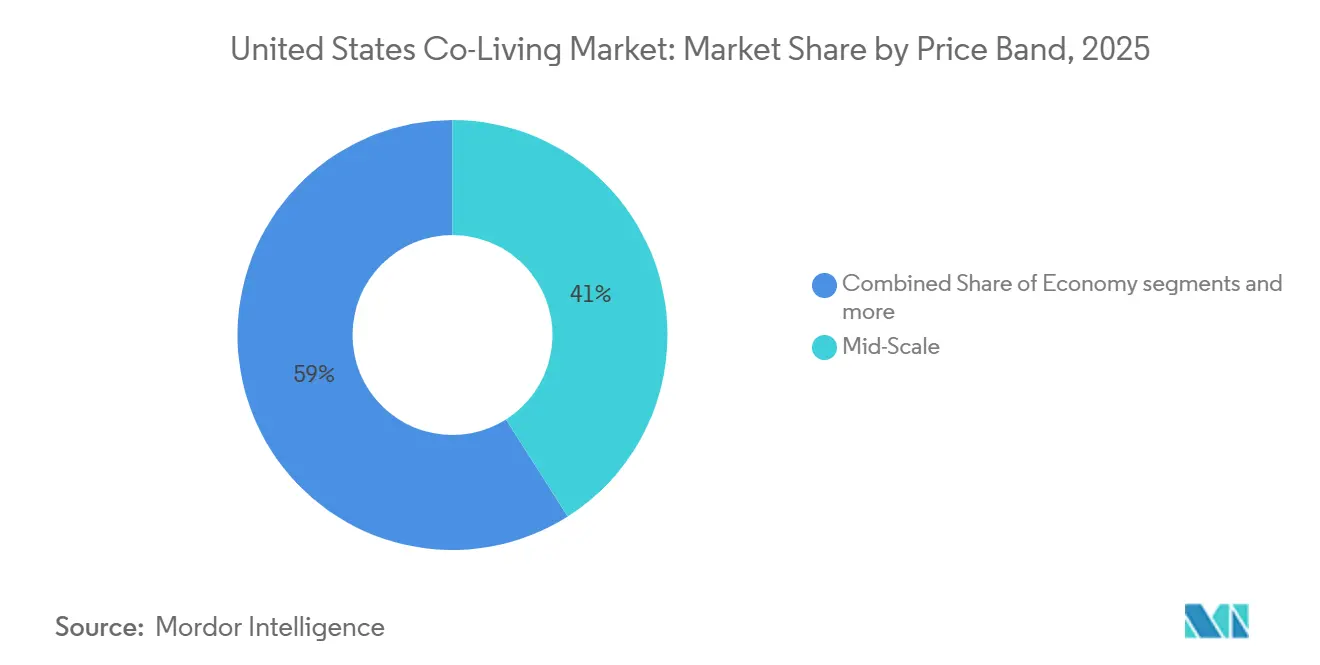
Mid-Scale accounted for 41% of the United States co-living market in 2025 and is projected to expand at a 16.55% CAGR through 2031. That combination shows that the United States co-living market is centering on a value-led middle tier rather than splitting cleanly into only economy and luxury formats. Mid-scale fits renters who earn too much for subsidized housing but still struggle to absorb private studio rents in major cities. It also aligns well with the current resident mix of working professionals and students who want furnished housing, flexible leases, and predictable monthly costs.
Economy co-living remains important because platforms such as PadSplit served residents with a median income of USD 32,500 across 40 United States markets in April 2026. That tier draws from the same affordability base that included 22.7 million cost-burdened renter households in 2024. Premium / luxury co-living still serves digital nomads, international professionals, and urban workers who value location and service depth, but the greatest unmet demand sits in the middle. Outpost Group’s portfolio showed that furnished private rooms can start at nearly USD 700 in lower-cost cities and rise to USD 1,000 in New York, illustrating how Mid-Scale bridges affordability and managed quality. The United States co-living industry is therefore seeing the strongest pull in a band that preserves some privacy without losing the price advantage that defines the category.
By End User: Students Accelerate as Working Professionals Anchor the Base
Working professionals accounted for 55% of demand in 2025, making them the anchor segment of the United States co-living market. Their role reflects job-driven relocation, a preference for flexible lease terms, and a willingness to pay for furnished, managed housing that reduces moving friction. Outpost Group’s 2026 tenant survey showed that full-time professionals made up 52% of residents, and only 20% were first-time renters, suggesting an experienced renter base with clear service expectations. This base supports a more stable demand profile because many residents are using co-living as a deliberate housing solution rather than a temporary stopgap.
Students are forecast to grow at a 16.90% CAGR through 2031, which makes them the fastest-rising end-user group in the United States co-living market. Growth in this segment reflects the gap left by constrained student accommodation supply in large education markets, as well as the appeal of furnished shared spaces near campus and urban transport nodes. Outpost Group also reported that roughly one-third of residents were students, which shows that the student base is already material to current occupancy. Pew noted that single-person households accounted for 29% of all households in the United States in 2022, up from 13% in 1960, suggesting the potential pool of independent renters is growing. That demographic backdrop helps the United States co-living market build a longer user pipeline from student entry to early-career professional retention.
Geography Analysis
New York City accounted for 27% of the United States' co-living market share in 2025, making it the country's largest concentration. That leadership reflects a combination of high rents, dense employment clusters, and a renter base that now extends well beyond the lowest income bands. Harvard reported in 2026 that renter households earning USD 45,000 to USD 74,999 recorded a 9.5 percentage point rise in burden rates since 2019, which supports stronger shared-housing demand in expensive coastal metros[2]. The city, therefore, remains the clearest example of how affordability pressure can widen the user base for the United States co-living market. It also remains central to operator strategy because regulatory progress there would directly affect future supply depth.
Austin is forecast to grow at a 17.00% CAGR through 2031, putting it at the forefront of city-level expansion in the United States co-living market. The city’s appeal is tied to lower operating friction than many coastal metros and to a demand base that is receptive to room-rental formats. Pew’s 2024 review of shared-housing legislation showed that state-level reform momentum is broadening across the country, which strengthens the backdrop for cities where co-living can scale with fewer zoning barriers. PadSplit’s January 2026 move into 4 additional metros also showed that operators are treating newer city clusters as viable growth engines rather than only satellite experiments. This shift matters because it reduces the United States co-living market’s reliance on a small group of gateway cities.
Other cities are gaining importance as the United States co-living market spreads across broader Sun Belt and secondary metro networks. Expansion into Nashville, Sacramento, Portland, and Seattle in early 2026 signaled that room demand is no longer confined to the oldest co-living hubs. Pew also noted that 1 in 4 United States roommates is now 45 years or older, which indicates that shared living demand is widening across age groups and local markets. As a result, geographic expansion is becoming less dependent on one renter profile and more tied to a repeatable affordability-and-flexibility proposition.
Competitive Landscape
The United States co-living market remains fragmented, but consolidation is moving faster than it did in earlier growth cycles. The clearest example came in November 2025, when Outpost and June Homes merged to form Outpost Group, creating the largest U.S. co-living operator with nearly 4,000 units across 7 cities and an estimated annual revenue of USD 65 million. That move gave the United States co-living market a larger-scale platform built on management agreements rather than heavy direct asset ownership. A second strategic move came in April 2026, when PadSplit secured new financing from ORIX Corporation USA and reported more than 32,000 rooms across 40 U.S. markets[3]. These 2 models show that both premium managed formats and affordable technology-enabled room platforms can attract capital in the United States co-living market.
The competitive lesson from recent failures has been consistent. Asset-heavy expansion created greater exposure when occupancy, financing, or unit economics weakened. By contrast, the operators still expanding in the United States co-living market have mostly favored asset-light, fee-based, or marketplace structures that can grow without carrying the full real estate risk on their balance sheets. This shift is also changing landlord behavior because property owners can now compare direct ownership risk with management-agreement or marketplace formats that promise faster stabilization. It leaves room for operators to manage underused inventory, standardize resident onboarding, and improve matching and retention without incurring excessive capital strain.
A third strategic move came in March 2026, when Vidle Housing partnered with June Homes, now part of Outpost Group, to route travel healthcare demand into professionally managed furnished housing. That partnership shows that demand diversification is becoming a competitive tool in the United States co-living market, not only a revenue add-on. Competition is therefore moving toward scale, compliance discipline, landlord partnerships, and operating consistency rather than pure expansion speed. The United States co-living market now rewards platforms that can protect occupancy, manage the resident experience, and expand into new metros without repeating the asset-heavy mistakes of the prior cycle.
United States Co-Living Industry Leaders
-
Starcity
-
The Collective
-
Quarters
-
Bungalow
-
June Homes
- *Disclaimer: Major Players sorted in no particular order
Recent Industry Developments
- May 2026: Outpost Group and June Homes published findings from a tenant survey of 2026 co-living residents, revealing that 97% of respondents ranked price as very important, 93% cited location as critical, and 57% said lease flexibility is a "must-have" or "highly important." The data validates the model’s core value proposition and is expected to influence operator product development and investor underwriting standards across the sector.
- April 2026: PadSplit, the country’s largest co-living marketplace, closed a debt financing facility with ORIX Corporation USA’s Growth Capital business to fund technology and data infrastructure investment and scale its platform nationally. PadSplit housed over 75,000 people across 32,000+ rooms in 40 United States markets without federal subsidies, with a median resident income of USD 32,500.
- March 2026: Vidle Housing, a nationwide mid-term rental platform serving travel healthcare professionals, announced a strategic partnership with June Homes, part of Outpost Group, to expand access to fully furnished, professionally managed apartments in key cities. The partnership formally channels healthcare-sector housing demand into co-living inventory, signaling vertical-demand diversification in operator revenue.
- February 2026: PadSplit surpassed 30,000 rooms nationwide, including 10,000+ rooms in metro Atlanta alone. An internal survey conducted alongside the announcement found 82% of residents had previously struggled to access stable housing, reinforcing the platform’s social impact alongside its commercial scale.
United States Co-Living Market Report Scope
The United States Co-Living Market Report is Segmented by Property Configuration (Studio / Entire Unit, Private Room, and Shared Room), Business Model (Asset-Light Master Lease / Lease Arbitrage and More), Price Band (Economy, Mid-Scale, and Premium / Luxury), End User (Students, and Working Professionals), and City (New York City, San Francisco Bay Area, and More). The Market Forecasts are Provided in Terms of Value (USD).
| Studio / Entire Unit |
| Private Room |
| Shared Room |
| Asset-Light Master Lease / Lease Arbitrage |
| Asset-Light Management Agreement |
| Asset-Heavy Own-Develop-Operate |
| Economy |
| Mid-Scale |
| Premium / Luxury |
| Students |
| Working Professionals |
| New York City |
| San Francisco Bay Area |
| Los Angeles |
| Austin |
| Rest of the United States |
| By Property Configuration | Studio / Entire Unit |
| Private Room | |
| Shared Room | |
| By Business Model | Asset-Light Master Lease / Lease Arbitrage |
| Asset-Light Management Agreement | |
| Asset-Heavy Own-Develop-Operate | |
| By Price Band | Economy |
| Mid-Scale | |
| Premium / Luxury | |
| By End User | Students |
| Working Professionals | |
| By City | New York City |
| San Francisco Bay Area | |
| Los Angeles | |
| Austin | |
| Rest of the United States |
Key Questions Answered in the Report
What is the 2031 outlook for the United States co-living demand?
The United States co-living market is projected to reach USD 3.5 billion by 2031, rising from USD 1.7 billion in 2026 at a 15.53% CAGR.
Why are renters choosing shared living more often in the United States?
Affordability is the main reason, since 22.7 million renter households were cost-burdened in 2024 and 12.1 million spent more than 50% of income on rent and utilities
Which resident group drives the largest volume today?
Working professionals led demand with 55% share in 2025, supported by relocation needs, flexible lease preferences, and interest in managed furnished housing.
Which segment is expanding the fastest by end user?
Students are growing fastest at a 16.90% CAGR through 2031, helped by gaps in traditional student housing supply and the appeal of flexible furnished rooms.