
United States Agricultural Rail Freight Transport Market Size and Share
Market Overview
| Study Period | 2020 - 2031 |
|---|---|
| Forecast Data Period | 2026 - 2031 |
| Base Year Market Size (2025) | USD 10.51 Billion |
| Market Size (2026) | USD 11.10 Billion |
| Market Size (2031) | USD 14.37 Billion |
| Growth Rate (2026 - 2031) | 5.30 % |
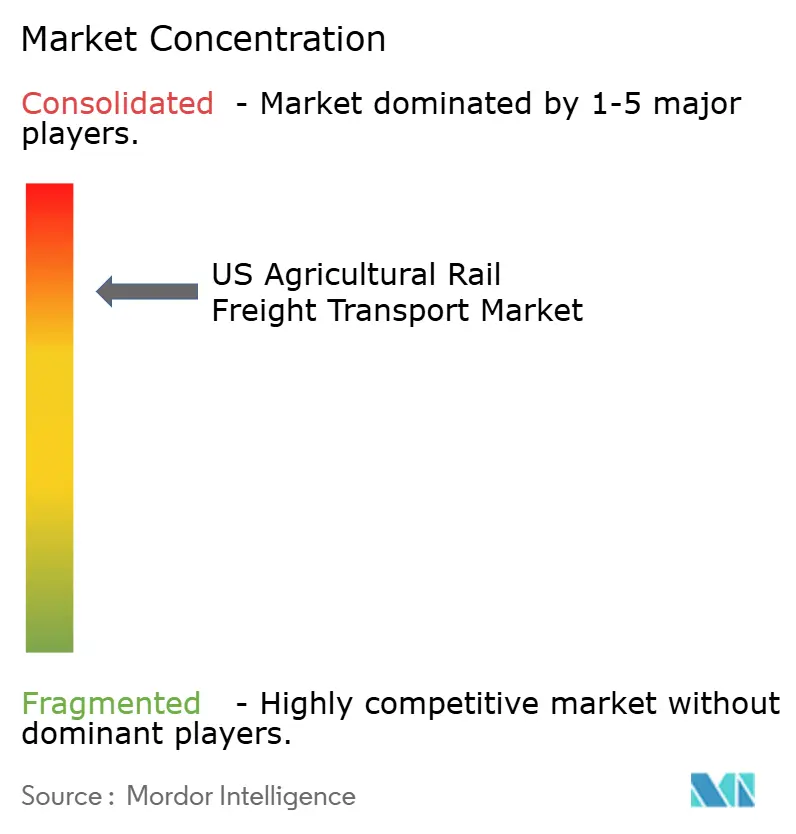
| Market Concentration | High |
Major Players *Disclaimer: Major Players sorted in no particular order Image © Mordor Intelligence. Reuse requires attribution under CC BY 4.0. | |
United States Agricultural Rail Freight Transport Market Analysis by Mordor Intelligence
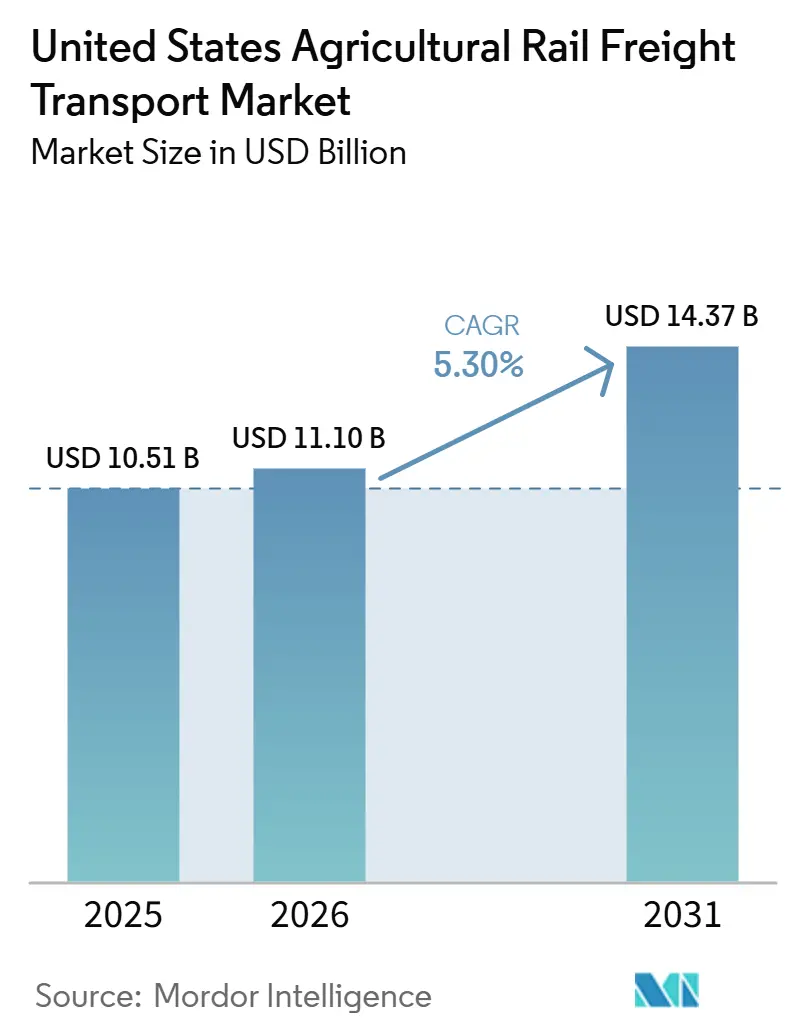
The United States agricultural rail freight transport market size was valued at USD 10.51 billion in 2025 and estimated to grow from USD 11.10 billion in 2026 to reach USD 14.37 billion by 2031, at a CAGR of 5.30% during the forecast period (2026-2031).
The United States agricultural rail freight transport market is performing steadily, supported by its essential role in moving bulk commodities such as grain, feed, and other farm products over long distances with cost efficiency and broad network reach. Rail remains an important option for agricultural shippers because it is well-suited to large-volume movements and often provides a more economical alternative to trucking for long-haul routes. Service reliability, seasonal shipment patterns, and the need for smooth coordination across the wider supply chain also influence the market. Looking ahead, the outlook remains positive as rail continues to benefit from its efficiency, sustainability, and importance in the United States agricultural logistics. At the same time, ongoing investments in operations and infrastructure should support gradual growth despite competitive and capacity-related challenges.
Key Report Takeaways
- By commodity type, grains and cereals accounted 38.54% of the United States agricultural rail freight transport market share in 2025, while fertilizers and agricultural inputs are forecasted to expand at a 6.80% CAGR through 2031.
- By shipment type, domestic agricultural transportation accounted for 84.28% of the United States agricultural rail freight transport market size in 2025, while international cross-border agricultural transportation is projected to grow at a 6.17% CAGR through 2031.
- By rail car type, general railcars accounted for 88.15% of the United States agricultural rail freight transport market share in 2025, while refrigerated railcars are forecasted to expand at a 7.69% CAGR through 2031.
- By end user, grain elevators and aggregators held 31.04% of the United States agricultural rail freight transport market size in 2025, while commodity trading companies are expected to record the highest CAGR at 7.54% through 2031.
- By region, the Midwest captured 39% of the United States agricultural rail freight transport market share in 2025, while the West is forecasted to expand at a 5.81% CAGR through 2031.
Note: Market size and forecast figures in this report are generated using Mordor Intelligence’s proprietary estimation framework, updated with the latest available data and insights as of January 2026.
United States Agricultural Rail Freight Transport Market Trends and Insights
Drivers Impact Analysis*
| Driver | (~) % Impact on CAGR Forecast | Geographic Relevance | Impact Timeline |
|---|---|---|---|
| Rising grain export dependence on rail | +1.3% | Midwest, Northern Plains, Pacific Northwest, Gulf Coast | Short term (≤ 2 years) |
| Fertilizer backhaul economics strengthen utilization | +0.7% | Midwest, Southern Plains, Southeast | Medium term (2-4 years) |
| Seasonal harvest spikes support unit train demand | +0.8% | Midwest, Northern Plains, Central Plains | Short term (≤ 2 years) |
| Under-served rural elevator networks create long-haul rail stickiness | +0.5% | Northern Plains, Central Plains, rural Midwest | Long term (≥ 4 years) |
| Growth in soybean crushing and feed demand rebalances freight flows | +0.9% | Midwest, Southeast, West Coast | Medium term (2-4 years) |
| Decarbonization pressure favors rail over truck for long-haul bulk moves | +0.6% | Global, with early gains in California, the East Coast | Long term (≥ 4 years) |
| Source: Mordor Intelligence | |||
Rising Grain Export Dependence on Rail
The United States agricultural rail freight transport market is receiving direct support from export demand, as grain remains the largest volume category on the rail network. Class, I railroads originated 1.38 million grain carloads in 2025, which was the highest annual total since the USDA began this series in 2017. BNSF also reported record corn volumes in 2025, while Pacific Northwest corn export inspections reached 24.2 million metric tons, showing how export growth is pushing more grain into western rail corridors[1]Source: BNSF Railway, “BNSF Made Gains in Grains in 2025,” BNSF Railway, bnsf.com Source: Agricultural Retailers Association, “Rate, Service Issues Flagged by Ag Retailers in Union Pacific-Norfolk Southern Rail Merger,” FreightWaves, freightwaves.com. That pattern is widening the number of active destinations and reducing reliance on any single buyer, which makes rail flows more geographically balanced than they were earlier in the decade. Stronger export pull is also supporting more consistent unit-train use, especially on links between Plains elevators and Gulf or Pacific Northwest terminals.
Fertilizer Backhaul Economics Strengthen Utilization
The United States agricultural rail freight transport market is benefiting from fertilizer backhaul, as the same networks that move grain outbound can carry crop inputs inbound on return cycles. The Agricultural Retailers Association stated in 2026 filings that 2/3 of United States crop fertilizer moves by rail, and it also noted the large truck-replacement value of each covered hopper car. Construction also began in October 2025 on a Mid-Plains rail unit train terminal designed with fertilizer backhaul capability on return moves[2]Source: National Sorghum Producers, “Opening Markets for Mid-Plains Grain,” National Sorghum Producers, sorghumgrowers.com. Better backhaul balance lowers empty mileage, raises equipment productivity, and strengthens the cost case for rail in both grain and agricultural input logistics.
Seasonal Harvest Spikes Support Unit Train Demand
The United States agricultural rail freight transport market continues to benefit from harvest concentration because crop movement still peaks within narrow seasonal windows. BNSF entered the 2025 harvest season with 29,000 active grain cars, while CPKC expanded its dedicated United States-Canada grain train program to 140 trains in 2025, up by 40 from 2024. USDA also reported 2,265 unfilled manifest grain car orders nationwide during the week ending December 13, 2025, nearly double the comparable four-week average from the prior year. That gap shows how quickly demand tightens when production is high, and storage space becomes harder to manage at country elevators. In practice, strong harvest pressure keeps unit trains in demand because large shippers need fast cycle times and assured capacity when bins fill quickly.
Under-Served Rural Elevator Networks Create Long-Haul Rail Stickiness
The United States agricultural rail freight transport market remains durable in many rural areas because local access to barge corridors and large inland processors is limited. Genesee & Wyoming said its 2025 industrial development results included 44 projects across 16 states, more than USD 1 billion in customer investments, and more than 82,000 expected incremental carloads, with agriculture and chemicals among the largest sectors. BNSF also opened more than a dozen new rail-served agricultural facilities in 2025, including grain and fertilizer sites in Wisconsin and Kansas. Each new rail-served origin point reduces first-mile dependence on trucking and ties more elevator activity to specific rail corridors for several seasons at a time. That raises customer retention for both short lines and Class I carriers because the service relationship becomes part of the local physical supply chain.
Restraints Impact Analysis*
| Restraint | (~) % Impact on CAGR Forecast | Geographic Relevance | Impact Timeline |
|---|---|---|---|
| Railcar availability tightens during peak harvest windows | -0.5% | Midwest, Northern Plains, Western grain corridors | Short term (≤ 2 years) |
| Temperature-sensitive produce still favors trucking | -0.3% | Southeast, West Coast, Northeast produce corridors | Long term (≥ 4 years) |
| Service disruptions and crew constraints affect grain reliability | -0.4% | Eastern United States (NS-served markets), National | Medium term (2-4 years) |
| Inland waterway competition caps certain commodity rail volumes | -0.3% | Mississippi River System, Gulf Region, Columbia-Snake System | Long term (≥ 4 years) |
| Source: Mordor Intelligence | |||
Railcar Availability Tightens During Peak Harvest Windows
The United States agricultural rail freight transport market still faces tight capacity during peak harvest periods, even when annual fleet readiness improves. USDA reported 2,265 unfilled manifest grain car orders nationally during the week ending December 13, 2025, and North Dakota alone accounted for 893 of those orders. Minnesota also exceeded 400 unfilled orders during the same period, underscoring the pressure on major producing states with limited alternative transport options. BNSF and CPKC both added harvest resources, but the remaining order backlog shows that fleet additions alone do not remove seasonal bottlenecks. When rail placements do not arrive on time, shippers either absorb higher trucking costs or accept weaker local pricing as elevator storage tightens.
Service Disruptions and Crew Constraints Affect Grain Reliability
The United States agricultural rail freight transport market is also constrained by labor availability, as service reliability depends on qualified crews as much as on track or equipment. The Brotherhood of Locomotive Engineers and Trainmen said in June 2026 that Norfolk Southern faced critical workforce shortages and described the condition as one of the worst seen in decades[3]Source: Brotherhood of Locomotive Engineers and Trainmen, “Norfolk Southern, BLET Questions Manpower Shortages and Impact on Safety at the Class I Railroad,” BLET, blet.org . Norfolk Southern also reported in 2025 that it was building new customer-facing tools such as RailGreen, yet service quality remains central because operational disruptions can quickly offset commercial innovation. In eastern grain and feed corridors, this matters because delays affect delivery windows for processors and livestock customers that depend on scheduled inbound supply. Persistent crew shortages can therefore shift customer preference toward carriers and routing options that show steadier execution, even when headline rates are similar.
*Our forecasts treat driver/restraint impacts as directional, not additive. The impact forecasts reflect baseline growth, mix effects, and variable interactions.
Segment Analysis
By Commodity Type: Bulk Grains Lead While Agricultural Input Logistics Reshape the Mix
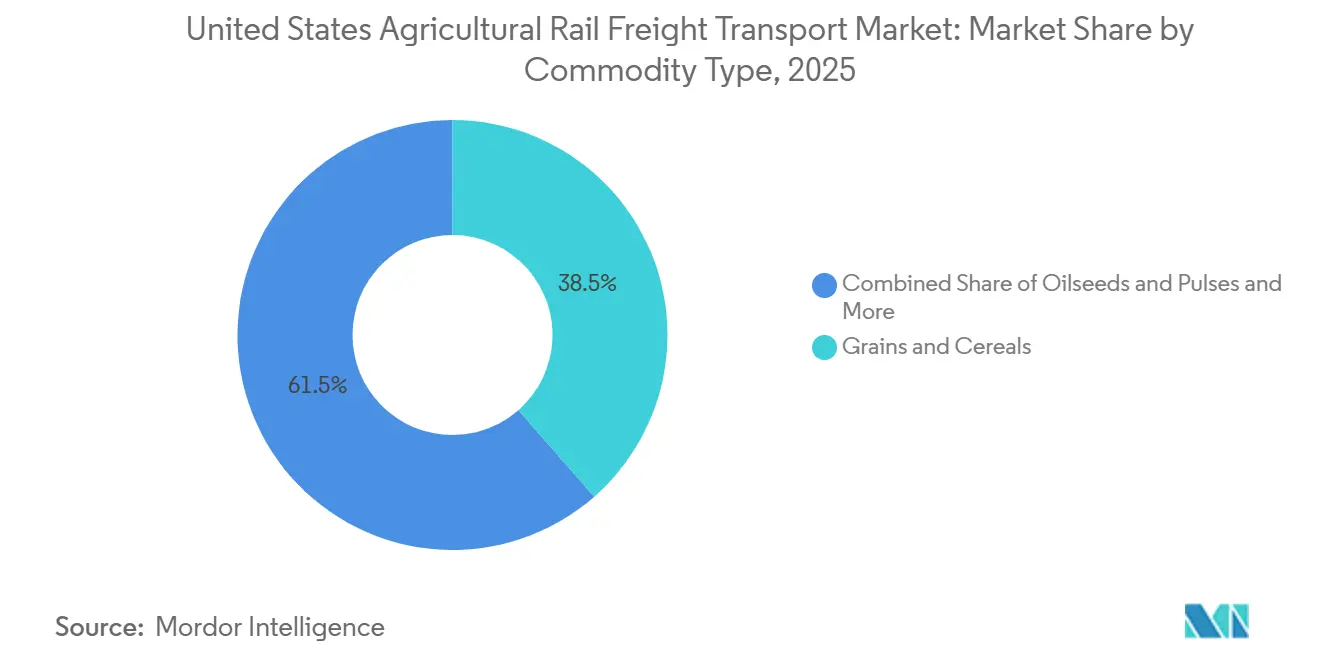
Grains and cereals accounted for 38.54% of the United States agricultural rail freight market share in 2025, making them the largest commodity segment by revenue. BNSF reported record corn volumes in 2025, and Pacific Northwest corn export inspections reached 24.2 million metric tons, reinforcing the link between export demand and bulk grain rail usage. That scale keeps covered hopper utilization high and supports the economics of large shuttle loops between interior origins and export terminals. It also helps explain why grain lanes remain the main benchmark for service performance across the broader United States agricultural rail freight transport industry.
Fertilizers and agricultural inputs are the fastest-growing commodity segment at a 6.80% CAGR through 2031, supported by the backhaul model that connects outbound grain with inbound crop nutrients. The Agricultural Retailers Association noted the strong dependence of fertilizer distribution on rail, especially for long-haul moves that would be much harder to serve efficiently by truck. Oilseeds and pulses are also changing roles, as the USDA’s soybean crush outlook points to more domestic processing and increased outbound soybean meal traffic. Fresh produce, sugar crops, and cotton remain smaller rail categories because they depend more heavily on corridor-specific economics, handling requirements, and time sensitivity than grains do.



By Shipment Type: Domestic Flows Anchor Volume While Cross-Border Rail Gains Momentum
Domestic agricultural transportation accounted for 84.28% of the United States' agricultural rail freight market size in 2025, reflecting the strength of internal grain, feed, fertilizer, and crush-related flows. Dense elevator-to-terminal and plant-to-customer movements across the Midwest, the Plains, the Gulf Coast, and the Pacific Northwest anchor this segment. Those lanes benefit from fixed infrastructure, recurring seasonal patterns, and the long trains that keep rail costs competitive for bulk commodities. Domestic demand also remains broad enough to support investment in yard capacity, loading sites, and equipment productivity across multiple rail networks.
International cross-border agricultural transportation is projected to grow at a 6.17% CAGR through 2031, making it the faster-growing shipment segment. CPKC set new monthly grain records across 2026, showing steady momentum in North American agricultural corridors that cross the United States-Canada network[4]Source: Canadian Pacific Kansas City, “CPKC Sets New February Monthly Grain Records,” PR Newswire, prnewswire.com. BNSF also implemented a single-destination Mexico wheat train service from March 2026, which improved direct delivery efficiency in that corridor. As Mexico grows in importance for grains and related products, cross-border rail is becoming a more stable growth layer rather than only a supplemental route during export shifts.
By Rail Car Type: Hopper Dominance Persists, but Refrigerated Cars Accelerate
General railcars accounted for 88.15% of the United States agricultural rail freight market share in 2025, reflecting the central role of covered hoppers in grain and fertilizer logistics. The volume concentration of corn, wheat, soybeans, and crop inputs in the largest corridors of the United States agricultural rail freight transport market reinforces that position. BNSF entered the 2025 harvest season with 29,000 active grain cars, which shows how much system readiness still depends on this equipment class. Union Pacific’s next-generation covered hopper design, introduced in 2026, also points to continued efforts to improve payload efficiency within fixed train lengths.
Refrigerated railcars are projected to grow at a 7.69% CAGR through 2031, even though they currently have a much smaller share. Lineage Logistics operated more than 2,800 refrigerated and insulated boxcars as of November 2025 following its earlier Cryo-Trans acquisition, giving the market a large, specialized reefer fleet. Norfolk Southern’s RailGreen program and broader shipper interest in measurable emissions performance can support more reefer rail adoption where transit windows are acceptable. The main opportunity lies in produce and frozen-food corridors where same-day availability, cold-chain traceability, and consistent scheduling can shift freight away from trucking.
By End User: Elevators Anchor the System While Trading Companies Pursue Direct Access
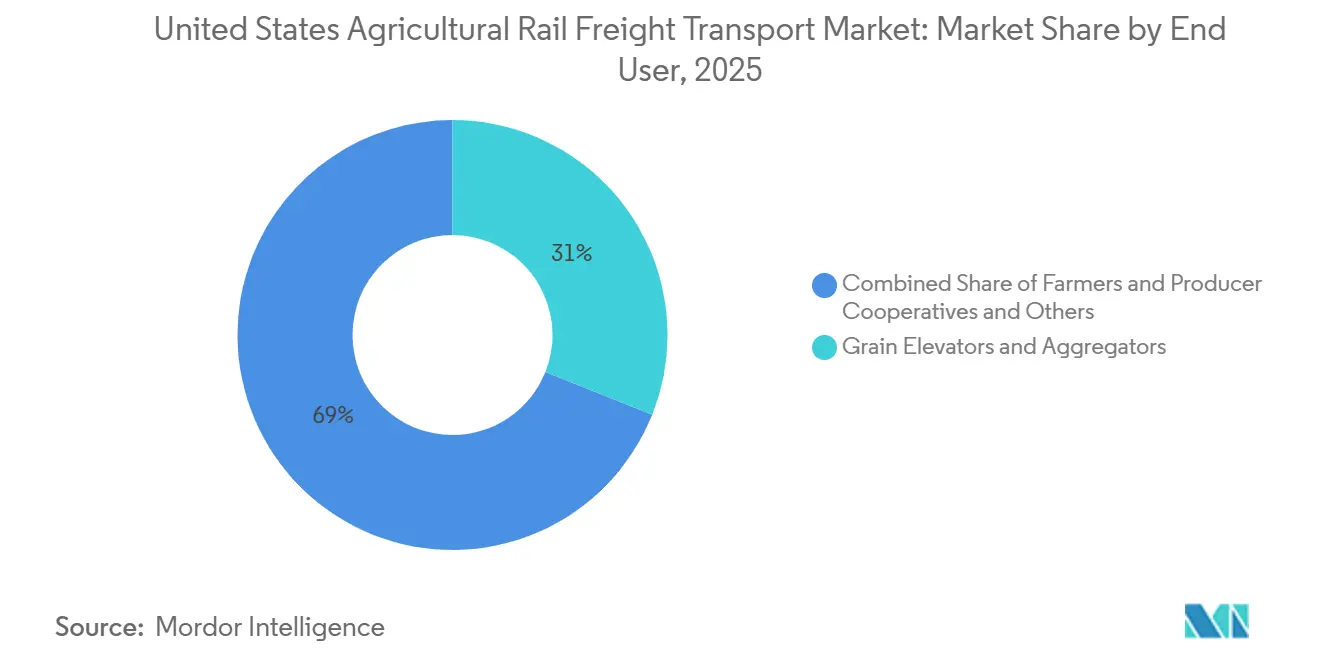
Grain elevators and aggregators accounted for 31.04% of the United States agricultural rail freight market size in 2025, making them the largest end-user group. Their role remains central because they connect farm origination, storage management, unit-train loading, and terminal routing into a single operating node. BNSF’s broader expansion of rail-served agricultural facilities in 2025 supports this segment by extending direct rail access farther into origin areas. As harvest pressure rises, the value of secured shuttle access increases, which keeps elevators and aggregators in a strong negotiating position with carriers and merchandisers.
Commodity trading companies are expected to expand at a 7.54% CAGR through 2031, making them the fastest-growing end-user segment. This reflects a shift toward tighter control of transport slots, export timing, and basis management as trading houses move closer to physical origination. Projects highlighted by Genesee & Wyoming and CHS show that processing and export-linked investments are bringing more rail-linked decisions directly under large commercial operators. Feed manufacturers and fertilizer distributors are also expanding their use of rail because regular procurement programs help stabilize inbound supply and reduce reliance on spot transport during high-demand periods.
Geography Analysis
The Midwest accounted for 39% of the United States' agricultural rail freight market share in 2025, making it the core revenue region. The region combines dense grain origination, large elevator networks, soybean processing growth, and direct links to both Gulf Coast and Pacific Northwest export gateways. BNSF expanded its agricultural facility footprint in 2025 with new grain and fertilizer sites in Wisconsin and Kansas, which strengthened rail access across the core producing territory. Genesee & Wyoming also reported broad customer investment activity across 16 states, much of it tied to agriculture and chemicals, which supports deeper feeder traffic in rural corridors. Because the Midwest sits at the center of grain, crush, feed, and fertilizer flows, service quality in this region has an outsized effect on the full national market.
The West is projected to grow at a 5.81% CAGR through 2031, making it the fastest-growing region in the United States agricultural rail freight transport market. BNSF’s reported Pacific Northwest corn export record in 2025 showed how export pull is elevating the importance of the western corridor for central and northern Plains grain. California and the broader western network are also benefiting from renewable fuels and crush-related logistics, which increase demand for both inbound feedstocks and outbound products. BNSF’s 2026 capital plan included expansion and efficiency projects such as Barstow International Gateway and Logistics Park Phoenix, both of which strengthen the long-term freight base serving western markets.
The Southeast is seeing faster modal competition as carriers try to capture more agricultural and food-related freight through upgraded infrastructure and service programs. CSX reopened the expanded Howard Street Tunnel in 2025, enabling double-stacked train movement through a key East Coast corridor and improving access tied to Atlantic port flows. Norfolk Southern is also trying to differentiate its service through RailGreen, which gives sustainability-focused shippers another reason to evaluate rail on eastern routes. The Northeast and Southwest remain smaller in absolute terms, but both benefit when cross-network investments improve connections between origin regions, inland terminals, and export or consumption markets.
Competitive Landscape
The United States agricultural rail freight transport market is highly concentrated because a small group of Class I railroads controls the main grain, fertilizer, and feed corridors across the country. Major Class I carriers control around 90% of the United States rail freight traffic, leaving limited room for broad-based national competition. This structure gives BNSF and Union Pacific especially strong positions in western grain shuttle lanes, while CSX and Norfolk Southern shape most eastern access patterns. Competition, therefore, depends less on the number of players and more on corridor ownership, interchange options, service reliability, and capital discipline.
BNSF’s USD 3.6 billion capital investment plan for 2026 is one of the clearest recent examples of strategic competition through network spending. The company also reported more than a dozen new rail-served agricultural facilities in 2025, deepening origin access and expanding its hold on recurring bulk commodity traffic. Norfolk Southern took a different route by launching RailGreen, a customer-facing emissions product designed to make rail sustainability claims verifiable for shippers. CSX strengthened its position by reopening the Howard Street Tunnel ahead of schedule, expanding freight flexibility along an important East Coast route.
Short-line and regional operators remain essential, even though Class I systems dominate the top tier of the United States agricultural rail freight transport market. Genesee & Wyoming’s 2025 industrial development results showed how feeder railroads create new captive traffic through site development, plant expansion, and export-linked projects. Watco also invested in yard technology and locomotive efficiency improvements in 2025, which shows that service competitiveness at the regional level is increasingly tied to operating precision and customer responsiveness. CPKC’s string of monthly grain records in 2026 further shows that cross-border carriers can gain share by improving throughput on integrated North American lanes. Even so, the balance of power still sits with the large corridor owners, and that keeps pricing leverage and network control concentrated in a small number of hands.
United States Agricultural Rail Freight Transport Industry Leaders
BNSF Railway
Union Pacific Railroad (UP)
Norfolk Southern Corporation (NS)
CSX Transportation
Canadian National Railway (CN)
- *Disclaimer: Major Players sorted in no particular order

Recent Industry Developments
- January 2026: Genesee & Wyoming announced USD 1 billion-plus in 2025 industrial development results across 44 projects in 16 states, expected to generate more than 82,000 incremental carloads and more than 700 jobs. Major projects include Incobrasa Industries' USD 400 million soybean-processing and biodiesel expansion in Illinois and Ag Processing Inc.'s (AGP) soybean export expansion in Washington via the Puget Sound & Pacific Railroad.
- January 2026: BNSF announced its USD 3.6 billion 2026 capital investment plan, including USD 2.8 billion for infrastructure maintenance and USD 358 million for expansion and efficiency projects covering the Barstow International Gateway, a Logistics Park Phoenix development, and yard expansions in Galesburg, Illinois, and Winslow, Arizona.
- September 2026: Watco deployed autonomous yard switching technology via Intramotev at its Wood River Terminal in Illinois, reducing emissions and safety risks in shunting operations. Watco also installed auxiliary power units, or layover heaters, on 233 locomotives at more than 30 locations, reducing locomotive idling emissions and fuel consumption.
- April 2025: Norfolk Southern launched RailGreen, an industry-first program developed in partnership with 123Carbon, enabling freight customers, including agricultural shippers, to claim verified, auditable rail-based emissions reductions through a book-and-claim mechanism, addressing Scope 3 supply-chain emissions for food and agribusiness companies.


United States Agricultural Rail Freight Transport Market Report Scope
| Grains and Cereals |
| Oilseeds and Pulses |
| Sugar Crops and Processed Sugar |
| Cotton |
| Fertilizers and Agricultural Inputs |
| Animal Feed and Feed Ingredients |
| Fresh and Perishable Agricultural Produce |
| Other Agricultural Commodities |
| Domestic Agricultural Transportation |
| International Cross-Border Agricultural Transportation |
| Refrigerated Railcars |
| General Railcars |
| Farmers and Producer Cooperatives |
| Grain Elevators and Aggregators |
| Commodity Trading Companies |
| Food and Beverage Manufacturers |
| Feed Manufacturers |
| Sugar Processors |
| Cotton Processors and Textile Companies |
| Fertilizer Manufacturers and Distributors |
| Other Agricultural Processors |
| Northeast |
| Southeast |
| Midwest |
| Southwest |
| West |
| By Commodity Type | Grains and Cereals |
| Oilseeds and Pulses | |
| Sugar Crops and Processed Sugar | |
| Cotton | |
| Fertilizers and Agricultural Inputs | |
| Animal Feed and Feed Ingredients | |
| Fresh and Perishable Agricultural Produce | |
| Other Agricultural Commodities | |
| By Shipment Type | Domestic Agricultural Transportation |
| International Cross-Border Agricultural Transportation | |
| By Rail Car Type | Refrigerated Railcars |
| General Railcars | |
| By End User | Farmers and Producer Cooperatives |
| Grain Elevators and Aggregators | |
| Commodity Trading Companies | |
| Food and Beverage Manufacturers | |
| Feed Manufacturers | |
| Sugar Processors | |
| Cotton Processors and Textile Companies | |
| Fertilizer Manufacturers and Distributors | |
| Other Agricultural Processors | |
| By Region | Northeast |
| Southeast | |
| Midwest | |
| Southwest | |
| West |


Key Questions Answered in the Report
What is the 2031 value forecast for the United States agricultural rail freight transport?
The sector is forecast to reach USD 14.37 billion by 2031, rising from USD 11.10 billion in 2026 at a 5.30% CAGR.
Which commodity group leads rail freight revenue in the United States agriculture?
Grains and cereals lead the sector with a 38.54% share in 2025, supported by strong export volumes and unit-train economics.
Which shipment category is growing faster, domestic or cross-border?
Domestic transport remains much larger, with a 84.28% share in 2025, but cross-border shipments are expanding faster at a 6.17% CAGR through 2031.
Why are fertilizers and agricultural inputs growing faster on rail?
They benefit from backhaul economics, long-haul rail suitability, and stronger integration with grain corridors, which supports a 6.80% CAGR through 2031.
What makes the Midwest the largest regional center for agricultural rail freight?
The Midwest held 39% share in 2025 because it combines grain origination, elevators, soybean processing, and direct links to export gateways.
Why are refrigerated railcars attracting more attention?
Refrigerated railcars are projected to grow at a 7.69% CAGR as shippers seek lower-emission transport, better cold-chain traceability, and more rail options for temperature-sensitive goods.
Page last updated on:





