United Kingdom Global Capability Centers Market Size and Share
Market Overview
| Study Period | 2020 - 2031 |
|---|---|
| Forecast Data Period | 2026 - 2031 |
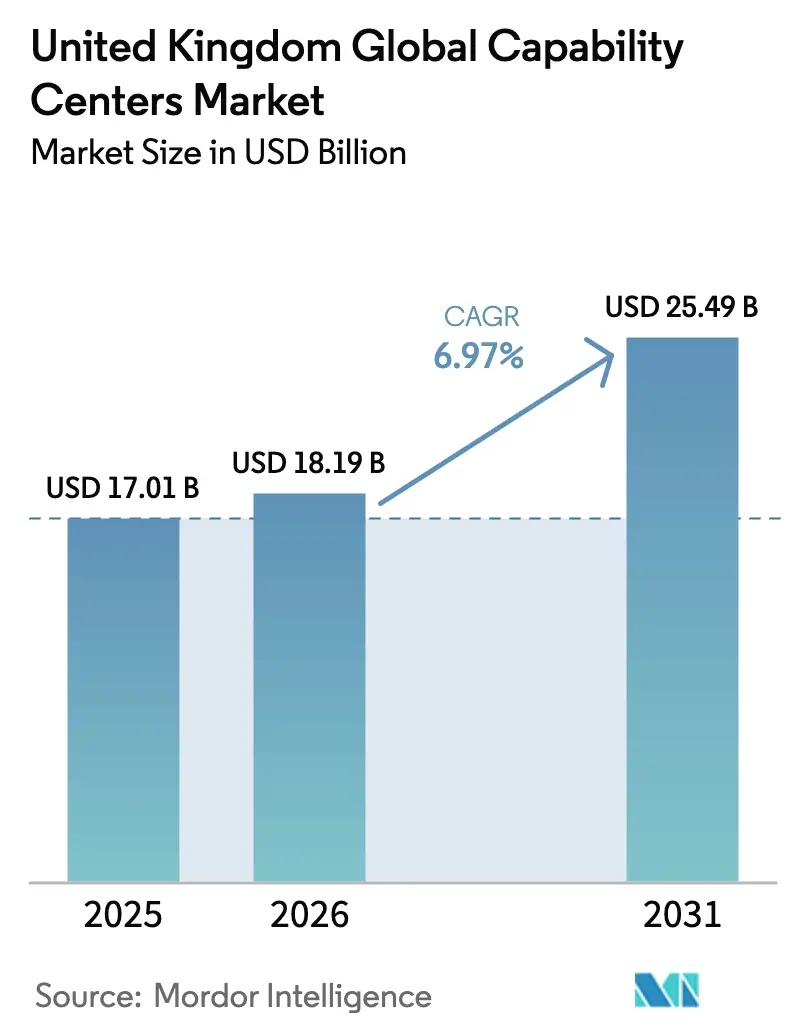
| Base Year Market Size (2025) | USD 17.01 Billion |
| Market Size (2026) | USD 18.19 Billion |
| Market Size (2031) | USD 25.49 Billion |
| Growth Rate (2026 - 2031) | 6.97% CAGR |
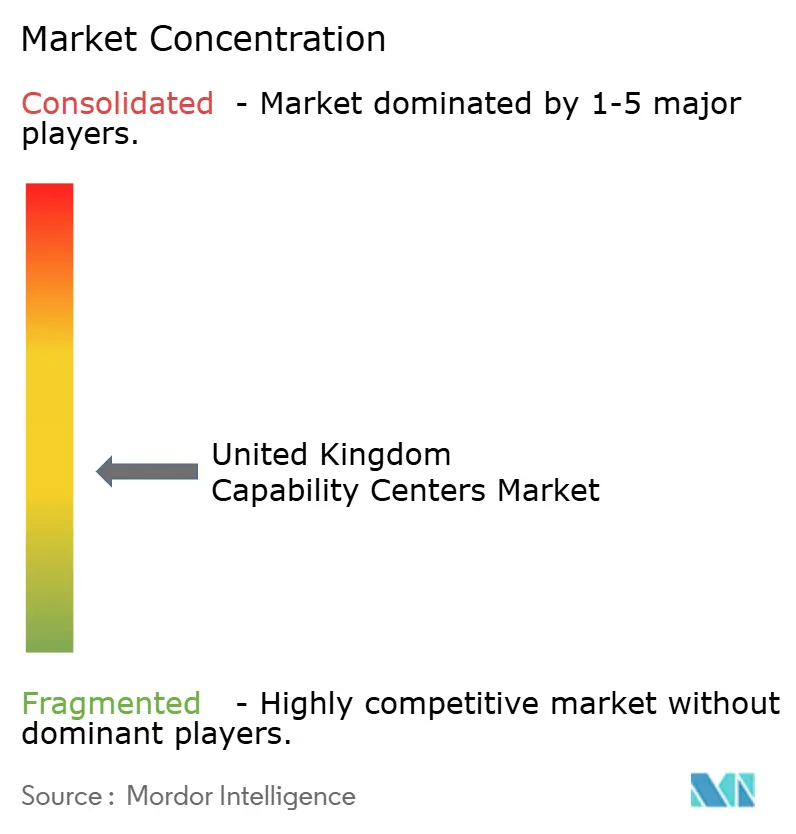
| Market Concentration | Medium |
Major Players *Disclaimer: Major Players sorted in no particular order Image © Mordor Intelligence. Reuse requires attribution under CC BY 4.0. | |
United Kingdom Global Capability Centers Market Analysis by Mordor Intelligence
UK Global Capability Centers market size in 2026 is estimated at USD 18.19 billion, growing from 2025 value of USD 17.01 billion with 2031 projections showing USD 25.49 billion, growing at 6.97% CAGR over 2026-2031. Robust expansion comes from companies that want high-value hubs near key European customers while staying within U.K. data rules. Fiscal perks tied to the post-Brexit policy framework, combined with new tax credits for digital investments, add further pull. A widening digital skills gap prompts firms to establish their own training academies within capability centers, a move that bolsters expertise and fosters local employment.[1]UK Department for Digital, Culture, Media and Sport, “Digital Skills Report 2024,” gov.uk Strong cloud and artificial intelligence adoption, deeper ESG reporting mandates, and fresh data-center projects reinforce the growth path. At the same time, rising London real estate prices and tighter immigration policies are prompting investors to turn to provincial cities, which still offer strong connections to the capital.
Key Report Takeaways
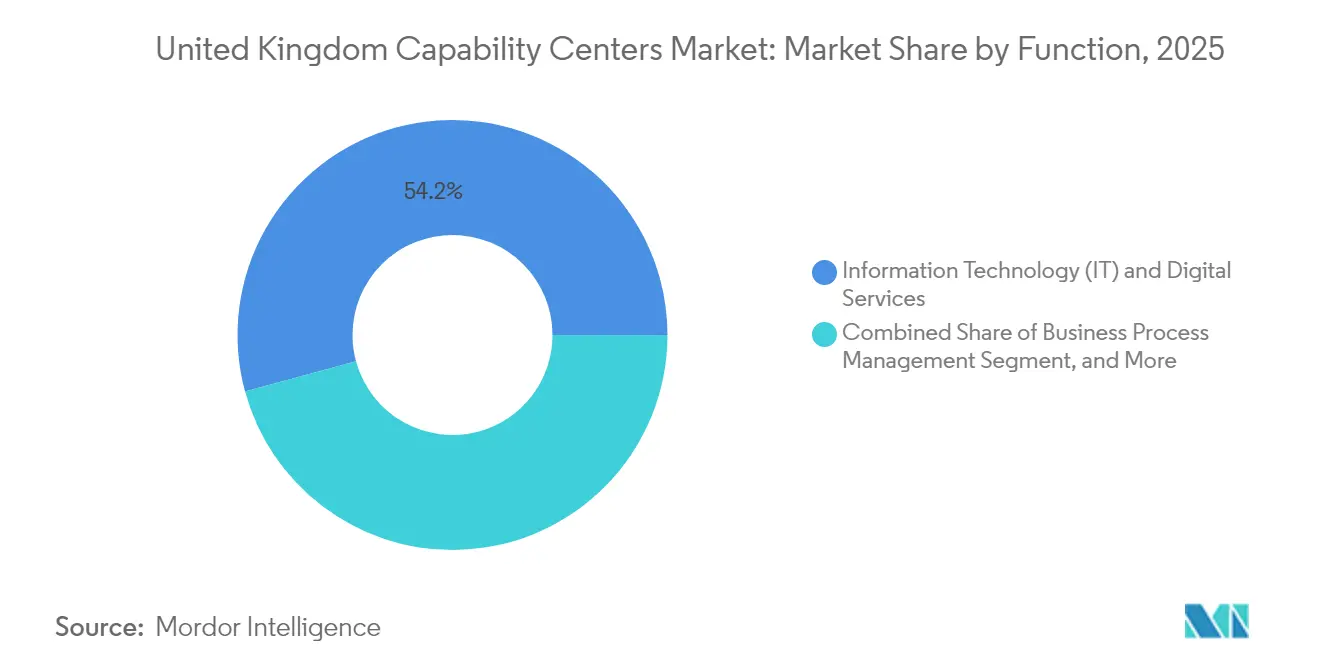
- By function, Information Technology and Digital Services led with 54.23% of the revenue in 2025, while Knowledge Process Outsourcing is expected to compound at a rate of 8.39% through 2031.
- By engagement model, captive operations controlled 61.02% of the business in 2025, and hybrid Build-Operate-Transfer formats are projected to grow at 7.73% to 2031.
- By organization size, large enterprises accounted for 86.74% of activity in 2025, while small and medium enterprises are advancing at an 8.72% CAGR.
- By industry vertical, Banking, Financial Services, and Insurance accounted for 37.88% of spending in 2025, and the Healthcare and Life Sciences sector is projected to track a 7.77% CAGR.
Note: Market size and forecast figures in this report are generated using Mordor Intelligence’s proprietary estimation framework, updated with the latest available data and insights as of 2026.
United Kingdom Global Capability Centers Market Trends and Insights
Drivers Impact Analysis*
| Driver | (~) % Impact on CAGR Forecast | Geographic Relevance | Impact Timeline |
|---|---|---|---|
| Persistent Digital-Skills Gap Fueling Nearshore GCC Expansion | +1.2% | National, concentrated in London, Manchester, Birmingham | Medium term (2-4 years) |
| UK's Post-Brexit Incentives for Retaining High-Value Operations Domestically | +0.9% | National, with emphasis on Northern England and Scotland | Long term (≥ 4 years) |
| Rapid Cloud and AI Adoption Demanding In-Country Data-Compliance Hubs | +1.1% | National, with data center concentrations in London, Edinburgh | Short term (≤ 2 years) |
| Tightening ESG Reporting Requiring Localized Shared-Service Analytics | +0.8% | National, with a regulatory focus on the London financial district | Medium term (2-4 years) |
| Growth of RegTech Creating Specialized Compliance Centers | +0.7% | London, Edinburgh, with spillover to Manchester | Medium term (2-4 years) |
| Under-utilized Provincial Talent Pools Offering Cost Arbitrage | +0.6% | Regional cities: Manchester, Birmingham, Leeds, Glasgow | Long term (≥ 4 years) |
| Source: Mordor Intelligence | |||
Persistent Digital-Skills Gap Fueling Near-Shore GCC Expansion
Eighty-seven percent of employers reported unfilled roles in cloud architecture, machine learning, and cybersecurity during 2024.[2]TechUK, “UK Tech Talent Report 2024,” techuk.org This shortfall raises wages but also prompts multinationals to establish capability centers, where they can develop talent pipelines. Accenture established a training academy in Manchester that integrates university curricula with real-world projects, providing a unique learning experience. Similar moves by other firms anchor new jobs, reduce recruitment costs, and offset visa limits that restrict overseas hiring. The practice turns the UK Global Capability Centers market into both a delivery platform and a workforce incubator, a dual role that reinforces long-term competitiveness.
UK Post-Brexit Incentives for Retaining High-Value Operations Domestically
The Invest 2035 program grants 130% R&D tax relief and faster capital write-offs for digital infrastructure over GBP 10 million, tilting location choices toward the UK hinterland. Financial institutions have already established compliance hubs in Edinburgh and Leeds to facilitate both savings and regulatory access. More than GBP 2.8 billion of confirmed commitments flowed into the UK Global Capability Centers market during the first two years of the scheme, and 60% of that capital targets capability expansion.
Rapid Cloud and AI Adoption Demanding In-Country Data-Compliance Hubs
Cloud uptake increased by 43% in 2024, yet UK GDPR rules require sensitive data to be stored onshore. Microsoft and other hyperscalers have pledged USD 15.7 billion to new data-center campuses, which attract co-located governance and AI risk teams.[3]Microsoft, “UK Investment Announcement 2024,” microsoft.com Banks respond by forming model-validation units that sit beside these centers, keeping audit trails and regulator access close at hand. The setup enhances transaction speed, strengthens security, and enhances the UK Global Capability Centers' market value proposition.
Tightening ESG Reporting Requiring Localized Shared-Service Analytics
Broader ESG disclosure rules now align with the EU Sustainability Directive, requiring listed firms to gather granular emissions data. Companies need analytics staff who grasp both environmental science and finance. New centers in London and select university cities hire teams that map scope 3 supply-chain emissions, prepare regulator filings, and produce investor dashboards. These hubs combine data science with legal expertise, enabling the UK Global Capability Centers to tap into the rapidly growing market for sustainability services.
Restraints Impact Analysis*
| Restraint | (~) % Impact on CAGR Forecast | Geographic Relevance | Impact Timeline |
|---|---|---|---|
| Escalating Commercial Real-Estate Costs in London and the South-East | -0.8% | London, South-East England | Short term (≤ 2 years) |
| Immigration Policy Uncertainty Limiting Non-UK Talent Recruitment | -0.6% | National, with particular impact on London and Edinburgh | Medium term (2-4 years) |
| Fragmented University-Industry Collaboration Outside Golden Triangle | -0.4% | Regional areas outside the London-Oxford-Cambridge corridor | Long term (≥ 4 years) |
| Rising Cyber-Security Insurance Premiums for Multi-tenant Facilities | -0.3% | National, concentrated in financial services hubs | Short term (≤ 2 years) |
| Source: Mordor Intelligence | |||
Escalating Commercial Real-Estate Costs in London and the South-East
Grade-A rents in central London reached GBP 85 per square foot in 2024, a 28% increase since 2023, which is expected to raise occupancy bills for new delivery hubs.[4]CBRE, “London Office Market Report 2024,” cbre.co.uk Larger floor plates suited for collaborative software squads are in short supply, so bid cycles stretch and fit-out budgets swell. Many firms counter by adopting a hub-and-spoke approach that keeps governance teams in London but shifts high-volume work to Manchester or Leeds, where the same space costs 45-60% less. Distributed footprints also enhance continuity planning and reduce employee commuting times, factors that align with tightening ESG scorecards. As a result, the UK Global Capability Centers market favors regional build-outs even when project leaders remain in the capital.
Immigration Policy Uncertainty Limiting Non-UK Talent Recruitment
The skilled-worker visa threshold climbed to GBP 38,700 in 2024, and typical processing now spans 12-16 weeks, slowing hiring for scarce artificial intelligence and cybersecurity roles. Firms respond by deepening their graduate pipelines, but classroom-to-contributor timelines typically run 18-24 months, creating near-term delivery gaps. Some employers tap into virtual talent pools by pairing onshore leads with remote specialists, yet data-sovereignty clauses restrict how far that model can be stretched. Household brands, therefore, invest more in apprenticeship tracks, mirroring the approach that underpins Accenture’s Manchester academy, while lobbying for visa reform that strikes a balance between control and competitiveness. The interplay of slower inflows and faster digital demand shapes a cautious hiring climate that drags on the UK Global Capability Centers market growth outlook.
*Our forecasts treat driver/restraint impacts as directional, not additive. The impact forecasts reflect baseline growth, mix effects, and variable interactions.
Segment Analysis
By Function / Capability: IT Foundations Dominate While Knowledge Work Accelerates
Information Technology and Digital Services captured 54.23% of the UK Global Capability Centers market share in 2025, reflecting the shift from discretionary projects to board-mandated essentials, driven by cloud migration, zero-trust security, and DevSecOps. The segment anchors large teams that manage hybrid clouds, automate test pipelines, and secure data in accordance with the UK GDPR, roles that buyers will not risk placing offshore. That scale advantage attracts hyperscaler alliances, giving these centers first access to new chip architectures and sovereign cloud features. Meanwhile, Knowledge Process Outsourcing is tracking an 8.39% CAGR, the strongest among all functions, as data scientists, actuaries, and patent lawyers converge to interpret regulations, monetize insights, and safeguard intellectual property. The shift widens talent diversity within hubs and raises cross-disciplinary collaboration, which boosts average ticket size and deepens client loyalty.
Engineering and R&D capabilities gain fresh fuel from the 130% R&D tax credit, prompting firms to repatriate prototype development that once sat in lower-cost regions. These teams utilize digital twins, 5G sensors, and additive manufacturing to compress design cycles for automotive, aerospace, and medical technology programs. Business Process Management is no longer only about transaction scale; robotic process automation handles repetitive tasks while human experts manage exceptions that touch risk and experience. The ability to orchestrate that hybrid model locally underpins a dependable service layer that uplifts adjacent knowledge functions. Together, these threads demonstrate why the UK Global Capability Centers market size for high-end services continues to expand, even as simple back-office work plateaus.


By Engagement Model: Control Stays Central While Partnership Risk-Shares Rise
Captive structures held 61.02% of the UK Global Capability Centers market in 2025, as enterprise boards seek end-to-end custody of data, algorithms, and compliance evidence. Direct employment offers clear governance lines and faster protocol updates when regulators adjust guidance, a frequent event in financial services and healthcare. Yet, the capital load and hiring friction have spurred a 7.73% CAGR for hybrid Build-Operate-Transfer contracts, which involve two to three years of provider management before assets are transferred to the client's balance sheet. Providers contribute real estate, hiring scale, and early automation, thereby reducing ramp-up risks, while clients steer the culture, security, and product vision.
Virtual captives add further nuance by allowing a service partner to supply physical space and shared tools under the client’s name, a pattern gaining favor among mid-market firms that lack the credit profile for long-term leases. Transparent service-level dashboards, zero-trust access policies, and DevOps telemetry enable remote managers to validate performance without conducting daily floor walks. Multinationals also experiment with co-investment funds, where both parties inject capital and share the upside from intellectual property created within the center. Across these formats, the UK Global Capability Centers industry exhibits a shift toward flexible governance that maintains strategic control while deferring early-stage cost and speed hurdles.
By Organization Size: Scale Leads but Agility Gains Ground
Large enterprises generated 86.74% of the UK Global Capability Centers market revenue in 2025, a dominance rooted in their ability to fund multi-function campuses and absorb early-stage ramp costs. Most maintain dual-site footprints, with strategy and governance anchored in London, while bulk delivery is located in lower-cost provinces. Board-level scrutiny of cyber risk and audit trails secures mission-critical data within corporate-owned environments, reinforcing the captive preference that defines today’s UK Global Capability Centers' market share. At the same time, expansive cloud-native toolkits have shortened build cycles, allowing smaller firms to spin up secure virtual desktops, automate code pipelines, and apply analytical engines without a heavy capital outlay.
Small and medium enterprises are now expanding at an 8.72% CAGR, supported by voucher grants and sandbox programs that offset consulting and software fees. These firms often pursue single-function centers, such as finance and accounting, customer success, or regulatory reporting, that match near-term budgets yet retain the option to add services later. Providers respond with modular workspace contracts and pay-as-you-grow automation bundles that scale in lockstep with ticket volumes. As the learning curve flattens and success stories multiply, the UK Global Capability Centers market size attributed to SMEs is expected to double its 2025 baseline by 2031, widening participation and injecting fresh competitive pressure into the ecosystem.

By Industry Vertical: Regulated Sectors Anchor, Health Tech Accelerates
Banking, Financial Services, and Insurance owned 37.88% of demand in 2025, driven by the need for compliance, anti-money laundering analytics, and real-time fraud prevention, which requires in-country data stewardship. The UK Global Capability Centers market size tied to these workloads continues to expand as the Financial Conduct Authority widens algorithm review mandates and pushes firms to document model lineage. These requirements reward centers that maintain certified environments, conduct continuous monitoring, and have staff trained in U.K. prudential rules.
The healthcare and Life Sciences Sectors are charting the fastest growth, with a 7.77% CAGR, driven by NHS electronic health record rollouts and pharmaceutical real-world evidence studies. Data-anonymization policies steer sensitive datasets toward secure domestic clusters, making localized artificial intelligence training a necessity rather than a choice. Manufacturing, automotive, and industrial clients are pushing predictive maintenance and digital twin models into regional labs located near supplier parks, thereby slashing prototype turnaround times. Telecom and technology companies emphasize edge-compute orchestration and 5G network analytics that require low-latency proximity to population hubs. Together, these cross-sector moves illustrate how the UK Global Capability Centers industry thrives when regulatory gravity, data intensity, and innovation urgency converge on the same geographic canvas.
Geography Analysis
London remains the strategic heart of the UK Global Capability Centers market, hosting senior executives, regulators, and capital markets. The city’s dense fintech corridor and legal ecosystem make it the default site for governance and client-facing teams, even as real estate inflation nudges bulk delivery outward.
Manchester, Birmingham, and Leeds build momentum by offering 35-40% cost savings, diverse graduate pipelines, and strong transportation links to the capital. These cities house cloud operations teams, cybersecurity analysts, and customer-experience pods that benefit from lower turnover and shorter commutes. The UK Global Capability Centers market size for the Northern Powerhouse corridor continues to expand as local councils add tax breaks and co-working grants, making provincial campuses viable for both blue-chip and mid-market entrants.
Scotland’s Edinburgh and Glasgow specialize in financial analytics, software engineering, and the development of health-tech clusters. Targeted incentives, a distinct legal system, and a high quality of life attract corporations seeking regulatory diversity without leaving the United Kingdom. Across these regions, distributed footprints balance talent access, risk management, and ESG goals, resulting in 13% of new GCC headcount in 2026 landing outside the South-East, a proportion expected to rise to 22% by 2031.
Competitive Landscape
Competition in the UK Global Capability Centers market is moderate, with the top five providers holding a significant collective share, leaving ample room for niche specialists to emerge. Global consultancies defend share through broad service portfolios and deep compliance credentials, yet regional players carve space by mastering local labor markets and sector-specific analytics. Continuous automation investment remains a key differentiator, as firms race to embed low-code orchestration, synthetic data generation, and self-healing cloud stacks.
Hybrid delivery models are gaining popularity, combining U.K. onshore governance with near-shore European or global hubs for overflow workloads, a pattern that balances cost, talent, and regulatory reach. Providers that supply clear lineage for code, data, and decision models gain an edge in competitive bids, especially with banks and pharmaceutical firms that face strict audit windows. The UK Global Capability Centers industry also sees selective mergers, typically larger firms acquiring boutique artificial intelligence or ESG analytics shops to accelerate capability build-out.
Cybersecurity credentials act as table stakes; ISO 27001, SOC 2, and Cyber Essentials Plus certifications now appear in 90% of RFP checklists. Vendors strengthen resilience by establishing dual-active data zones across London and regional centers, ensuring sub-five-minute failover for regulated workloads. This layered defense positions the UK Global Capability Centers market to meet rising board expectations around operational continuity and reputational risk.
United Kingdom Global Capability Centers Industry Leaders
Barclays Global Service Centre
Accenture PLC
Capgemini SE
Cognizant Technology Solutions Corporation
Tata Consultancy Services (TCS)
- *Disclaimer: Major Players sorted in no particular order

Recent Industry Developments
- October 2025: Tata Consultancy Services committed GBP 120 million (USD 152 million) for AI and cloud centers in Manchester and Edinburgh, adding 2,500 jobs over three years.
- September 2025: Accenture unveiled a GBP 85 million (USD 108 million) innovation hub in Birmingham focused on quantum computing and advanced analytics.
- August 2025: Cognizant invested USD 75 million in a Leeds compliance and risk center serving major banks and insurers.
- July 2025: Infosys partnered with the University of Edinburgh on a GBP 45 million (USD 57 million) AI research facility aimed at healthcare and fintech advances.


United Kingdom Global Capability Centers Market Report Scope
The scope of the global capability center study for the market segmentation by the Function/Capability for (i) Information Technology (IT) and Digital Services segment is limited to Software Development, Cloud and Infrastructure Management, Cybersecurity, Data Analytics and AI/ML; (ii) Engineering / ER&D segment is limited to Product Design and Testing, Embedded Systems, Digital Twin / Simulation; (iii) Business Process Management (BPM) segment is limited to Finance and Accounting, HR, Payroll and Talent Management, Procurement, Customer Service; and (iv)Knowledge Process Outsourcing (KPO) segment is limited to Market Research and Insights, Risk and Compliance, Legal and Regulatory Support, Strategy and Consulting Support. Similarly, for segmentation by the Engagement Model, scope for (i) Hybrid Build-Operate-Transfer (BOT) is limited to Joint Venture / Strategic Partnership and Virtual Captive Model. The rest of the segment scope is as specified for the listed segment.
| Information Technology (IT) and Digital Services |
| Engineering / ER&D |
| Business Process Management (BPM) |
| Knowledge Process Outsourcing (KPO) |
| Captive (Self-Build)/ In-house |
| Build-Operate-Transfer (BOT) |
| Hybrid Build-Operate-Transfer (BOT) (Joint Venture / Strategic Partnership and Virtual Captive Model) |
| Large Enterprises |
| Small and Medium Enterprises (SMEs) |
| Banking, Financial Services, and Insurance (BFSI) |
| Telecom and IT |
| Healthcare and Life Sciences |
| Manufacturing, Automotive and Industrial |
| Retail and Consumer Goods |
| Other Industry Verticals |
| By Function / Capability | Information Technology (IT) and Digital Services |
| Engineering / ER&D | |
| Business Process Management (BPM) | |
| Knowledge Process Outsourcing (KPO) | |
| By Engagement Model | Captive (Self-Build)/ In-house |
| Build-Operate-Transfer (BOT) | |
| Hybrid Build-Operate-Transfer (BOT) (Joint Venture / Strategic Partnership and Virtual Captive Model) | |
| By Organization Size | Large Enterprises |
| Small and Medium Enterprises (SMEs) | |
| By Industry Vertical | Banking, Financial Services, and Insurance (BFSI) |
| Telecom and IT | |
| Healthcare and Life Sciences | |
| Manufacturing, Automotive and Industrial | |
| Retail and Consumer Goods | |
| Other Industry Verticals |


Key Questions Answered in the Report
What growth rate is forecast for UK capability centers through 2031?
The compound annual growth rate (CAGR) stands at 6.97%, resulting in revenue growth from USD 18.19 billion in 2026 to USD 25.49 billion by 2031.
Which functional area contributes the most revenue today?
Information Technology and Digital Services leads, holding 54.23% share, thanks to ongoing cloud migration and cybersecurity mandates.
Why are hybrid Build-Operate-Transfer models gaining traction?
They provide firms with operational control after a short transition, while sharing start-up risk and real estate costs with experienced service partners.
How do rising London rents influence location decisions?
Grade-A rent inflation prompts companies to adopt hub-and-spoke footprints, maintaining governance in London while shifting high-volume work to lower-cost cities like Manchester and Leeds.
What is driving demand from healthcare organizations?
NHS digitization programs and pharmaceutical real-world evidence studies require secure, domestic data-science hubs, fueling a 7.77% CAGR in Healthcare and Life Sciences spending.
How concentrated is provider competition?
The top five vendors hold roughly a 35% share, leaving space for niche specialists and resulting in moderate concentration.
Page last updated on:


