Ultra-Low Latency Connectivity Market Size and Share
Market Overview
| Study Period | 2020 - 2031 |
|---|---|
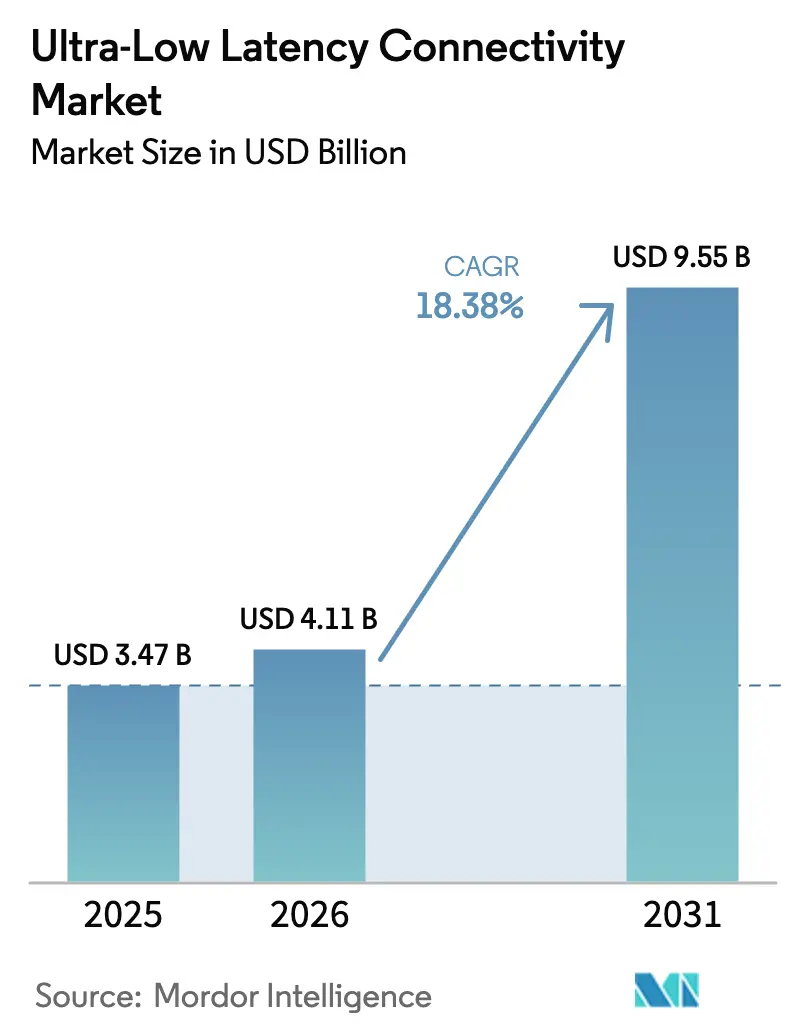
| Market Size (2026) | USD 4.11 Billion |
| Market Size (2031) | USD 9.55 Billion |
| Growth Rate (2026 - 2031) | 18.38% CAGR |
| Fastest Growing Market | Asia Pacific |
| Largest Market | North America |
| Market Concentration | Medium |
Major Players
*Disclaimer: Major Players sorted in no particular order Image © Mordor Intelligence. Reuse requires attribution under CC BY 4.0. |
|
Ultra-Low Latency Connectivity Market Analysis by Mordor Intelligence
The Ultra-Low Latency Connectivity Market size was valued at USD 3.47 billion in 2025 and is estimated to grow from USD 4.11 billion in 2026 to reach USD 9.55 billion by 2031, at a CAGR of 18.38% during the forecast period (2026-2031). Infrastructure upgrades for high-frequency trading, 5G standalone rollouts with multi-access edge computing, federated generative AI pipelines that synchronize GPU clusters within microseconds, and cloud gaming platforms that require sub-30-millisecond responsiveness are accelerating adoption. Exchanges in the United States and Europe moved to microwave and free-space optical links to shave microseconds from trade execution, while manufacturers implemented deterministic Ethernet under IEEE 802.1 Time-Sensitive Networking (TSN) to coordinate robots on assembly lines. Regulatory agencies advanced guidance for remote robotic surgery, and 3GPP finalized Release 18 in early 2025 to strengthen ultra-reliable low-latency communication for 5G.[1]IEEE, “802.1-2020 Time-Sensitive Networking Standards,” standards.ieee.org Source: 3GPP, “Release 18 Specifications,” 3gpp.org
Key Report Takeaways
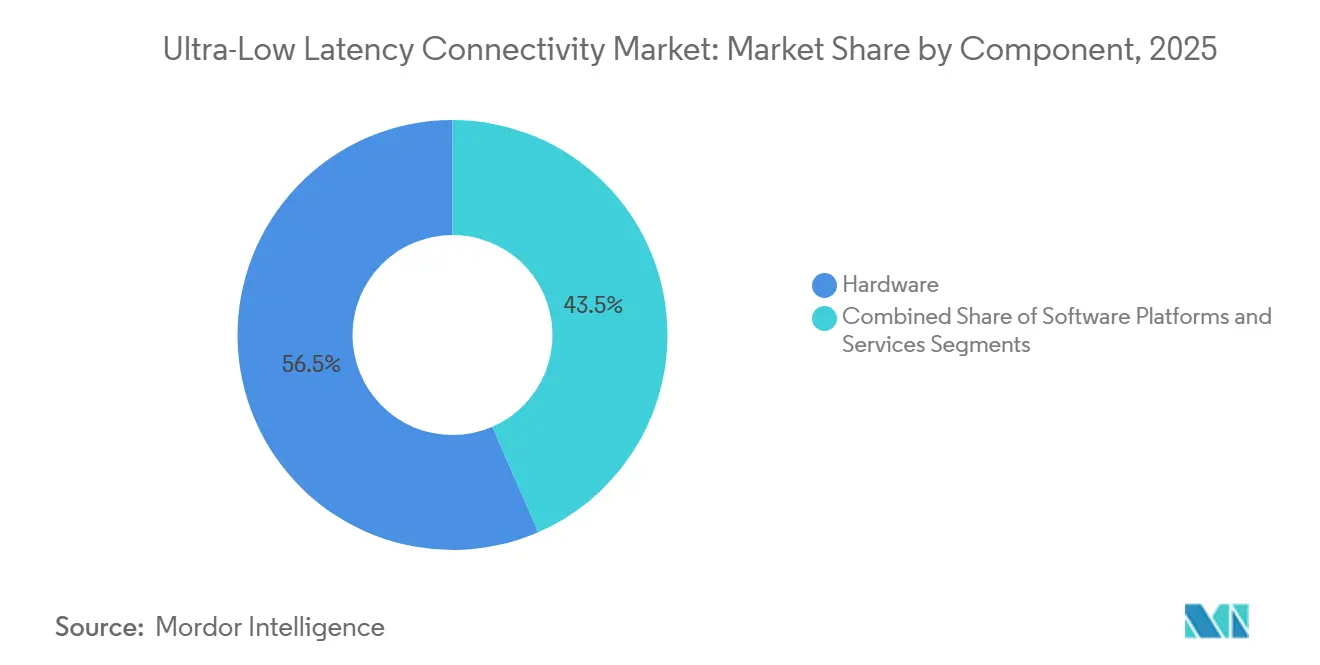
- By component, hardware led with 56.53% of Ultra-Low Latency Connectivity market share in 2025, while software is projected to grow at a 21.02% CAGR through 2031.
- By network technology, fiber-optic solutions accounted for 38.23% of the Ultra-Low Latency Connectivity market in 2025, and 5G/6G infrastructure is forecast to expand at a 22.32% CAGR through 2031.
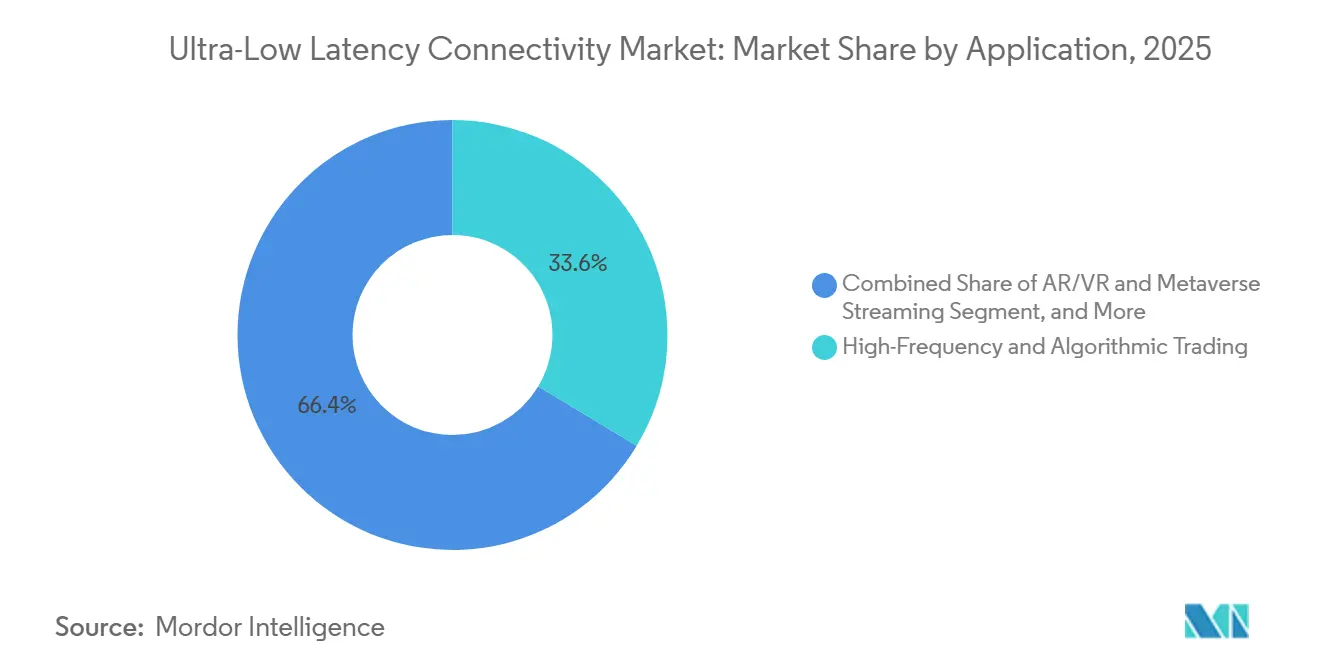
- By application, high-frequency and algorithmic trading commanded 33.62% of the Ultra-Low Latency Connectivity market's revenue share in 2025, whereas AR/VR and metaverse streaming are advancing at a 24.08% CAGR through 2031.
- By end user, BFSI accounted for 28.22% of spending in the Ultra-Low Latency Connectivity market in 2025; healthcare is projected to register the fastest CAGR of 24.32% through 2031.
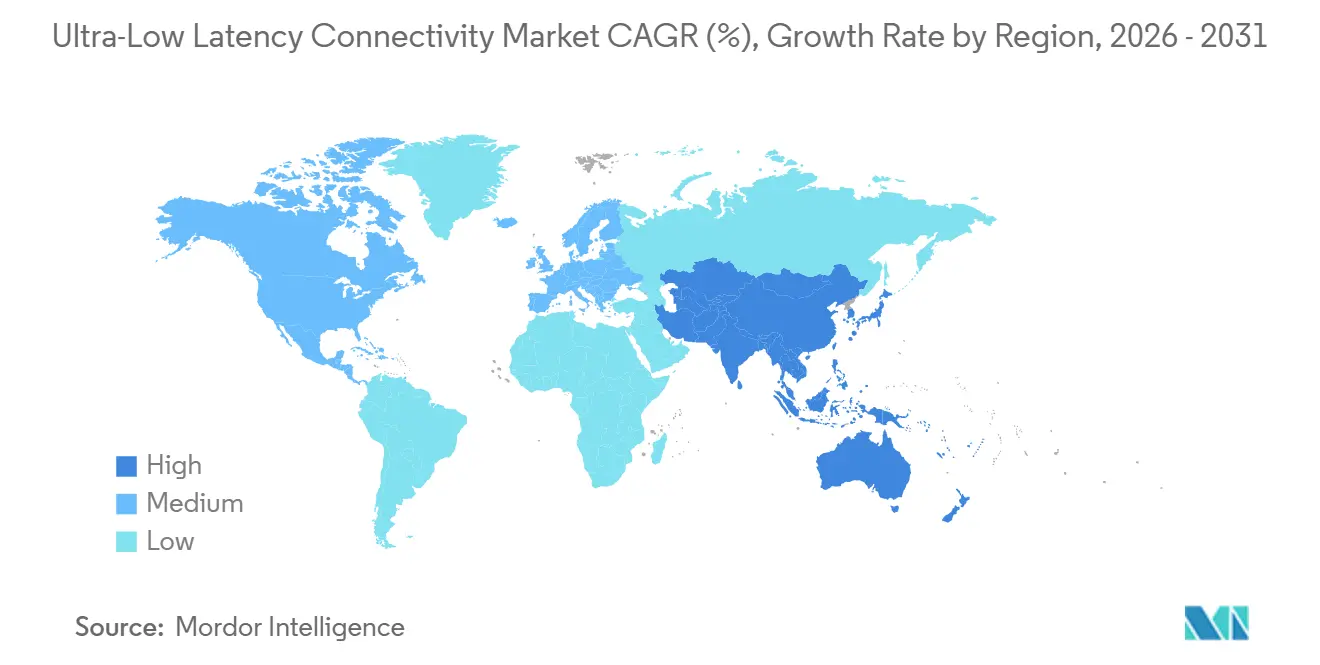
- By geography, North America accounted for 37.21% of the Ultra-Low Latency Connectivity market revenue in 2025, while Asia-Pacific is forecast to post the highest CAGR of 23.52% during 2026-2031.
Note: Market size and forecast figures in this report are generated using Mordor Intelligence’s proprietary estimation framework, updated with the latest available data and insights as of January 2026.
Global Ultra-Low Latency Connectivity Market Trends and Insights
Drivers Impact Analysis*
| Driver | ( ~ ) % Impact on CAGR Forecast | Geographic Relevance | Impact Timeline |
|---|---|---|---|
| Proliferation of high-frequency trading workloads | +3.2% | North America, Europe, Asia-Pacific (Singapore, Hong Kong, Tokyo) | Medium term (2-4 years) |
| Surge in cloud gaming and immersive media consumption | +2.8% | Global with focus in North America, Europe, South Korea, Japan | Medium term (2-4 years) |
| Roll-out of 5G standalone and edge computing infrastructure | +4.1% | Global led by Asia-Pacific, Middle East, North America | Short term (≤ 2 years) |
| Rise of deterministic Ethernet in smart manufacturing | +2.3% | Europe (Germany, Italy), Asia-Pacific (Japan, China, South Korea) | Long term (≥ 4 years) |
| Adoption of ultra-low latency links for GenAI federated learning | +3.5% | North America, Europe, China | Short term (≤ 2 years) |
| Regulatory push for sub-millisecond latency in remote surgery | +1.4% | North America, Europe, selected Asia-Pacific markets | Long term (≥ 4 years) |
| Source: Mordor Intelligence | |||
Proliferation Of High-Frequency Trading Workloads
Trading desks compressed execution windows to microseconds, making conventional fiber routes insufficient. Euronext activated the EWIN microwave corridor between London and Bergamo in July 2024, achieving sub-4-millisecond latency for equity and derivatives arbitrage.[2]Euronext, “EWIN Microwave Network,” euronext.com McKay Brothers and BSO expanded microwave networks across Chicago-New York and Asian hubs, while CME Group’s Aurora co-location allowed servers within meters of matching engines to interact in sub-10-microsecond cycles. Microwave propagation travels 30-40% faster than light in glass, so firms pay premiums for line-of-sight towers despite rising regulatory scrutiny from the U.S. Securities and Exchange Commission.
Roll-Out Of 5G Standalone And Edge Computing Infrastructure
Operators migrated from non-standalone 5G toward dedicated cores with network slicing. BT concluded a slicing trial in Belfast in December 2024, achieving guaranteed latency of <10 ms. The 5GMEC4EU program deployed multi-access edge computing at towers across the European Union in March 2025, reducing backhaul delays for autonomous vehicles and AR rendering. Verizon and AWS Wavelength delivered single-digit millisecond responses in U.S. metros. 3GPP Release 18 reinforces time-sensitive communication, aligning 5G with industrial Ethernet needs.
Adoption Of Ultra-Low Latency Links For GenAI Federated Learning Pipelines
Generative-AI training spans dispersed GPU clusters that must synchronize gradients instantly. Microsoft Azure deployed NVIDIA GB300 NVL72 pods using Quantum-X800 InfiniBand switches to sustain sub-microsecond intra-pod latency in October 2025. VMware showcased distributed large-language-model inference with GPUDirect RDMA, shaving 40% from end-to-end inference times. Sovereign-AI mandates boost demand for cross-border, low-latency interconnects that preserve data residency.
Surge In Cloud Gaming And Immersive Media Consumption
Cloud gaming offloads rendering to data centers, making latency a central factor in the user experience. Meta strengthened back-end infrastructure for metaverse platforms, and NVIDIA CloudXR enables VR streaming with motion-to-photon latency under 20 ms. Innoactive’s Omniverse streaming on AWS Wavelength reached collaborative design latency below 20 ms in August 2025. Edge nodes in ISP networks now host GPUs, enabling competitive esports to guarantee sub-30-ms response times.
Restraints Impact Analysis*
| Restraint | ( ~ ) % Impact on CAGR Forecast | Geographic Relevance | Impact Timeline |
|---|---|---|---|
| High capital expenditure for fiber and edge infrastructure | -2.1% | Global, more severe in emerging and rural areas | Medium term (2-4 years) |
| Interoperability challenges across multi-vendor TSN | -1.6% | Europe, Asia-Pacific industrial hubs | Long term (≥ 4 years) |
| Spectral congestion in unlicensed millimeter-wave bands | -1.2% | Urban centers worldwide | Short term (≤ 2 years) |
| Carbon-intensity penalties on hardware accelerators | -0.8% | Europe, selected North America states | Long term (≥ 4 years) |
| Source: Mordor Intelligence | |||
High Capital Expenditure For Fiber And Edge Infrastructure
Building fiber corridors costs USD 50,000-100,000 per route-mile, with intercity projects exceeding USD 50 million. Edge data centers require USD 10-20 million each for power, cooling, and connectivity. Lumen Technologies invested USD 1.2 billion in North American fiber from 2024-2025, but lower-density corridors stretch payback beyond five years.[3]Lumen Technologies, “Fiber Expansion,” lumen.com Coherent optics like Ciena WaveLogic 6 Extreme offer 1.6 Tbps per wavelength, yet price premiums limit uptake to hyperscalers. Free-space optics cuts deployment costs yet falters in adverse weather, leaving secondary markets underserved.
Interoperability Challenges Across Multi-Vendor TSN
Manufacturers integrate controllers from Siemens, Bosch Rexroth, and Rockwell Automation, each claiming TSN compliance. IEEE 802.1Qbv, Qbu, and AS specifications permit varied interpretations, so pilot projects often span 12-18 months. OPC UA over TSN initiatives introduce gateways that introduce additional latency, deterring smaller factories from upgrading legacy fieldbuses.
*Our forecasts treat driver/restraint impacts as directional, not additive. The impact forecasts reflect baseline growth, mix effects, and variable interactions.
Segment Analysis
By Component: Hardware Anchors Revenue, Software Accelerates
Hardware accounted for 56.53% of the Ultra-Low Latency Connectivity market share in 2025. FPGA-based SmartNICs such as Napatech NT200A02 provided sub-microsecond timestamping, while Broadcom Tomahawk 5 switches supplied 51.2 Tbps aggregate throughput. Capital intensity and three-to-five-year refresh cycles stabilize this portion of the Ultra-Low Latency Connectivity market size.
Software is projected to grow at a 21.02% CAGR to 2031 as intent-based networking and AI-driven traffic optimization reduce operating complexity. Platforms like Cisco CloudVision and Juniper Apstra automate multi-vendor fabrics, while Kaloom’s Kubernetes-native OS dynamically allocates edge resources. Subscription models let enterprises consume ultra-low latency “as a service,” aligning costs with actual usage.


By Network Technology: Fiber Dominates, 5G Surges
Fiber-optic Dense Wavelength Division Multiplexing and free-space optics generated 38.23% revenue in 2025. Ciena WaveLogic 6 Extreme delivered 1.6 Tbps per wavelength over 1,000 km, and Ekinops brought 600 Gbps coherent solutions to regional carriers. Fiber’s refractive-index delay keeps microwave attractive for nanosecond-critical trading corridors.
5G/6G infrastructure is forecast to grow at a 22.32% CAGR, driven by standalone cores and edge nodes that shorten backhaul paths to <10 ms. Release 18 introduces deterministic networking enhancements that align cellular with industrial Ethernet. Ethernet and InfiniBand dominate AI cluster interconnects, with NVIDIA Quantum-X800 switches giving 800 Gbps per port and sub-microsecond latency.
By Application: Trading Leads, AR/VR Accelerates
High-frequency and algorithmic trading accounted for 33.62% of application revenue in 2025, with firms spending >USD 10 million on proprietary microwave links between exchanges.
AR/VR and metaverse streaming will expand at a 24.08% CAGR as enterprises adopt immersive collaboration and consumers demand jitter <5 ms. Smart manufacturing depends on TSN to synchronize robots and autonomous guided vehicles. Remote healthcare moves from trials to early commercialization, following FDA guidance that sets latency budgets below 10 ms for haptic feedback.
By End User Industry: BFSI Dominates, Healthcare Surges
BFSI captured 28.22% of spending in 2025 through co-location, fraud analytics, and real-time payment authorization. Exchanges such as Nasdaq place servers within meters of their matching engines to achieve microsecond round-trip times.
Healthcare is forecast to record a 24.32% CAGR to 2031 as telesurgery platforms like Medtronic Hugo RAS integrate redundant networks and quality-of-service guarantees. Manufacturing, media, and transportation also leverage Ultra-Low Latency Connectivity market capabilities for digital twins, live production, and C-V2X vehicle coordination.
Geography Analysis
North America accounted for 37.21% of revenue in 2025. Microwave paths between Chicago and New York achieved sub-4-ms round-trip times, while Verizon and AT&T introduced 5G standalone with edge zones that deliver single-digit millisecond latency. The FCC allocated 5.9 GHz for C-V2X, accelerating connected-vehicle rollouts by General Motors and Ford. Canada’s smart-city pilots and Mexico’s nearshoring factories add incremental demand.
Asia-Pacific is projected to grow at a 23.52% CAGR over 2026-2031. Smart factories in Japan, South Korea, and China installed deterministic Ethernet to coordinate collaborative robots. NTT DoCoMo, SK Telecom, and China Mobile deployed private 5G networks for industrial zones. India invests in 5G for telemedicine, while Australia applies edge computing to remote mining and agriculture.
Europe balances manufacturing leadership with connected-car mandates. The European Commission requires roadside C-V2X infrastructure on major highways by 2027, stimulating adoption by Volkswagen and Stellantis. Germany’s Industrie 4.0 is driving TSN adoption, and the 5GME4EU project is extending edge computing across member states. London’s financial sector continues to purchase ultra-low latency links to continental exchanges despite post-Brexit rules.

Competitive Landscape
Competition is moderate. Arista launched 800 GbE 7700R4 switches, Juniper rolled out PTX10008 for carrier backbones, and Cisco unveiled Silicon One G200 at 51.2 Tbps throughput.[4]Arista Networks, “7700R4 800 GbE,” arista.com Broadcom’s Jericho3-AI and Tomahawk 6 target AI clusters with adaptive routing. Microwave specialists BSO, Avelacom, and McKay Brothers exploit physics advantages to trim fiber latency by 30-40% on key trading routes.
EdgeConneX and Zenlayer build data centers within 10 ms of end users, and Napatech, Exablaze, and Silicom provide FPGA SmartNICs for nanosecond-level packet processing. Hyperscale clouds increasingly design custom silicon, echoing AWS’s in-house switch chips, putting pressure on incumbent vendors. Patent portfolios cluster around coherent optics, TSN orchestration, and GPU fabrics.
White-space opportunities involve hybrid private-public 5G networks in factories and mines where enterprises demand dedicated spectrum. Multi-vendor TSN interoperability remains a sticking point, creating services revenue for integrators that certify deterministic performance across mixed equipment.
Ultra-Low Latency Connectivity Industry Leaders
-
Arista Networks, Inc.
-
Juniper Networks, Inc.
-
Cisco Systems, Inc.
-
Broadcom Inc.
-
Colt Technology Services Group Limited
- *Disclaimer: Major Players sorted in no particular order

Recent Industry Developments
- February 2026: Cisco allocated USD 150 million to expand Silicon One with G300 chips offering 76.8 Tbps and <500 ns latency.
- January 2026: Juniper partnered with Microsoft Azure to embed Apstra orchestration across edge zones, enabling sub-10-ms enterprise AI workloads.
- December 2025: Lumen completed a USD 200 million fiber path between Dallas and Atlanta using Ciena WaveLogic 6 Extreme optics, achieving sub-5-ms latency.
- November 2025: Arista secured a USD 80 million contract for 5G edge switches with a tier-1 U.S. carrier.
- October 2025: Microsoft Azure deployed NVIDIA GB300 NVL72 pods interconnected by Quantum-X800 InfiniBand for generative-AI training.


Global Ultra-Low Latency Connectivity Market Report Scope
Ultra-low-latency networks comprise specialized communication systems designed to minimize data transmission delay across digital infrastructure. These networks rely on advanced hardware, optimized software platforms, and managed services to support real‑time, mission‑critical applications such as algorithmic trading, remote surgery, autonomous vehicles, and immersive digital experiences. Ultra-low-latency networking solutions are designed to ensure near‑instantaneous data transfer, high reliability, and deterministic performance across both wired and wireless environments.
The global ultra‑low latency network market is segmented by component (hardware, software platforms, and services), network technology (5G and 6G, fiber‑optic including DWDM and FSO, Ethernet and InfiniBand, and microwave and millimeter‑wave wireless), application (high‑frequency and algorithmic trading, online gaming and esports, AR/VR and metaverse streaming, smart manufacturing and industrial IoT, remote healthcare and telesurgery, and autonomous vehicles and V2X), end‑user industry (BFSI, media and entertainment, manufacturing, healthcare, transportation and logistics, IT and telecom, and other industries), and geography (North America, South America, Europe, Asia Pacific, and Middle East and Africa, with detailed country‑level coverage). The market sizes and forecasts are provided in terms of value (USD) for all the above segments.
| Hardware |
| Software Platforms |
| Services |
| 5G and 6G |
| Fiber-Optic (DWDM, FSO) |
| Ethernet and InfiniBand |
| Microwave and Millimeter-Wave Wireless |
| High-Frequency and Algorithmic Trading |
| Online Gaming and Esports |
| AR/VR and Metaverse Streaming |
| Smart Manufacturing and Industrial IoT |
| Remote Healthcare and Telesurgery |
| Autonomous Vehicles and V2X |
| BFSI |
| Media and Entertainment |
| Manufacturing |
| Healthcare |
| Transportation and Logistics |
| IT and Telecom |
| Other End User Industries |
| North America | United States | |
| Canada | ||
| Mexico | ||
| South America | Brazil | |
| Argentina | ||
| Rest of South America | ||
| Europe | Germany | |
| United Kingdom | ||
| France | ||
| Italy | ||
| Spain | ||
| Russia | ||
| Rest of Europe | ||
| Asia Pacific | China | |
| Japan | ||
| India | ||
| South Korea | ||
| Australia | ||
| Rest of Asia Pacific | ||
| Middle East and Africa | Middle East | United Arab Emirates |
| Saudi Arabia | ||
| Turkey | ||
| Rest of Middle East | ||
| Africa | South Africa | |
| Egypt | ||
| Nigeria | ||
| Rest of Africa | ||
| By Component | Hardware | ||
| Software Platforms | |||
| Services | |||
| By Network Technology | 5G and 6G | ||
| Fiber-Optic (DWDM, FSO) | |||
| Ethernet and InfiniBand | |||
| Microwave and Millimeter-Wave Wireless | |||
| By Application | High-Frequency and Algorithmic Trading | ||
| Online Gaming and Esports | |||
| AR/VR and Metaverse Streaming | |||
| Smart Manufacturing and Industrial IoT | |||
| Remote Healthcare and Telesurgery | |||
| Autonomous Vehicles and V2X | |||
| By End User Industry | BFSI | ||
| Media and Entertainment | |||
| Manufacturing | |||
| Healthcare | |||
| Transportation and Logistics | |||
| IT and Telecom | |||
| Other End User Industries | |||
| By Geography | North America | United States | |
| Canada | |||
| Mexico | |||
| South America | Brazil | ||
| Argentina | |||
| Rest of South America | |||
| Europe | Germany | ||
| United Kingdom | |||
| France | |||
| Italy | |||
| Spain | |||
| Russia | |||
| Rest of Europe | |||
| Asia Pacific | China | ||
| Japan | |||
| India | |||
| South Korea | |||
| Australia | |||
| Rest of Asia Pacific | |||
| Middle East and Africa | Middle East | United Arab Emirates | |
| Saudi Arabia | |||
| Turkey | |||
| Rest of Middle East | |||
| Africa | South Africa | ||
| Egypt | |||
| Nigeria | |||
| Rest of Africa | |||


Key Questions Answered in the Report
What is the forecast value of the Ultra-Low Latency Connectivity market by 2031?
The Ultra-Low Latency Connectivity market size is projected to reach USD 9.55 billion by 2031.
Which segment currently leads spending on ultra-low latency connectivity?
Hardware holds the largest share at 56.53% of 2025 revenue, covering SmartNICs, 800 GbE switches, and coherent optics.
Which application area is growing fastest through 2031?
AR/VR and metaverse streaming is advancing at a 24.08% CAGR as edge rendering lowers motion-to-photon delay.
How quickly will 5G and 6G infrastructure expand in this space?
5G/6G network technology revenue is expected to grow at a 22.32% CAGR during 2026-2031, driven by standalone cores and edge computing.
Which region is forecast to record the highest growth rate?
Asia-Pacific is projected to achieve a 23.52% CAGR due to smart factory rollouts and private 5G networks.
What is the main restraint limiting wider adoption?
High capital expenditure for new fiber routes and edge facilities reduces deployment, especially in underserved markets.
Page last updated on:


