
Transactional Video-on-Demand (TVOD) Market Size and Share
Market Overview
| Study Period | 2020 - 2031 |
|---|---|
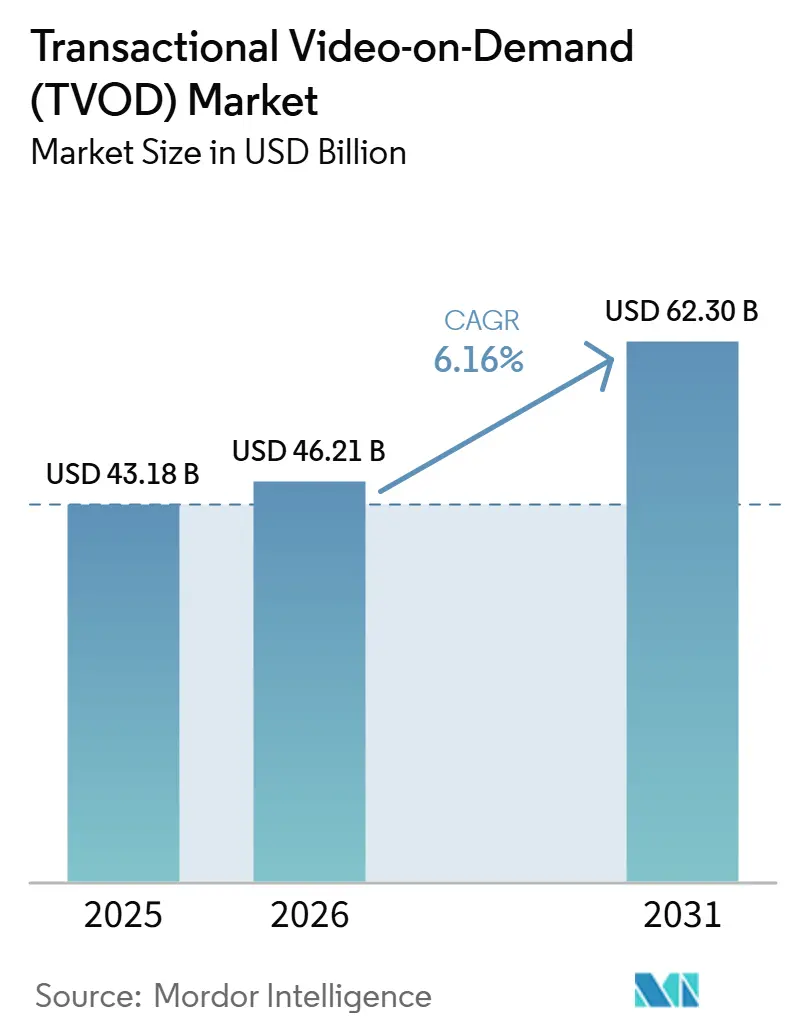
| Market Size (2026) | USD 46.21 Billion |
| Market Size (2031) | USD 62.30 Billion |
| Growth Rate (2026 - 2031) | 6.16 % |
| Fastest Growing Market | Asia-Pacific |
| Largest Market | North America |
| Market Concentration | Medium |
Major Players *Disclaimer: Major Players sorted in no particular order Image © Mordor Intelligence. Reuse requires attribution under CC BY 4.0. | |
Transactional Video-on-Demand (TVOD) Market Analysis by Mordor Intelligence
The transactional video-on-demand market size was valued at USD 43.18 billion in 2025 and is estimated to grow from USD 46.21 billion in 2026 to reach USD 62.30 billion by 2031, at a CAGR of 6.16% during the forecast period (2026-2031). The market continues to benefit from studios' use of premium access windows to monetize high-demand titles before moving them into subscription libraries. Hybrid streaming platforms are also making rentals and purchases easier to find within broader viewing ecosystems, which supports repeat transactions across major storefronts. Connected television viewing remains an important support factor because premium releases and live events tend to perform better on large screens than on smaller mobile displays. Subscription fatigue and the wider reach of ad-supported streaming continue to pressure library transactions, but early-release films and live pay-per-view still give the transactional video-on-demand market a distinct role that flat-fee models do not fully replace. Competition centers on platform control, billing convenience, operator partnerships, and the ability to place premium content in front of consumers when interest is highest.
Key Report Takeaways
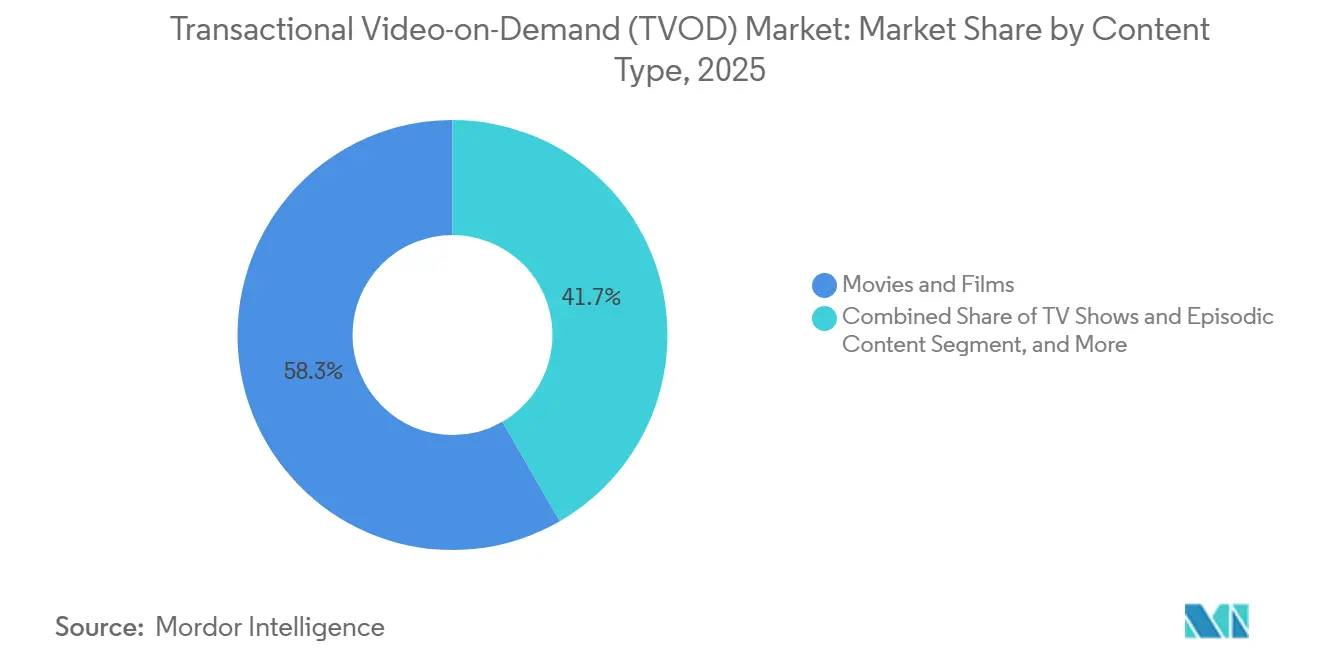
- By content type, movies and films led the transactional video-on-demand market with 58.32% of the market share in 2025, while TV shows and episodic content are projected to expand at a 6.72% CAGR through 2031.
- By revenue model, rental held 55.21% share in 2025, while pay-per-view is projected to grow at 7.48% CAGR through 2031.
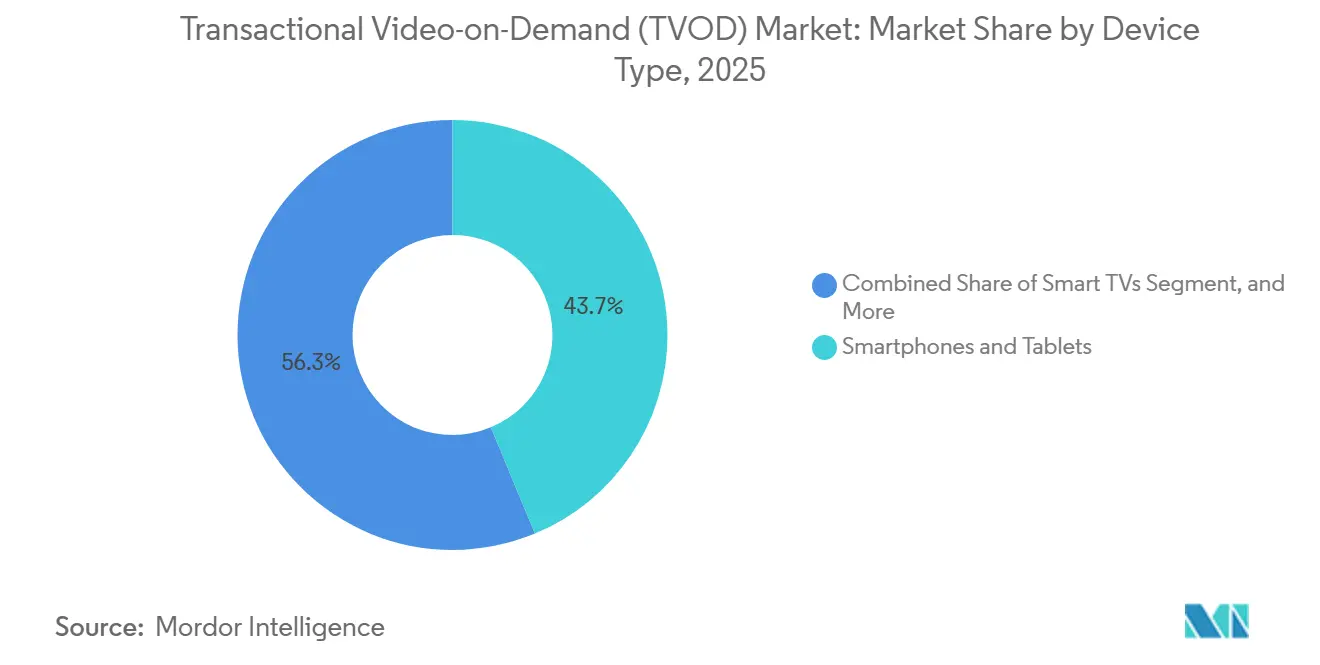
- By device type, smartphones and tablets held 43.74% share in 2025, while smart TVs are projected to expand at an 8.31% CAGR through 2031.
- By geography, North America held 41.87% of the TVOD market share in 2025, while Asia-Pacific is projected to grow at a 7.67% CAGR through 2031.
Note: Market size and forecast figures in this report are generated using Mordor Intelligence’s proprietary estimation framework, updated with the latest available data and insights as of January 2026.
Global Transactional Video-on-Demand (TVOD) Market Trends and Insights
Drivers Impact Analysis*
| Driver | (~) % Impact on CAGR Forecast | Geographic Relevance | Impact Timeline |
|---|---|---|---|
| Rising Consumer Willingness to Pay for New-Release Access | +1.5% | Global, strongest in North America and Western Europe | Short term (≤ 2 years) |
| Expansion of Premium Windowing Across Studios and Territories | +1.3% | North America and Europe, spill-over to Asia-Pacific | Medium term (2-4 years) |
| Growth of Hybrid OTT Ecosystems Bundling Rental and Purchase Flows | +1.1% | Global, led by North America and Asia-Pacific | Medium term (2-4 years) |
| Smart TV and Connected Device Penetration | +0.9% | Global, led by Asia-Pacific and North America | Medium term (2-4 years) |
| Mobile Wallet and One-Click Checkout Adoption in Emerging Markets | +0.6% | Asia-Pacific, South America, Middle East and Africa | Long term (≥ 4 years) |
| CDN and Codec Optimization Lowering Delivery Friction | +0.4% | Global | Long term (≥ 4 years) |
| Source: Mordor Intelligence | |||
Rising Consumer Willingness to Pay for New-Release Access
Consumer willingness to pay is strongest when a title still carries theatrical buzz, and the release feels current rather than archival. Premium rentals work because viewers often treat a major film launch as a one-off rather than a routine catalog choice. That supports a pricing lane in the transactional video-on-demand market that sits well above standard library rentals during periods of concentrated demand around the first digital window. The model is especially effective for households that want immediate access but do not want to wait for a later subscription release. It also favors platforms that make checkout fast and reduce the number of steps between discovery and payment. As a result, the transactional video-on-demand market continues to hold a monetization position that subscription bundles do not fully absorb.
Expansion of Premium Windowing Across Studios and Territories
Premium windowing moved from a temporary release response into a more deliberate studio strategy during 2025 and 2026. Several major studios maintained meaningful gaps between theatrical release and TVOD availability, and many top films remained unavailable on home transaction channels for at least 45 days. Disney also maintained longer theatrical-to-digital release windows for major releases, with some titles extending well beyond 2 months and one reaching 102 days before TVOD availability. Paramount publicly committed to a minimum 45-day theatrical window, which signaled that longer premium timing had support beyond a single studio. This helps the transactional video-on-demand market because the delayed home debut often concentrates demand into a more intense opening digital period. Instead of diluting interest, a longer wait can raise the value of the first paid access moment.
Growth of Hybrid OTT Ecosystems That Bundle Rental and Purchase Flows
Hybrid OTT ecosystems are changing TVOD from a standalone storefront into a built-in function within a broader streaming journey. In April 2026, Apple TV became available as a direct add-on within Prime Video in the United States, creating a unified discovery surface that brings rentals, purchases, and subscription options into a single interface.[1]Apple Inc., “Apple TV Now Available on Prime Video in the US,” Apple TV Press, apple.com In May 2026, Amazon merged Prime Video and Amazon MX Player in India, creating a single platform that combines SVOD, AVOD, TVOD, and add-on subscriptions. This matters because subscription growth does not always crowd out transactions when premium inventory is surfaced at the right time inside the same app. The transactional video-on-demand market benefits when platforms use their subscription base as a funnel for event releases, early access films, and paid live programming. That structure also gives operators more ways to monetize the same viewer without forcing a full platform switch.
Smart TV and Connected Device Penetration
The living room remains one of the strongest settings for premium transactional viewing because the content is often watched as a planned event rather than casual background viewing. Larger screens foster a higher willingness to pay because they create a stronger home-cinema substitute for new-release films and live events. Connected device ownership also reduces friction by enabling discovery, payment, and playback within the same environment. Codec progress adds another advantage, because AV1 hardware-decoding support in connected TV devices improves the efficiency of 4K HDR delivery at lower bitrates than older standards. Lower delivery requirements improve the economics of serving premium quality video at scale across the TVOD market. Fox’s June 2026 agreement to acquire Roku also showed how valuable control over connected devices has become for content monetization and storefront visibility.
Restraints Impact Analysis*
| Restraint | (~) % Impact on CAGR Forecast | Geographic Relevance | Impact Timeline |
|---|---|---|---|
| Subscription Bundling and Ad-Supported Alternatives Eroding Transactional Demand | -0.8% | Global, strongest in North America and Western Europe | Short term (≤ 2 years) |
| Price Sensitivity for Repeat Viewers Limiting Purchase Frequency | -0.5% | Global, most acute in South America and Asia-Pacific | Medium term (2-4 years) |
| Content Overlap Across Major Platforms Compressing Differentiation | -0.3% | North America and Western Europe | Medium term (2-4 years) |
| Rights Fragmentation and Windowing Complexity Raising Operating Costs | -0.2% | Global | Long term (≥ 4 years) |
| Source: Mordor Intelligence | |||
Subscription Bundling and Ad-Supported Alternatives Eroding Transactional Demand
Subscription bundles and ad-supported services continue to pressure catalog-based transactions by reducing the need for one-off purchases of older titles. Ad-supported tiers accounted for the majority of gross subscriber additions across premium SVOD platforms in early 2025, indicating that low-cost entry points were attracting a large share of new users.[2]Video Advertising Bureau, “2026 Streaming Report,” Video Advertising Bureau, thevab.com Free and low-cost streaming choices are especially disruptive when the title is widely available and no longer tied to a premium release window. This weakens repeat rental behavior for library films and series, particularly in mature markets where households already carry multiple streaming services. The transactional video-on-demand market is most exposed when it tries to compete on broad catalog access rather than on urgency, exclusivity, or live viewing. That is why platforms are leaning more heavily into new-release movies and event pay-per-view, where ad-supported substitutes are less direct.
Price Sensitivity for Repeat Viewers Limiting Purchase Frequency
Price sensitivity remains a significant constraint on electronic sell-through, as many viewers expect a title to appear later in a subscription library. A digital purchase priced at USD 15-20 feels less compelling when the consumer believes the same content may become available with no extra charge after a waiting period. That concern became more visible after Sony notified UK and European PlayStation Store users that 551 purchased StudioCanal titles would be removed from their libraries on September 1, 2026, without refunds. The episode weakened trust in the idea of digital ownership and made the distinction between purchase and licensed access feel less meaningful. In the transactional video-on-demand market, that trust issue matters because purchase decisions depend on both title desirability and confidence that the asset will remain available. As long as those concerns remain unresolved, rental will keep a structural advantage over ownership-based models for many repeat viewers.
*Our forecasts treat driver/restraint impacts as directional, not additive. The impact forecasts reflect baseline growth, mix effects, and variable interactions.
Segment Analysis
By Content Type: Films Anchor TVOD Revenue, Episodic Content Accelerates
Movies and Films accounted for 58.32% share of the transactional video-on-demand market size in 2025. This lead stems from the theatrical-to-transactional release pattern, which still makes new-release films the main driver of paid digital demand. Franchise blockbusters, awards-season titles, and family releases create scarcity that supports per-transaction pricing before subscription availability begins. Documentaries remained a smaller but distinct category, with viewers willing to pay for premium investigative and nature titles ahead of broader streaming access. The Other content types segment included sports events, music performances, and early interactive formats, giving the transactional video-on-demand industry a path beyond a film-only catalog mix.
TV Shows and Episodic Content are projected to expand at a 6.72% CAGR through 2031, making it the fastest-growing content segment. Growth is being supported by premium access to high-demand season launches, K-drama titles, and anime series, where rights are often fragmented by region. Zee Entertainment’s Z5 platform doubled its weekly active users to 27 million within 2 weeks of the FIFA World Cup 2026, with transactional packages starting at INR 799 (USD 9.56) for 3 months. Amazon’s combined Prime Video and MX Player platform in India also uses TVOD as the early-access layer for high-demand titles before they move into subscription circulation. This keeps the transactional video-on-demand market relevant even as episodic viewing becomes more tied to hybrid platform design.



By Revenue Model: Rental Dominates, Pay-Per-View Emerges As Growth Engine
Rental accounted for 55.21% share of the transactional video-on-demand market size in 2025. The segment stayed ahead because it offers a simple proposition that is limited-time access at a lower price with no long-term commitment. Rental demand also closely tracks the strength of the theatrical release slate, because big film exits tend to trigger a short burst of home transaction activity. Purchase and EST generated higher revenue per transaction, but they faced pressure from digital ownership uncertainty and the expectation that many titles will later appear on subscription platforms. That pressure became more visible after Sony’s notice that purchased StudioCanal titles would be removed from PlayStation Store libraries in the future.
Pay-Per-View is projected to advance at a 7.48% CAGR through 2031, making it the fastest-growing revenue model in the transactional video-on-demand market. Live sports rights are a major reason, because more events are moving away from cable and satellite bundles into digital per-event delivery. Fandango Media’s August 2025 acquisition of the PPV.com brand, along with the expansion of Fandango at Home into live PPV and cable TVOD, showed that platforms see a clear opening in event-based transactions. That strategy fits the transactional video-on-demand industry because event programming can command urgency and price discipline in ways that ordinary catalog titles cannot. The other revenue models segment, including micro-transaction and token-based models, remained small but continued to draw experimentation around pricing and preview access.
By Device Type: Mobile Base Matures, Smart TVs Drive Premium Transaction Value
Smartphones and tablets accounted for 43.74% of global TVOD market revenue in 2025. Their lead reflected the scale of mobile-first streaming behavior across Asia-Pacific and South America, where handheld devices remain the first screen for many digital consumers. India’s Unified Payments Interface processed 228.3 billion transactions valued at USD 3.4 trillion in 2025, demonstrating that payment rails had reached the scale needed to support low-friction digital purchasing. OTT services accounted for 17% of India’s USD 32 billion in digital goods gross merchandise value in FY2025-26, while low-friction payment acceptance continued to reduce barriers to mobile entertainment spending. Similar wallet-led payment habits in Southeast Asia also support mobile transactions by reducing dependence on traditional card-based checkout.
Smart TVs are projected to grow at an 8.31% CAGR through 2031 and remain the highest-value device segment per viewing session. Large-screen viewing fosters a stronger willingness to pay because premium films and live events feel closer to a cinema or venue experience at home. Connected TV operating systems are also capturing more of the premium viewing occasions that once sat on laptops and desktops. AV1 hardware support across connected devices improved the economics of 4K HDR delivery for premium streams, which helps platforms manage quality and cost together. That combination gives the transactional video-on-demand market a durable premium device base, even as mobile remains the larger-volume channel.
Geography Analysis
North America held 41.87% of the transactional video-on-demand market share in 2025. The United States remained the main pricing and volume benchmark, with Amazon Prime Video, Apple TV, and Google TV shaping common rental and purchase behavior across the category. Canada followed a similar pattern because release timing, storefront access, and consumer habits closely align with those of the US market. Mexico continued to expand its paid audience as hybrid payment models, such as OXXO cash vouchers and SPEI transfers, helped support transactions beyond the traditional credit card base. In South America, Brazil’s VOD platform count rose from 60 in 2024 to 106 in 2025, with more than 138,000 titles available across the ecosystem, indicating that platform infrastructure continued to deepen even as pricing sensitivity remained an issue.[3]ANCINE, “ANCINE Divulga Panorama do Mercado de Vídeo por Demanda no Brasil 2025,” Government of Brazil, gov.br
Europe remained a split transactional landscape, with Germany and the UK standing out among the larger Western European storefronts. Germany has historically shown a stronger shift from physical ownership to digital purchase than many other European markets. France faced greater pressure from ad-supported and free streaming services, reducing the room for repeat catalog transactions. Rakuten TV responded by widening operator-led distribution, including a March 2026 partnership with Vodafone TV Spain that added around 6,000 rental titles to the operator environment. Italy’s CHILI moved ahead with a relaunch built around TVOD, AVOD, and business-to-business services, while Saudi Arabia and the United Arab Emirates remained the most commercially advanced markets across the broader Middle East and Africa region.
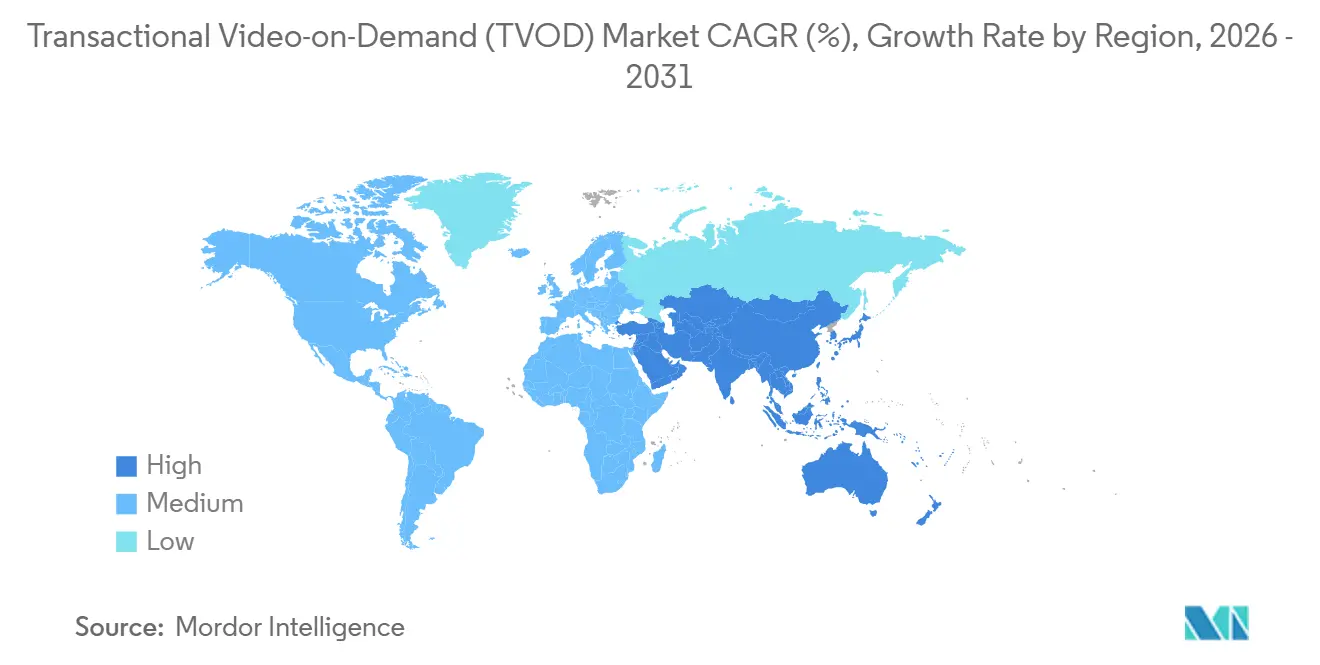
Asia-Pacific is projected to expand at a 7.67% CAGR through 2031, making it the fastest-growing region in the transactional video-on-demand market. Japan, India, and South Korea support this expansion through premium local content, telecom bundle relationships, and strong demand for early access viewing around popular franchises and cultural exports. India’s payment infrastructure is especially important because UPI made one-click transactions routine for a very large digital audience in 2025.[4]National Payments Corporation of India, “UPI Annual Transaction Data 2025,” NPCI Official Reports, npci.org.in Amazon’s integration of MX Player into Prime Video in India also turned the country into a multi-model test bed for SVOD, AVOD, TVOD, and add-on subscriptions within a single service.

Competitive Landscape
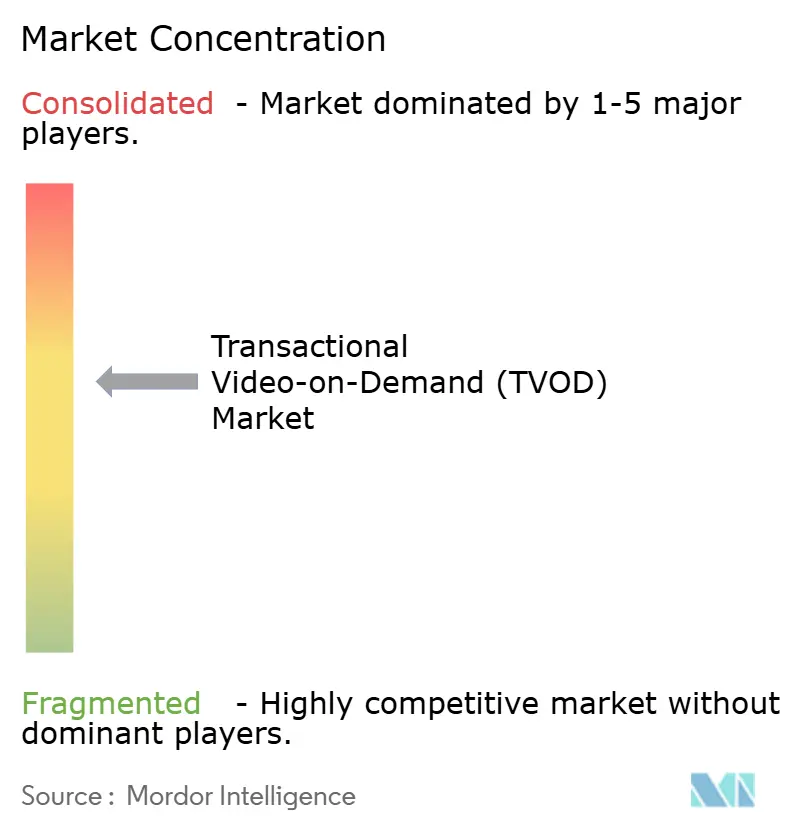
The upper tier of the transactional video-on-demand market is moderately concentrated because a few ecosystem-backed platforms control discovery, billing, and device access. Amazon held around 46% of the US TVOD business in Q1 2025, while Apple TV ranked second at 15%. Alphabet also benefits from its storefront and operating system positions, which help it retain repeat transaction traffic without relying solely on exclusive content. This structure rewards platforms that can insert rental and purchase options into devices and subscription interfaces that consumers already use every day. Smaller operators, therefore, compete less on an absolute scale and more on territorial licensing, operator relationships, and white-label support.
Rakuten responded to that challenge by pushing enterprise infrastructure and operator distribution instead of trying to outscale the largest technology players on content breadth alone. Its March 2026 agreement with Vodafone TV Spain extended that model by embedding Rakuten’s rental catalog directly into the operator environment. Fandango Media pursued a different path when it acquired the PPV.com brand in August 2025 and expanded Fandango at Home into live PPV and cable TVOD. That move gave Fandango a clearer role in live-event transactions, where catalog scale matters less than event access and aggregation capabilities. In the transactional video-on-demand market, this type of specialization remains one of the few practical ways to defend margins against the integrated reach of larger platforms.
Control of the distribution layer is becoming more important than simple catalog breadth. Fox’s June 2026 agreement to acquire Roku for USD 22 billion showed the value of owning the operating system and home screen that influence viewing choices across more than 100 million connected households. Patent activity from Comcast around recommendation engines tied to TVOD checkout flows also points to a competitive model where merchandising and conversion logic matter as much as content access. Rights management remains a continuing challenge because any gap between consumer expectations and the legal limits of digital ownership can reduce trust across the TVOD market.
Transactional Video-on-Demand (TVOD) Industry Leaders
Amazon.com, Inc.
Apple Inc.
Google LLC
Fandango Media, LLC
Comcast Corporation
- *Disclaimer: Major Players sorted in no particular order

Recent Industry Developments
- June 2026: Zee Entertainment's Z5 platform saw weekly active users double to 27 million in 2 weeks of FIFA World Cup 2026, with transactional pay-per-view packages starting at INR 799 (USD 9.56) for 3 months. The development substantiated TVOD's scalability for premium live sports events in price-sensitive emerging markets, where per-event pricing outperformed flat subscription models for content with concentrated viewing windows.
- June 2026: Fox Corporation announced an agreement to acquire Roku, Inc. for USD 22 billion (USD 160 per share in a combination of cash and Fox Class A common stock), providing Fox direct access to Roku's over 100 million connected households and Roku's smart TV operating system footprint across global device markets. The deal, pending regulatory review and expected to close in H1 2027, positioned Fox to monetize TVOD and advertising at the connected-device distribution layer alongside its Tubi FAST service.
- June 2026: Sony Group Corporation notified UK and European PlayStation Store users that 551 purchased StudioCanal titles will be removed from their video libraries on September 1, 2026, with no financial compensation or refunds. The episode crystallized the fragility of digital EST ownership conventions and is expected to suppress purchase frequency among informed consumers across the platform's European user base.
- May 2026: Amazon merged Amazon MX Player into Prime Video in India, creating what Amazon described as the country's largest streaming service integrating SVOD, AVOD, TVOD, and add-on subscriptions under a single application. The unified platform positioned India as Amazon's most complex multi-model streaming market and used TVOD as the monetization bridge for Bollywood theatrical releases ahead of subscription availability.


Global Transactional Video-on-Demand (TVOD) Market Report Scope
The Transactional Video-on-Demand (TVOD) market comprises digital platforms and services that enable consumers to access premium video content by paying for individual titles or events on a per-transaction basis, rather than through recurring subscriptions. TVOD services typically offer content for temporary rental, permanent digital purchase, or pay-per-view access, allowing users to watch movies, television shows, documentaries, live events, and other video content across a variety of internet-connected devices. Market revenues are generated from one-time consumer payments for content access and ownership, with services delivered through streaming or digital download technologies.
The Transactional Video-on-Demand (TVOD) Market Report is Segmented by Content Type (Movies and Films, TV Shows, Documentaries, and Other Content Types), Revenue Model (Rental/DTR, Purchase/EST, Pay-Per-View, and Other Revenue Models), Device Type (Smartphones and Tablets, Smart TVs, Laptops and Desktops, and Other Devices), and Geography (North America, South America, Europe, Asia-Pacific, Middle East, and Africa). The Market Forecasts are Provided in Terms of Value (USD).
| Movies and Films |
| TV Shows and Episodic Content |
| Documentaries |
| Other Content Types |
| Rental / DTR (Download to Rent) |
| Purchase / EST (Electronic Sell-Through) |
| Pay-Per-View |
| Other Revenue Models |
| Smartphones and Tablets |
| Smart TVs |
| Laptops and Desktops |
| Other Devices |
| North America | United States |
| Canada | |
| Mexico | |
| South America | Brazil |
| Argentina | |
| Chile | |
| Rest of South America | |
| Europe | Germany |
| United Kingdom | |
| France | |
| Italy | |
| Spain | |
| Rest of Europe | |
| Asia-Pacific | China |
| Japan | |
| India | |
| South Korea | |
| Australia | |
| Rest of Asia-Pacific | |
| Middle East | Saudi Arabia |
| United Arab Emirates | |
| Qatar | |
| Rest of Middle East | |
| Africa | South Africa |
| Egypt | |
| Nigeria | |
| Rest of Africa |
| By Content Type | Movies and Films | |
| TV Shows and Episodic Content | ||
| Documentaries | ||
| Other Content Types | ||
| By Revenue Model | Rental / DTR (Download to Rent) | |
| Purchase / EST (Electronic Sell-Through) | ||
| Pay-Per-View | ||
| Other Revenue Models | ||
| By Device Type | Smartphones and Tablets | |
| Smart TVs | ||
| Laptops and Desktops | ||
| Other Devices | ||
| By Geography | North America | United States |
| Canada | ||
| Mexico | ||
| South America | Brazil | |
| Argentina | ||
| Chile | ||
| Rest of South America | ||
| Europe | Germany | |
| United Kingdom | ||
| France | ||
| Italy | ||
| Spain | ||
| Rest of Europe | ||
| Asia-Pacific | China | |
| Japan | ||
| India | ||
| South Korea | ||
| Australia | ||
| Rest of Asia-Pacific | ||
| Middle East | Saudi Arabia | |
| United Arab Emirates | ||
| Qatar | ||
| Rest of Middle East | ||
| Africa | South Africa | |
| Egypt | ||
| Nigeria | ||
| Rest of Africa | ||


Key Questions Answered in the Report
What is the current size and forecast for the transactional video-on-demand market?
The transactional video-on-demand market was valued at USD 43.18 billion in 2025, stands at USD 46.21 billion in 2026, and is projected to reach USD 62.30 billion by 2031 at a 6.16% CAGR.
Which content type generates the most revenue in transactional video-on-demand?
Movies and Films led revenue generation with a 58.32% share in 2025, supported by theatrical-origin releases and premium access windows.
What is driving growth in pay-per-view on digital video platforms?
Pay-Per-View is projected to grow at 7.48% CAGR through 2031 as live sports and event rights continue shifting from cable bundles to digital per-event distribution.
Why are smart TVs becoming more important for premium digital rentals and purchases?
Smart TVs are projected to grow at 8.31% CAGR through 2031 and support higher transaction value because large-screen viewing better fits premium films and live events.
Which region is expanding the fastest for transactional video-on-demand?
Asia-Pacific is the fastest-growing region, with a projected 7.67% CAGR through 2031, supported by premium local content, telecom partnerships, and strong digital payment adoption.
What is the main challenge for digital title purchases compared with rentals?
Purchase frequency is limited by price sensitivity and trust concerns around digital ownership, especially after the 2026 Sony notice on the future removal of purchased titles from user libraries.
Page last updated on:





