Trade Promotion Optimization AI Market Size and Share
Market Overview
| Study Period | 2020 - 2031 |
|---|---|
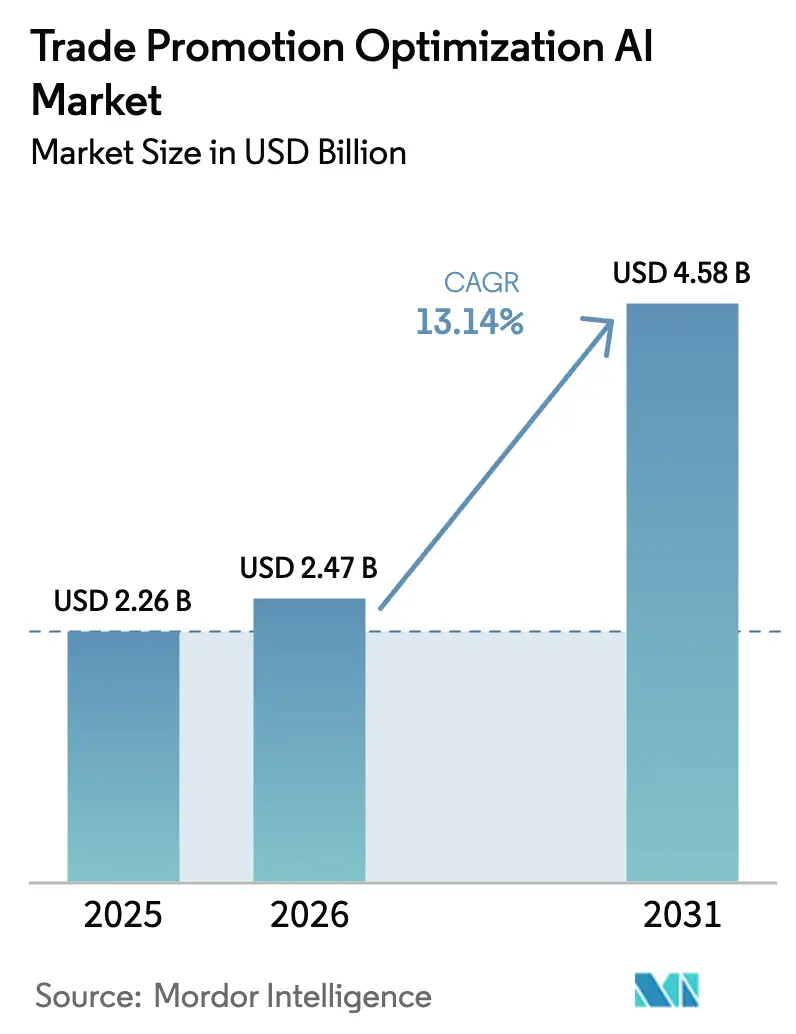
| Market Size (2026) | USD 2.47 Billion |
| Market Size (2031) | USD 4.58 Billion |
| Growth Rate (2026 - 2031) | 13.14% CAGR |
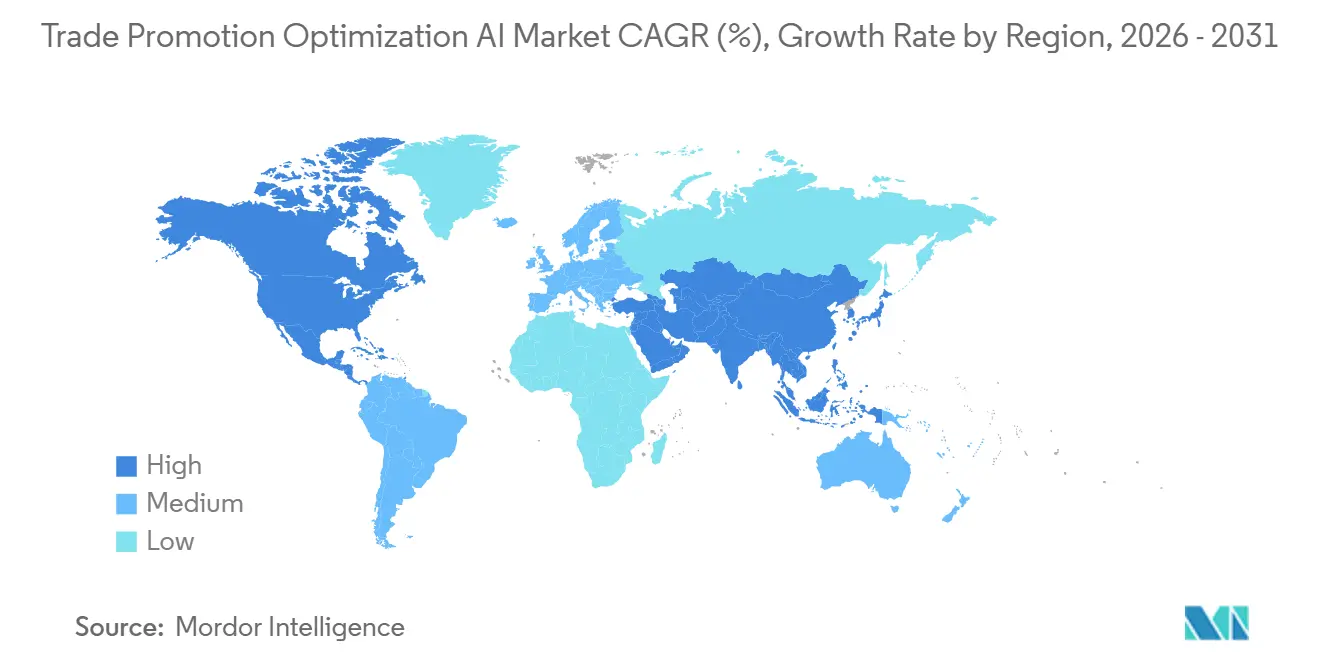
| Fastest Growing Market | Asia Pacific |
| Largest Market | North America |
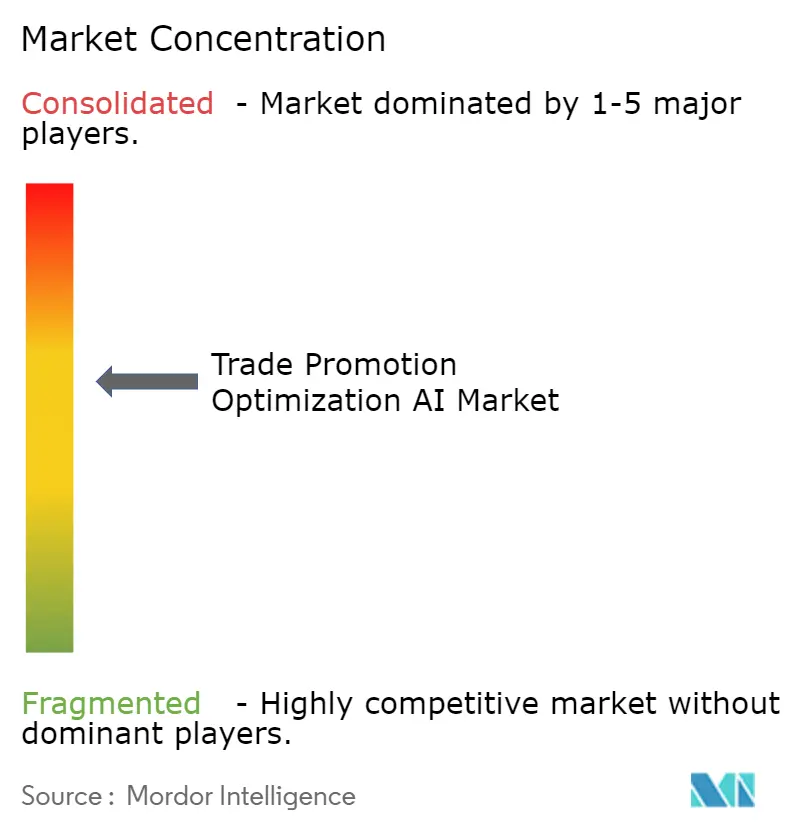
| Market Concentration | Medium |
Major Players *Disclaimer: Major Players sorted in no particular order Image © Mordor Intelligence. Reuse requires attribution under CC BY 4.0. | |
Trade Promotion Optimization AI Market Analysis by Mordor Intelligence
The trade promotion optimization AI market size was valued at USD 2.26 billion in 2025 and estimated to grow from USD 2.47 billion in 2026 to reach USD 4.58 billion by 2031, at a CAGR of 13.14% during the forecast period (2026-2031). Brands are shifting budgets from intuition-based planning to algorithmic decisioning that quantifies every promotional dollar, a pivot reinforced by agentic platforms that unify pricing, inventory, and assortment decisions. Declining cloud infrastructure costs let even small consumer-packaged goods labels run advanced simulations once reserved for Tier-1 enterprises, while retailers monetize first-party data by demanding real-time elasticity models. Generative AI is shortening scenario-planning cycles from weeks to minutes, enabling thousands of offers to be tested virtually before a single shelf tag changes. Privacy-preserving techniques such as federated learning are gaining traction in Europe and North America, helping vendors comply with tightening data-regulation regimes without sacrificing model performance.
Key Report Takeaways
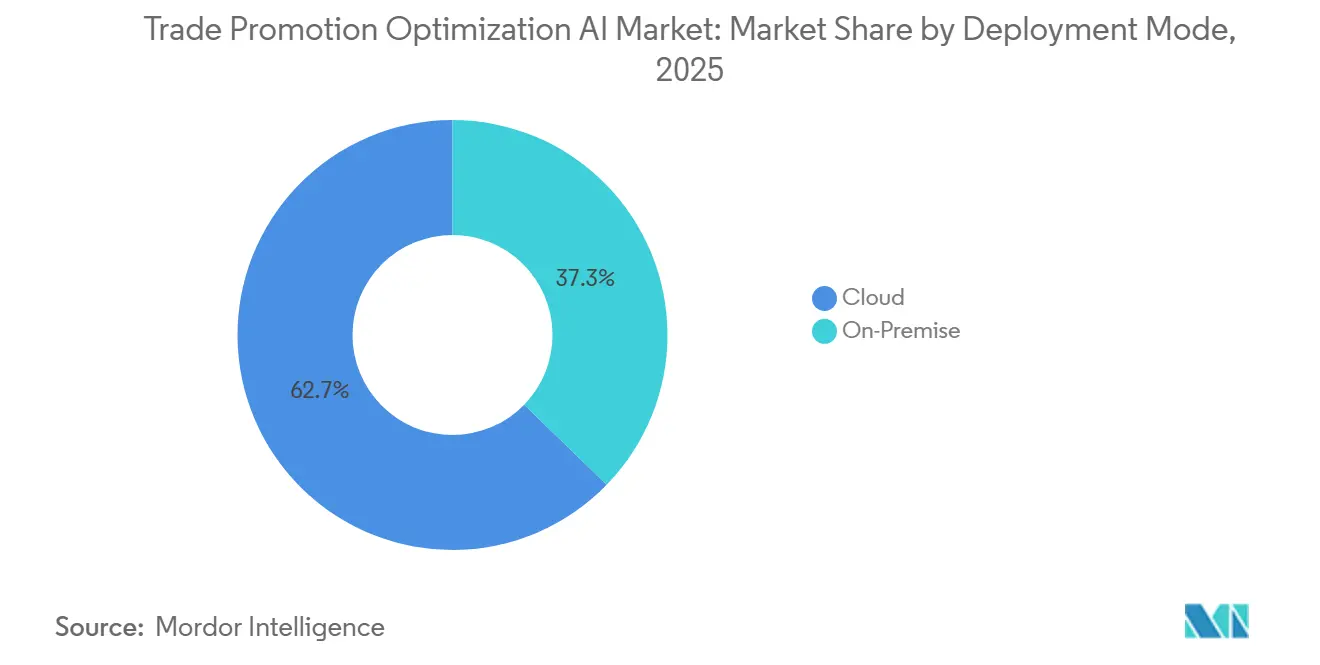
- By deployment mode, cloud accounted for 62.73% of revenue in 2025 and is expected to continue to grow at a 21.34% CAGR over the forecast period.
- By component, solutions held 58.23% trade promotion optimization AI market share in 2025; services are projected to expand at a 21.32% CAGR through 2031.
- By industry vertical, consumer-packaged goods led with 29.21% spending in 2025, whereas retail and e-commerce are advancing at a 17.82% CAGR to 2031.
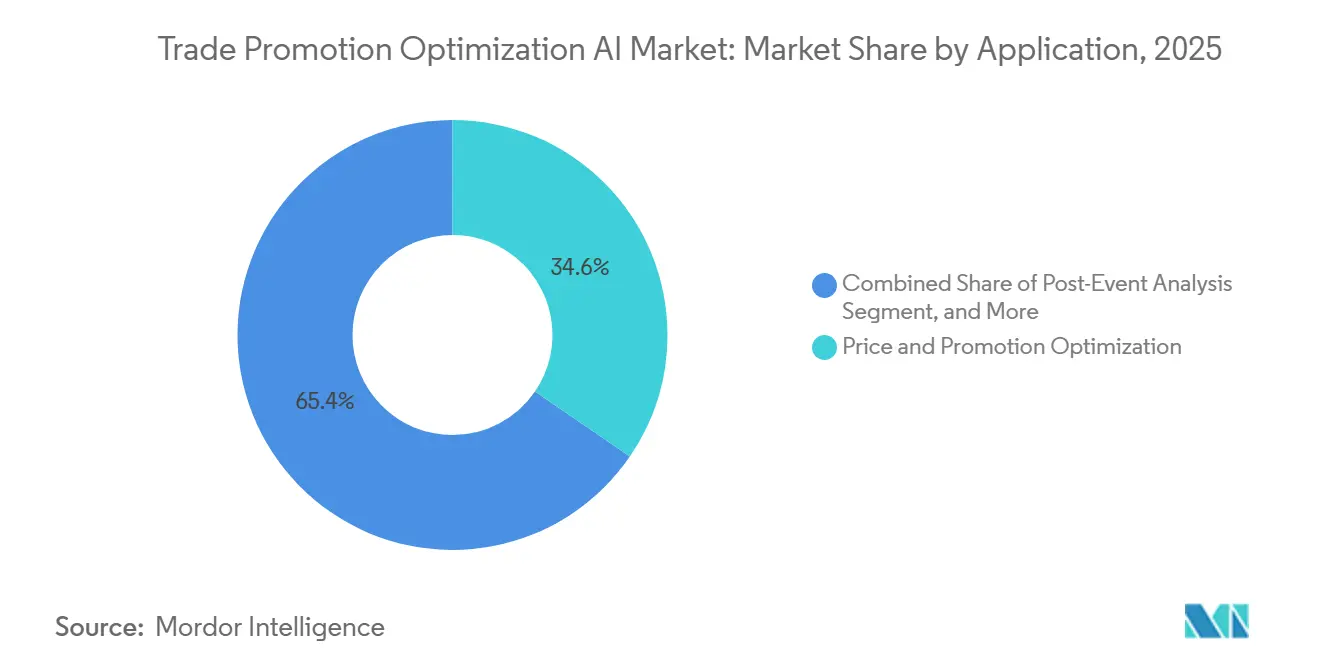
- By application, price and promotion optimization captured 34.56% of the trade promotion optimization artificial intelligence market size in 2025, and AI-driven recommendation systems are accelerating at a 22.67% CAGR.
- By organization size, large enterprises accounted for 57.89% of of the TPO AI market adoption in 2025, but small and medium enterprises are growing at a 19.41% CAGR.
- By geography, North America held 41.37% of the TPO artificial intelligence market share in 2025, and Asia-Pacific is registering the fastest 18.23% CAGR through 2031.
Note: Market size and forecast figures in this report are generated using Mordor Intelligence’s proprietary estimation framework, updated with the latest available data and insights as of January 2026.
Global Trade Promotion Optimization AI Market Trends and Insights
Driver Impact Analysis*
| Driver | (~) % Impact on CAGR Forecast | Geographic Relevance | Impact Timeline |
|---|---|---|---|
| Growing Availability of High-Fidelity Point-of-Sale Data | +3.2% | Global, with North America and Europe leading; Asia-Pacific catching up via retail digitization | Medium term (2-4 years) |
| Rapid Advances in GenAI-Powered Predictive Algorithms | +2.8% | Global, concentrated in North America and Asia-Pacific innovation hubs | Short term (≤ 2 years) |
| Cloud Cost Reductions Enabling SMB Adoption | +2.1% | Global, particularly impactful in Asia-Pacific and South America for cost-sensitive SMBs | Medium term (2-4 years) |
| Retailer Demand for Real-Time Price Elasticity Insights | +1.9% | North America and Europe core; spillover to Asia-Pacific premium retail | Short term (≤ 2 years) |
| Supermarket Private-Label Expansion Requiring Precise Promotion Math | +1.3% | North America and Europe; emerging in Asia-Pacific urban centers | Long term (≥ 4 years) |
| Privacy-Preserving Federated Learning Models in CPG Retail | +0.9% | Europe (GDPR-driven), North America (CCPA), with gradual Asia-Pacific adoption | Long term (≥ 4 years) |
| Source: Mordor Intelligence | |||
Growing Availability of High-Fidelity Point-of-Sale Data
Electronic shelf labels and unified-commerce platforms stream SKU-level transactions at minute-by-minute cadence, giving machine-learning models fuel to calculate cross-category effects with laboratory-grade precision. Walmart’s rollout cut price-change cycles from days to minutes, while Alibaba’s Hema updates roughly 1,000 labels in 23 seconds, proving that rapid feedback loops are now plausible at hypermarket scale. NielsenIQ’s 2025 acquisition of Gastrograph AI layers sensory-preference predictions onto this data stack, letting category teams test flavor concepts virtually before pilot runs. The intersection of loyalty cards, live inventory, and competitor scraping transforms promotion planning into a continuous control loop, replacing quarterly spreadsheets with near-real-time optimization.
Rapid Advances in GenAI-Powered Predictive Algorithms
Transformer architectures once used for language tasks now predict purchase likelihood for low-frequency categories, solving cold-start challenges that plagued rule-based engines. Toshiba Tec embedded generative modules directly into promotion optimization software in 2024, enabling one-to-one coupon allocation under tight funding limits. Profitmind’s agentic AI, backed by Accenture Ventures in 2026, produces ranked weekly action lists that combine pricing, inventory, and assortment moves tied to profit impact, compressing analysis and execution into a single workflow. The market narrative is shifting from insight generation to automated decisioning that closes the loop without human re-keying.
Cloud Cost Reductions Enabling SMB Adoption
Price cuts from hyperscalers, combined with serverless analytics, let emerging brands test optimization quickly and pay only for the compute they consume. Vividly offers usage-based tiers that allow a USD 50 million beverage startup to run the same Monte Carlo simulations as a USD 10 billion multinational, leveling the analytical playing field. In India, 99% of enterprises increased their AI budgets in 2025, a leapfrogging that favors cloud-first deployments free of on-premises debt. The lower cost of entry fuels the long tail of the trade promotion optimization AI market, expanding total addressable demand.
Retailer Demand for Real-Time Price Elasticity Insights
Grocers facing inflation and private-label encroachment are monetizing first-party data by insisting on fine-grained elasticity curves before approving brand funding. Kroger Precision Marketing’s attribution engine demonstrates how retailers now sell analytical services alongside shelf space, turning data sharing into a revenue stream. Target’s 2026 technology roadmap cites AI-driven inventory precision as a hedge against post-promotion overstock, linking accurate elasticity to working-capital savings. This pull from the buy side accelerates adoption because brands must comply or risk losing end-cap visibility.
Restraint Impact Analysis*
| Restraint | (~) % Impact on CAGR Forecast | Geographic Relevance | Impact Timeline |
|---|---|---|---|
| Legacy ERP Integration Complexities | -1.8% | Global, particularly acute in North America and Europe with entrenched SAP and Oracle installations | Medium term (2-4 years) |
| Rising Consumer Data-Privacy Regulations | -1.4% | Europe (GDPR), North America (CCPA, state-level laws), expanding to Asia-Pacific | Short term (≤ 2 years) |
| Low Analytical Maturity in Emerging Markets | -0.7% | South America, Middle East, Africa, and parts of Asia-Pacific | Long term (≥ 4 years) |
| Internal Change-Management Barriers | -0.5% | Global, affecting organizations with siloed functions and manual planning cultures | Medium term (2-4 years) |
| Source: Mordor Intelligence | |||
Legacy ERP Integration Complexities
SAP and Oracle systems built on batch architectures resist real-time data ingestion, forcing enterprises to stitch middleware and transformation pipelines that elongate deployment timelines. An industry survey found 83% of retailers struggling to unify siloed data, underscoring the hidden costs behind plug-and-play marketing claims.[1]Duvo.ai, “State of Retail Data Integration 2024,” duvo.ai Infosys’s TradeEdge modules exemplify the compromise, reconciling nightly ERP logs with streaming feeds to feed optimization engines while preserving audit trails. Until standardized connectors mature, integration friction will temper the trade promotion optimization AI market’s otherwise robust growth.
Rising Consumer Data-Privacy Regulations
GDPR and CCPA restrict profiling without explicit consent, curbing the granularity of targeting algorithms and shrinking addressable audiences. Large multinationals can fund privacy-by-design teams, but small brands shoulder a disproportionate compliance burden, slowing adoption velocity. Federated learning promises relief by keeping raw data decentralized, yet commercial rollouts remain nascent as legal teams vet the approach for cross-border data flows.[2]European Commission, “General Data Protection Regulation,” europa.eu This mosaic of regional rules adds overhead and mandates explainable AI dashboards that prove a lawful basis for every promotion.
*Our forecasts treat driver/restraint impacts as directional, not additive. The impact forecasts reflect baseline growth, mix effects, and variable interactions.
Segment Analysis
By Deployment Mode: Cloud Dominates, On-Premise Fades
Cloud accounted for 62.73% of 2025 revenue, highlighting its effectiveness in handling streaming point-of-sale feeds and providing on-demand computational capabilities. The trade promotion optimization AI market size for cloud deployments is anticipated to grow at a compound annual growth rate (CAGR) of 21.34% during the forecast period from 2026 to 2031. This growth is expected to further widen the gap between cloud-based solutions and legacy on-premises installations. Enterprises are increasingly adopting cloud solutions for their ability to deliver faster time-to-value, support elastic scaling, and significantly reduce capital expenditure. Additionally, regulatory bodies are increasingly accepting regionally partitioned cloud infrastructures that comply with data-residency requirements, further driving adoption.
The Asia-Pacific region exemplifies the advantages of cloud adoption. For instance, India’s ongoing retail digitization initiatives are fostering greenfield launches that entirely bypass traditional on-premises server setups. Similarly, Japan’s Nippon Access has reported profit gains ranging from 6% to 20% by leveraging a cloud-native pricing AI solution. To address security concerns, vendors are introducing hybrid cloud models that retain sensitive master data on-premises while leveraging the cloud for model training. This approach is enabling cloud adoption even in highly regulated industries, such as the pharmaceutical industry, where data security and compliance are critical.


By Component: Solutions Lead, Services Surge
Solutions captured 58.23% revenue in 2025, dominated by subscription licenses for optimization engines and analytics dashboards. Yet the services slice is advancing at a 21.32% CAGR because enterprises recognize that change management, data cleansing, and continuous model tuning determine return on investment. Trade promotion optimization AI industry consultancies embed sprint teams within merchandising functions to shepherd adoption and guarantee financial outcomes.
The 2026 cost-reduction blueprint emphasizes establishing a transformation management office that integrates savings directly into budgets, underscoring that software solutions alone are insufficient. Wipro’s partnership with RELEX combines platform rollouts with dedicated implementation squads, while NEC offers a managed service desk that interprets algorithmic outputs for category managers. NEC melds AI-driven pricing models with business process outsourcing in its retail price optimization solution. A dedicated pricing team not only operationalizes these offers but also explains their rationale to merchandisers and conducts performance analyses. This approach underscores NEC's offering as a model focused on generating results, rather than merely selling a tool.[3]NEC, “Retail Price Optimization Solution,” nec.com
By Industry Vertical: CPG Leads, Retail and E-Commerce Accelerate
Consumer-packaged goods accounted for 29.21% of 2025 spending, making it the second-largest profit-and-loss (P&L) line item after cost of goods sold. This highlights the significant role of trade promotion optimization in managing expenses and driving profitability within this market. Retail and e-commerce, however, are expanding at a compound annual growth rate (CAGR) of 17.82%, as grocers transition from being passive recipients of trade dollars to becoming active optimizers who manage their own promotion calendars. This shift reflects the growing importance of strategic trade promotion management in these sectors. Among 8,913 brands analyzed, those using Vividly’s platform achieved 8% higher sales growth, even amid industry-wide challenges such as erosion in return on investment (ROI), underscoring the platform's effectiveness in boosting performance.
Perishability and seasonal demand fluctuations make food and beverage companies early adopters of AI solutions for trade promotion optimization. For instance, a beverage client successfully reduced trade spending from 24% to 19% of sales, resulting in an additional USD 1.1 million in profit. This demonstrates the tangible financial benefits of adopting such technologies. Electronics companies leverage optimization tools to align markdowns with inventory turnover, ensuring efficient stock management and profitability. Meanwhile, pharmaceutical firms require audit-grade logs to meet stringent FDA compliance standards, further expanding the addressable market for trade promotion optimization AI. These examples underscore the diverse applications and growing demand for AI-driven solutions across various industries.
By Application: Price Optimization Dominates, AI Recommendations Surge
Price and promotion optimization accounted for 34.56% of 2025 revenue, serving as the cornerstone of the ecosystem since all other modules depend on precise elasticity curves. The adoption of AI-driven recommendation systems is growing at a 22.67% CAGR, streamlining calendar tactics and reducing the manual workload for planners who previously relied on spreadsheets. When integrated with post-event analysis, these systems create a closed feedback loop, ensuring that insights from past campaigns are applied to optimize future resource allocation.
Profitmind serves as a prime example of this convergence, generating an approved weekly action package that seamlessly integrates into execution tools, thereby eliminating the need for manual data entry. Additionally, retail media optimization, deduction management, and demand forecasting are increasingly being incorporated into unified software suites. This trend reflects a growing preference among buyers for comprehensive, single-pane platforms over fragmented, stitched-together point solutions.

By Organization Size: Enterprises Hold Share, SMBs Close Gap
Large enterprises accounted for 57.89% of 2025 spend, driven by their larger budgets and in-house analytics teams that can leverage advanced trade promotion optimization tools. However, small and medium enterprises (SMEs) are experiencing significant growth, expanding at a 19.41% CAGR. This growth is facilitated by the adoption of serverless architecture and usage-based billing models, which lower entry barriers for smaller players. The trade promotion optimization AI market for SMEs is evolving as platforms unbundle their modules, enabling smaller businesses, such as a craft snack company, to initially subscribe to price optimization tools and later scale up by adding features like deduction management as their operational needs grow.
According to Vividly’s data, SMB users were 33% more likely to improve ROI, even with reduced budgets. This highlights that disciplined optimization strategies, rather than sheer spend volume, are the key drivers of profitability. Additionally, as vendors introduce self-serve connectors for platforms like Shopify and QuickBooks, the adoption barriers for smaller businesses continue to diminish. This trend is effectively narrowing the analytics gap between challenger brands and established global incumbents, fostering a more competitive market landscape.
Geography Analysis
North America led with 41.37% revenue in 2025, reflecting mature point-of-sale infrastructure, retailer media networks, and early adoption by Fortune 500 CPG firms. The region's dominance is driven by advanced technological integration and retailers' ability to leverage data for strategic decision-making. Kroger Precision Marketing’s closed-loop attribution and Target’s AI roadmap highlight how retailers monetize data as a service, compelling brands to align promotion funding with algorithmic ROI benchmarks. Additionally, private-label penetration, which has surpassed 21% of grocery sales, intensifies competition, making precise promotion math a strategic imperative for businesses aiming to maintain market share and profitability.
Europe ranks second but faces challenges due to GDPR constraints that push vendors toward federated learning and explainable dashboards. Retailers in Germany and the Netherlands are piloting privacy-preserving architectures that calculate lift without exporting raw loyalty data, ensuring compliance with stringent data protection regulations. While the trade promotion optimization AI market share in Europe remains substantial, growth lags behind North America because compliance cycles extend procurement decision-making timelines. Despite these challenges, the region continues to invest in innovative solutions to balance regulatory requirements with the need for advanced analytics, ensuring steady market development.
Asia-Pacific is the fastest-growing region, with a 18.23% CAGR, buoyed by digital-native retailers, rising disposable incomes, and government AI agendas. India’s retail sector demonstrates strong demand for greenfield cloud-native optimization tools. China’s nationwide AI rollout accelerates store automation, while Japan’s Lawson uses transformer-based engines to allocate new-store media budgets.[4]Commerce Innovation, “Lawson Utilizes DNP Promotion Optimization AI,” tsuhan-ec.jp South America, the Middle East, and Africa advance in pockets, Brazilian hypermarkets and UAE convenience chains pilot dynamic pricing, but fragmented data and lower analytical maturity temper region-wide scaling.

Competitive Landscape
Competitive intensity in the market remains moderate, with enterprise software giants, analytics specialists, and emerging startups competing for overlapping niches. Blue Yonder integrated generative AI into its planning suite in 2026, leveraging Panasonic's supply-chain expertise to deliver shelf-level decision-making capabilities alongside inventory control. Accenture-backed Profitmind has positioned itself as a decision-intelligence layer, focusing on orchestrating pricing, assortment, and promotion strategies. The company has reported significant client profit improvements, exceeding 250 basis points. Additionally, Wipro’s partnership with RELEX combines implementation services with AI-driven engines, highlighting the integrator's ambition to take ownership of transformation outcomes in the market.
Technology roadmaps are increasingly prioritizing explainability, closed-loop measurement, and cross-functional coordination to meet evolving market demands. NEC has introduced managed services that convert algorithmic outputs into actionable, merchant-friendly playbooks, enhancing usability for businesses. Nippon Access, on the other hand, employs counterfactual learning techniques, achieving profit gains ranging from 6% to 20% in pilot stores. As competition intensifies, feature parity in demand forecasting is no longer sufficient to secure deals. Instead, speed-to-value and ease of integration have emerged as critical factors defining competitive advantage in the market.
Despite the competitive landscape, white-space opportunities remain untapped in specific areas. Mid-market CPG brands in the Asia-Pacific region present significant growth potential, particularly for companies offering tailored solutions. Similarly, vertical-specific compliance modules for industries such as pharmaceuticals and electronics are gaining traction. These opportunities highlight the need for market players to focus on niche segments and develop specialized offerings to address unique challenges. By targeting these areas, businesses can differentiate themselves and capture value in an increasingly competitive environment.
Trade Promotion Optimization AI Industry Leaders
NielsenIQ, LLC
SAP SE
Oracle Corporation
Aera Technology, Inc.
o9 Solutions, Inc.
- *Disclaimer: Major Players sorted in no particular order

Recent Industry Developments
- March 2026: Wonderful raised USD 150 million Series B funding led by Insight Partners to expand its enterprise AI agent platform across 30-plus countries, targeting telecom, manufacturing, and healthcare verticals.
- February 2026: Profitmind secured USD 9 million Series A financing led by Accenture Ventures to scale its agentic decision-intelligence platform for retail pricing, inventory, and promotions.
- January 2026: Accenture invested in Profitmind as part of a strategic rollout of agentic AI for retail merchandising, while McKinsey highlighted the benefits of scenario simulation in a concurrent analysis.
- January 2026: Blue Yonder introduced AI-powered planning agents and shelf-operations modules, embedding generative AI into promotional workflows.


Global Trade Promotion Optimization AI Market Report Scope
The Trade Promotion Optimization (TPO) AI Market refers to the global market for artificial intelligence, driven software solutions, and services designed to help organizations plan, execute, optimize, and analyze trade promotions across distribution channels. These platforms leverage technologies such as machine learning, predictive analytics, and data modeling to enhance promotional effectiveness, forecast demand, optimize pricing and discount strategies, and estimate the return on promotional investments.
The Trade Promotion Optimization AI Market Report is Segmented by Deployment Mode (Cloud, and On-Premise), Component (Solutions, and Services), Industry Vertical (Consumer Packaged Goods, Retail and E-Commerce, Food and Beverage, Pharmaceutical and Healthcare, Electronics and Appliances, and Other Industry Verticals), Application (Promotion Planning and Calendar Management, Demand Forecasting, Price and Promotion Optimization, Post-Event Analysis, and Other Applications), Organization Size (Large Enterprises, Small and Medium Enterprises), and Geography (North America, South America, Europe, Asia-Pacific, and Middle East and Africa). The Market Forecasts are Provided in Terms of Value (USD).
| Cloud |
| On-Premise |
| Solutions |
| Services |
| Consumer Packaged Goods |
| Retail and E-Commerce |
| Food and Beverage |
| Pharmaceutical and Healthcare |
| Electronics and Appliances |
| Other industry Verticals |
| Promotion Planning and Calendar Management |
| Demand Forecasting |
| Price and Promotion Optimization |
| Post-Event Analysis |
| Other Applications |
| Large Enterprises |
| Small and Medium Enterprises |
| North America | United States | |
| Canada | ||
| Mexico | ||
| South America | Brazil | |
| Argentina | ||
| Rest of South America | ||
| Europe | United Kingdom | |
| Germany | ||
| France | ||
| Italy | ||
| Spain | ||
| Rest of Europe | ||
| Asia-Pacific | China | |
| Japan | ||
| India | ||
| South Korea | ||
| Rest of Asia-Pacific | ||
| Middle East and Africa | Middle East | United Arab Emirates |
| Saudi Arabia | ||
| Rest of Middle East | ||
| Africa | South Africa | |
| Egypt | ||
| Rest of Africa | ||
| By Deployment Mode | Cloud | ||
| On-Premise | |||
| By Component | Solutions | ||
| Services | |||
| By Industry Vertical | Consumer Packaged Goods | ||
| Retail and E-Commerce | |||
| Food and Beverage | |||
| Pharmaceutical and Healthcare | |||
| Electronics and Appliances | |||
| Other industry Verticals | |||
| By Application | Promotion Planning and Calendar Management | ||
| Demand Forecasting | |||
| Price and Promotion Optimization | |||
| Post-Event Analysis | |||
| Other Applications | |||
| By Organization Size | Large Enterprises | ||
| Small and Medium Enterprises | |||
| By Geography | North America | United States | |
| Canada | |||
| Mexico | |||
| South America | Brazil | ||
| Argentina | |||
| Rest of South America | |||
| Europe | United Kingdom | ||
| Germany | |||
| France | |||
| Italy | |||
| Spain | |||
| Rest of Europe | |||
| Asia-Pacific | China | ||
| Japan | |||
| India | |||
| South Korea | |||
| Rest of Asia-Pacific | |||
| Middle East and Africa | Middle East | United Arab Emirates | |
| Saudi Arabia | |||
| Rest of Middle East | |||
| Africa | South Africa | ||
| Egypt | |||
| Rest of Africa | |||


Key Questions Answered in the Report
How fast is the trade promotion optimization AI market expected to grow?
It is projected to rise from USD 2.47 billion in 2026 to USD 4.58 billion by 2031 at a 13.14% CAGR.
Which deployment mode is winning adoption?
Cloud deployment leads with 62.73% 2025 revenue and is expanding at a 21.34% CAGR because it lowers infrastructure cost and speeds implementation.
What segment currently holds the largest share of spending?
Price and promotion optimization applications commanded 34.56% of 2025 revenue, underscoring the importance of pricing accuracy.
Why are services outpacing software growth?
Enterprises realize that change management, data cleansing, and model tuning are critical to unlock ROI, driving services at a 21.32% CAGR.
Which region will expand the fastest through 2031?
Asia-Pacific is forecast to grow at an 18.23% CAGR thanks to retail digitization and government AI initiatives.
What is the biggest barrier to adoption?
Integrating real-time optimization engines with legacy SAP and Oracle ERPs remains the costliest and slowest step, reducing overall CAGR by an estimated 1.8%.
Page last updated on:


