
Trade Marketing Services Market Size and Share
Market Overview
| Study Period | 2020 - 2031 |
|---|---|
| Market Size (2026) | USD 5.33 Billion |
| Market Size (2031) | USD 10.18 Billion |
| Growth Rate (2026 - 2031) | 13.82 % |
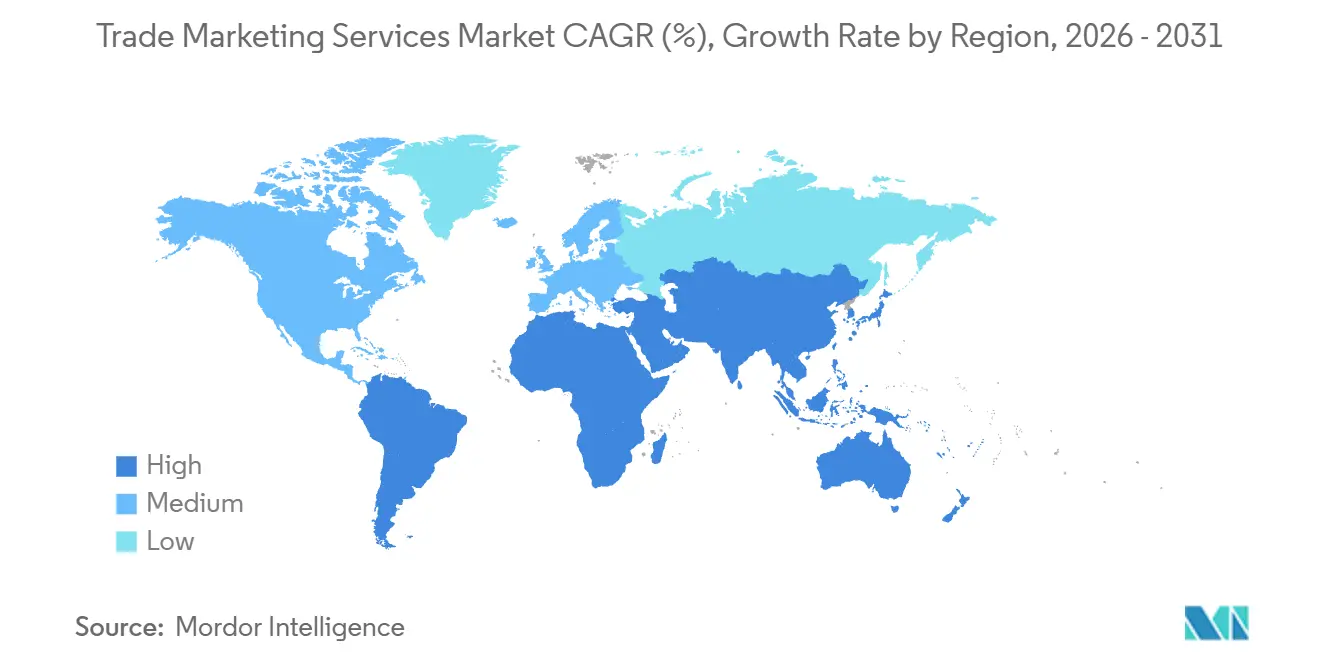
| Fastest Growing Market | Asia-Pacific |
| Largest Market | North America |
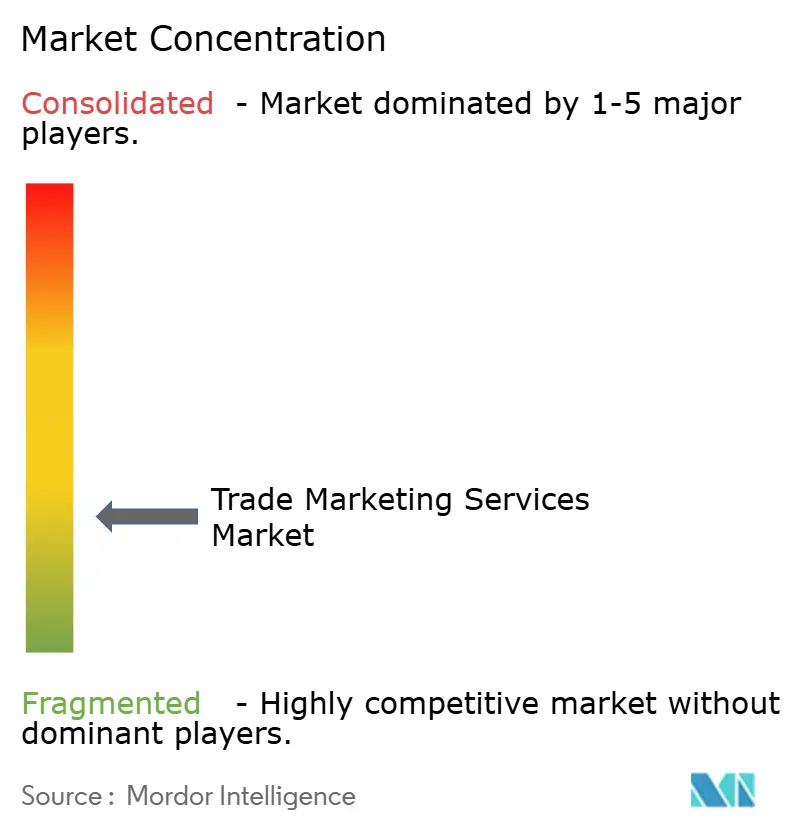
| Market Concentration | Low |
Major Players *Disclaimer: Major Players sorted in no particular order Image © Mordor Intelligence. Reuse requires attribution under CC BY 4.0. | |
Trade Marketing Services Market Analysis by Mordor Intelligence
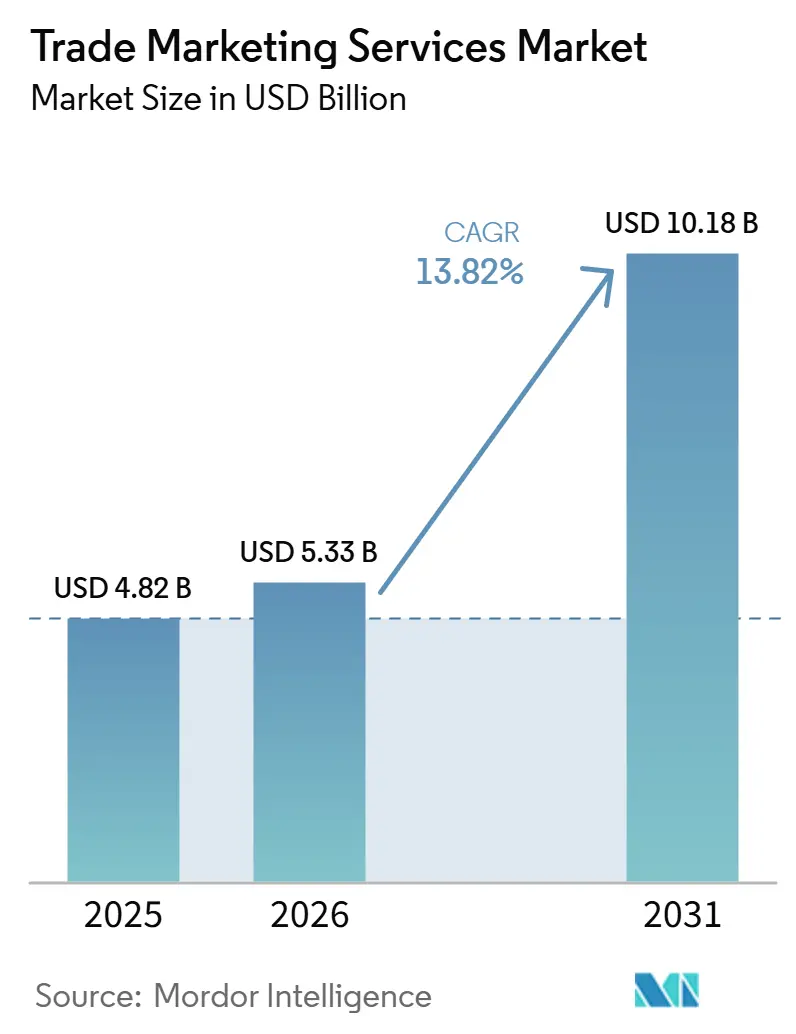
The Trade Marketing Services Market size was valued at USD 4.82 billion in 2025 and is estimated to grow from USD 5.33 billion in 2026 to reach USD 10.18 billion by 2031, at a CAGR of 13.82% during the forecast period (2026-2031). The Trade Marketing Services Market is expanding as manufacturers seek greater control over promotional spending, retailer agreements, and deduction claims, which can affect revenue recognition, customer relationships, and the quality of internal financial reporting. Enterprise buyers are connecting planning, execution, settlement, and measurement rather than treating them as separate activities within separate commercial and finance teams. Retail media, online marketplaces, quick commerce, and direct sales channels have increased the number of programs that must be coordinated across products, accounts, and promotion periods. This creates room for providers to combine financial controls with field execution and commercial analytics without forcing users to work across disconnected applications, separate spreadsheets, delayed retailer reports, or repeated manual reconciliations throughout the promotion cycle. Competition is also widening as ERP vendors, specialized platforms, and service providers pursue overlapping customer needs in planning, measurement, and operations.
Key Report Takeaways
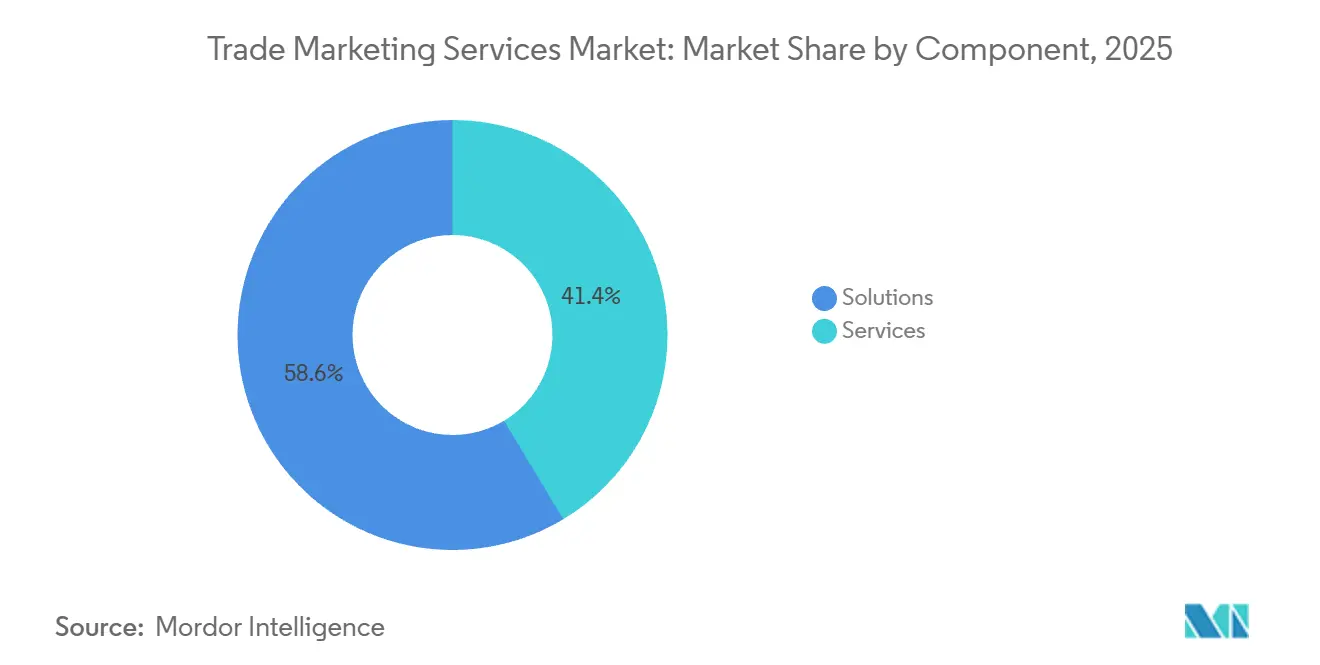
- By component, solutions led with 58.62% of the Trade Marketing Services Market share in 2025, while services are projected to expand at a 15.16% CAGR through 2031.
- By deployment mode, cloud held 52.56% of the Trade Marketing Services Market portion in 2025, while hybrid deployment is projected to expand at a 17.18% CAGR through 2031.
- By organization size, large enterprises commanded 62.66% share in 2025, while SMEs are expected to expand at a 15.17% CAGR through 2031.
- By application, price and promotion optimization accounted for 24.28% of the market share in 2025, while channel campaign automation and fund management are projected to expand at a 16.19% CAGR through 2031.
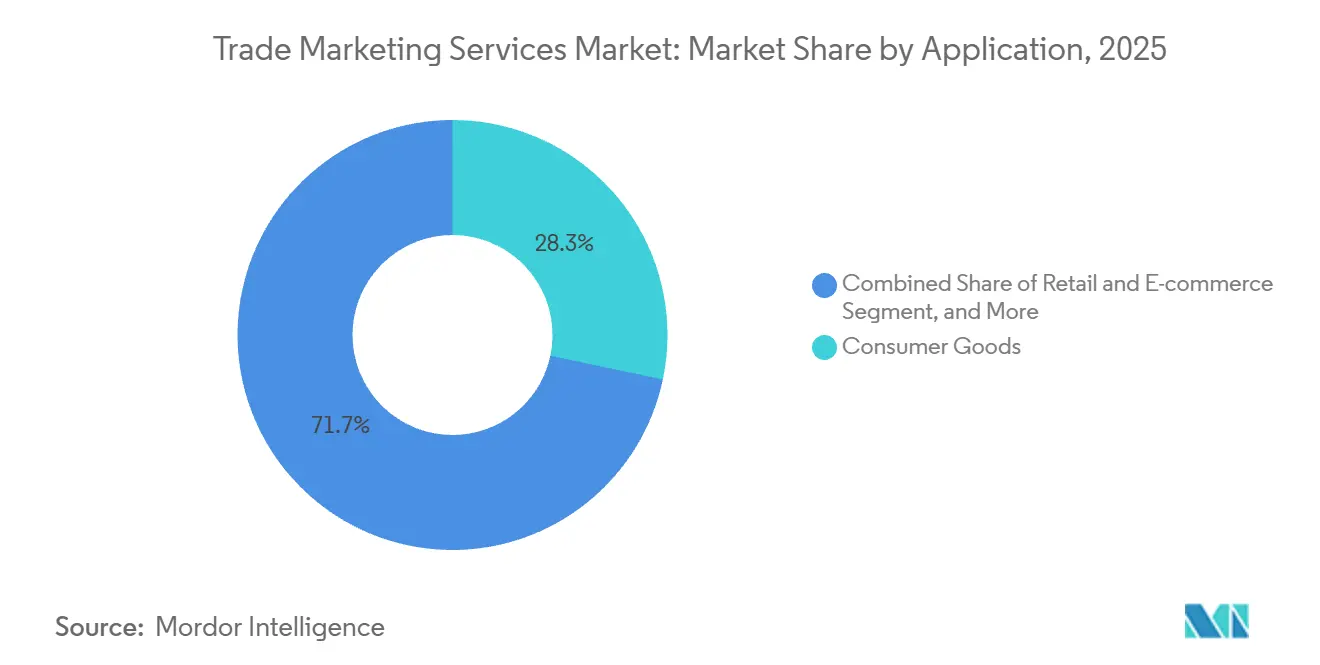
- By end-user industry, consumer goods held 28.32% share in 2025, while retail and e-commerce are projected to expand at a 15.18% CAGR through 2031.
Note: Market size and forecast figures in this report are generated using Mordor Intelligence’s proprietary estimation framework, updated with the latest available data and insights as of January 2026.
Market Trends and Insights
Drivers Impact Analysis of Trade Marketing Services Market*
| Driver | (~) % Impact on CAGR Forecast | Geographic Relevance | Impact Timeline |
|---|---|---|---|
| Pressure to Improve Trade Spend ROI | +3.0% | Global, with greater pressure in North America and Europe | Medium term (2-4 years) |
| Omnichannel Retail and Digital Commerce Activation | +2.5% | Asia-Pacific, North America, Europe | Medium term (2-4 years) |
| Cloud and AI-Enabled Trade Platforms | +2.3% | Global | Short term (≤ 2 years) |
| Real-Time Retail Execution Visibility | +1.9% | Asia-Pacific, North America, South America | Medium term (2-4 years) |
| Retail Media and Trade Budget Convergence | +1.7% | North America, Europe, Asia-Pacific | Long term (≥ 4 years) |
| Deduction Recovery and Promotion Compliance Automation | +1.4% | North America, Europe | Short term (≤ 2 years) |
| Source: Mordor Intelligence | |||
Increasing Pressure to Improve Trade Spend ROI
Consumer goods companies have historically devoted 15% to 25% of revenue to trade marketing activities, yet a material share of spending has lacked verified returns. The Trade Marketing Services Market addresses that issue by bringing together promotion records, claim validation, and recovery workflows into a single operating model. Genpact stated that companies can miss up to 20% of preventable deductions and leave more than 30% of invalid claims unresolved, resulting in claims that consume staff time and obscure the true financial results of promotions. Its deductions recovery offering was designed to automatically gather, validate, and resolve claims, with the potential to reduce financial leakage by 1.5% per engagement and achieve up to 15% additional annual recoveries, shifting routine evidence collection and checking away from manual review.[1]Genpact, “Genpact Introduces Agentic Deductions Solution to Recover Lost Revenue for Consumer Goods Companies,” Genpact, genpact.com. Automated, auditable resolution provides trade leaders with a finance-grade view of planned and realized spending across claims, customer accounts, and campaign periods. That visibility can change how finance teams approve, track, and challenge trade budgets when promotional performance falls short of original expectations.
Expansion of Omnichannel Retail and Digital Commerce Activation
General trade, modern trade, e-commerce, quick commerce, and direct-to-consumer sales now operate as connected channels for many manufacturers. This makes the Trade Marketing Services Market more relevant to joint business plans that require promotional plans, inventory signals, digital activation, and reliable operational data exchange. Digital advertising in European retail contexts grew 16% in 2024 to EUR 118.9 billion, equivalent to USD 128.4 billion at the 2024 average exchange rate, according to IAB Europe, demonstrating the growing commercial importance of channels that combine retailer data, advertising activity, and product promotion. Loyalty and data-driven formats showed the strongest growth outlook in that report. The need to link promotional planning with shelf visibility and retail media performance is raising buyer expectations for platform capabilities, reporting detail, and retailer collaboration. Providers that support those connections can become more central to commercial planning and account management as the retailer relationship becomes more data-dependent.
Accelerating Adoption of Cloud and AI-Enabled Trade Platforms
Cloud- and AI-enabled platforms are reducing the time required to use trade analytics and promotional workflows. SAP introduced AI-assisted deal sheet generation in its Revenue Growth Management suite in May 2026. The feature lets trade managers create retailer-ready promotional agreements in multiple languages and formats from one prompt interface.[2]SAP SE, “Precision at Speed: AI-Assisted Deal Sheet Generation in SAP Revenue Growth Management,” SAP Community, sap.com. XTEL placed its Revenue Growth Platform on the SAP Store in June 2026, with native SAP S/4HANA integration, highlighting the growing use of specialist tools alongside ERP systems. SAP also expanded its Google Cloud partnership in April 2026 to support coordination among AI agents across planning, execution, and analytics systems, helping enterprise users connect data and actions that would otherwise sit in separate systems. These developments support a more open software architecture in the Trade Marketing Services Market, enabling commercial teams to combine specialized and enterprise systems.
Rising Need for Real-Time Retail Execution Visibility
Trade programs increasingly need image-validated proof of placement, promotional compliance, and store-level execution. FORM introduced AI-powered image recognition for point-of-sale materials in July 2026. The capability automatically detects, classifies, and extracts in-store compliance information within existing field workflows.[3]FORM, “GoSpotCheck Expands AI Capabilities With Point-of-Sale Materials Detection Capabilities,” FORM, form.com. StayinFront signed 2 multi-year licensing and support agreements with contract sales organizations in May 2026 for its Retail Optimization Platform, reflecting demand for mobile systems that support field teams across broad store networks. The Trade Marketing Services Market, therefore, includes tools that turn field evidence into a record for commercial and finance teams, allowing images, visit observations, and execution checks to be linked to the original promotion, the responsible account, and later financial discussions over whether a claim should be accepted or challenged. As proof of execution becomes increasingly important to the validity of deductions, field data has value beyond performance monitoring and can support documentation of commercial claims.[4]StayinFront, “StayinFront's Retail Optimization Platform Selected by Leading Contract Sales Organizations,” StayinFront, stayinfront.com.
Restraints Impact Analysis of Trade Marketing Services Market*
| Restraint | (~) % Impact on CAGR Forecast | Geographic Relevance | Impact Timeline |
|---|---|---|---|
| Legacy ERP and Data Integration Complexity | -1.8% | Global, most acute among large enterprises in North America and Europe | Long term (≥ 4 years) |
| Low Data Harmonization and Organizational Readiness | -1.4% | Global, with greater intensity in emerging Asia-Pacific markets | Medium term (2-4 years) |
| Fragmented Retailer Data and Walled-Garden Measurement | -1.0% | North America, Europe | Medium term (2-4 years) |
| Deduction Audits and Proof-of-Performance Burden | -0.7% | North America, Europe | Short term (≤ 2 years) |
| Source: Mordor Intelligence | |||
Legacy ERP and Data Integration Complexity
Large consumer goods manufacturers often use ERP systems built for financial consolidation and supply chain execution rather than detailed promotion management. Connecting point-of-sale information, promotion terms, deduction records, and shipment confirmations can add months to a platform implementation, as each system has its own data structure, timing, owner, and exception-resolution process. The Trade Marketing Services Market must also accommodate reporting needs under US GAAP ASC 606 and IFRS 15. Those requirements make it essential to accurately account for trade accruals, variable consideration, and settlements when companies report across markets and must explain how commercial activity affects recognized revenue. XTEL provides certified connectors that write promotion accruals into SAP rebate agreements and route exceptions through SAP Workflow Management. Native integration can reduce manual reconciliation, but it does not eliminate the ongoing IT investment required for complex global deployments, particularly when new processes must be aligned with existing controls and reporting obligations.
Low Data Harmonization and Organizational Readiness
Data fragmentation also reflects organizational separation among trade, finance, and supply chain teams. Retailer point-of-sale files often differ in format, detail, refresh schedules, and reporting delays, making it difficult to consistently compare promotional performance across customers without an agreed-upon mapping and governance process. This limits cross-account comparisons until the manufacturer establishes a managed data harmonization layer with common definitions, controls, and refresh procedures. TELUS Consumer Goods manages data acquisition from the retailer portal, master data management, and file-format maintenance for Lindt Canada, demonstrating the operational support that some manufacturers require when internal teams cannot continually maintain retailer-specific data connections. The Trade Marketing Services Market cannot deliver its full value when workflows remain organized around disconnected datasets and success measures. Companies that automate existing processes without changing their operating model may see adoption before they see meaningful return on investment from those new tools.
*Our forecasts treat driver/restraint impacts as directional, not additive. The impact forecasts reflect baseline growth, mix effects, and variable interactions.
Trade Marketing Services Market Segment Analysis
By Component:
Solutions Lead While Services Spending AcceleratesSolutions held 58.62% of the Trade Marketing Services Market share in 2025, as buyers prioritized integrated software for promotion planning, price optimization, retail execution, and trade analytics. These platforms increasingly include generative AI for promotional reporting, scenario planning, and retailer communication, reducing repetitive preparation work for account teams while retaining formal approval and audit processes. The broader function of these products distinguishes them from older on-premises tools that focused on a narrow stage of the promotion cycle, such as planning an offer without connecting the eventual settlement result, retailer claim, field evidence, or later account-level assessment of performance against original commercial objectives, which can leave separate teams using incomplete records of the same commercial event. Software also supports common records across retail accounts, which can improve control over approvals and settlements when sales, finance, and customer teams need to work from the same promotion terms. Its installed base provides a stable foundation for the Trade Marketing Services Market as customers add capabilities over time, from basic planning through analytics, field execution, and deduction management, without necessarily replacing the core systems that continue to hold financial data and enterprise customer records.
Services are projected to expand at a 15.16% CAGR from 2026 to 2031, faster than solutions. Manufacturers often need help with implementation, data harmonization, promotional modeling, and performance reporting after a platform purchase, particularly when retailer files and internal systems do not use comparable records. Genpact launched an agentic deductions recovery service in June 2026, adding a managed route to a workflow that has often been handled internally. Wipro signed an 8-year Olam Group contract in April 2026 valued at more than USD 1 billion, with committed spending of USD 800 million, for transformation work that included customer engagement and trade operations. Such engagements blur the line between software licenses and outcome-linked operational support and may place pressure on standalone vendors in deduction management and analytics.


By Deployment Mode:
Cloud Leads While Hybrid Grows FastestCloud deployment accounted for 52.56% of the Trade Marketing Services Market in 2025. Buyers favored lower infrastructure requirements, faster onboarding, and compatibility with managed-service models, which can help companies access specialized operational support without building every capability internally. Cloud-native products can issue model updates continuously and scale during promotion periods that generate high volumes of point-of-sale data, allowing teams to work with current information rather than periodic extracts and to bring planning, finance, sales, and customer account users into a single workflow without local software maintenance. Regional configurations can also support EU data-residency requirements while helping multinational users apply local controls to retailer and shopper information. These advantages explain why the cloud remained the leading deployment approach.
Hybrid deployment is projected to expand at a 17.18% CAGR from 2026 to 2031. Many multinationals retain financial records, sensitive retailer terms, and ERP-linked accrual data in on-premises environments because internal governance, audit requirements, and legacy investments remain important. At the same time, they are moving planning and analytics workloads to the cloud, where teams can access shared tools, frequent updates, and scalable computing resources. The resulting architecture combines cloud scaling with governance over controlled records, letting teams use modern planning applications while maintaining established policies for sensitive financial and customer information. XTEL's SAP S/4HANA integration supports a model in which cloud planning layers write into ERP settlement engines through automated workflows, reflecting the practical transition path for large organizations in the Trade Marketing Services Market.
By Organization Size:
Large Enterprises Anchor Demand While SMEs ScaleLarge enterprises accounted for 62.66% of the Trade Marketing Services Market in 2025. A global consumer goods manufacturer can run tens of thousands of promotions each year across many markets, retail customers, product groups, and local campaign calendars. That scale requires detailed planning, approval, and financial settlement infrastructure that records commercial terms before, during, and after each promotional event. Large organizations also have more IT resources to connect trade systems with ERP, CRM, and supply chain planning software, enabling data to flow between commercial planning, order activity, and financial settlement rather than remaining in separate functional records. This supports closed-loop account-level measurement and keeps large enterprises central to provider revenue, renewal activity, complex implementation demand, and long-term software expansion decisions across global customer portfolios.
SMEs are projected to expand at a 15.17% CAGR from 2026 to 2031. Modular SaaS licensing, lighter implementation demands, and usage-based pricing have lowered the entry threshold for emerging brands that cannot support large implementation teams or lengthy transformation programs. Premium food, beauty, and specialty beverage brands may need promotional analytics early as they grow through e-commerce and specialty retail, where product availability, offers, and retailer programs can change quickly. They can adopt AI-enabled tools without the legacy systems that complicate large-enterprise deployments. o9 Solutions reported more than 130 successful go-lives and 28 consecutive quarters of ARR growth in March 2026. This points to a customer base extending beyond traditional large-enterprise accounts, though the largest organizations still account for the majority of spending.
By Application:
Price and Promotion Optimization Leads While Channel Automation AdvancesPrice and promotion optimization accounted for 24.28% of the Trade Marketing Services Market size in 2025. It covers scenario simulation, incremental volume forecasting, promotional calendar coordination, and return-on-investment measurement, bringing commercial assumptions and financial outcomes into one decision process. These functions address the established objective of improving promotional lift and trade-fund efficiency while giving commercial teams a clearer basis for choosing offers. AI capabilities are becoming part of this work in 2026 rather than a separate activity, assisting teams with analysis and preparation while decisions remain tied to commercial rules. The segment remains important because promotion choices affect both revenue growth and financial control.
Channel campaign automation and fund management are projected to expand at a 16.19% CAGR from 2026 to 2031. Brands with distributor, reseller, and retail partner programs need tools for fund allocation, co-branded campaigns, and performance tracking across partners with varying reporting practices and activation needs. Promotion planning and calendar management, trade analytics and decision support, and retail execution and merchandising remain connected parts of the broader workflow, because a campaign planned centrally still requires coordinated partner activation, store execution, and subsequent evaluation. ZINFI introduced AI-powered partner onboarding software in April 2026, claiming it reduced partner activation time by 60%. Faster partner activation can reduce administrative delay before campaigns reach the market and supports the need for more automated channel processes in the Trade Marketing Services Market.

By End-User Industry:
Consumer Goods Leads While Retail and E-Commerce Deepen EngagementConsumer goods accounted for 28.32% of the Trade Marketing Services Market in 2025. Food, beverage, personal care, and household product manufacturers use trade promotions to support volume, shelf placement, and distributor engagement, often across many retail accounts with different terms, product assortments, and local trading conditions. They also need to measure spending across retail and distribution channels so that promotional investment can be connected to customer agreements, product movement, and settlement outcomes. That dependence creates continuing demand for platforms that optimize, automate, and track trade investment through recurring annual planning cycles and frequent customer-specific promotions. Consumer goods, therefore, remained the largest end-user category, with regular promotional cycles and retailer negotiations sustaining platform demand.
Retail and e-commerce are projected to expand at a 15.18% CAGR from 2026 to 2031. Retailers are investing in tools to manage supplier co-investment, retail media inventory, and shopper marketing funds, creating demand on both sides of the manufacturer-retailer relationship. Healthcare and life sciences brands also use channel programs for medical device co-marketing with distributors, where account documentation and coordinated communication matter for program administration. The core need remains similar to that of consumer goods programs, in which funding, activity, and partner performance must be recorded consistently. Travel and hospitality companies use comparable systems for channel incentive programs, using partner-facing workflows that resemble fund management and campaign administration. Media and entertainment are gaining relevance as streaming services and content distributors administer reseller and affiliate programs. Circana and Ibotta announced a September 2025 partnership to measure household lift from digital promotions, underscoring the need to connect promotional exposure with incremental sales and to give brands a common view of outcomes.
Geography Analysis
North America Trade Marketing Services Market
North America held 36.41% of the Trade Marketing Services Market share in 2025. The region has a concentration of large consumer goods companies that are in later stages of trade analytics investment, with established retail relationships and a greater ability to finance ongoing modernization of commercial planning and measurement systems. Joint business plans with Walmart, Kroger, and Amazon increasingly combine trade and brand media spending, requiring the brand and retailer to consider promotional funding, media activity, and commercial outcomes together. This raises demand for tools that support both trade promotion management and retail media optimization. The IAB and Media Rating Council are working on measurement frameworks for in-store digital inventory, while Canada benefits from similar retail structures and Mexico offers an earlier-stage opportunity as modern trade expands.
APAC Trade Marketing Services Market
Asia-Pacific is projected to expand at a 15.24% CAGR from 2026 to 2031, the highest regional rate. India's FMCG value growth accelerated to 13.7% in the first half of 2025, underscoring the need for manufacturers to manage a wide mix of general trade, modern trade, digital commerce, and local distribution channels. China is shaped by social commerce and livestream selling, while e-commerce accounted for 40% of FMCG sales in China and South Korea, underscoring the need for coordinated promotional planning. Southeast Asian quick commerce requires immediate inventory and execution signals, making real-time tools increasingly relevant to the Trade Marketing Services Market across the region.
EMEA and South America Trade Marketing Services Market
Europe represented a significant share in 2025, with Germany, the United Kingdom, and France among the most mature national markets. The European digital advertising market grew 16% in 2024 to EUR 118.9 billion, equivalent to USD 128.4 billion at the 2024 average exchange rate. The Retail Media Alliance launched in Germany in March 2026 to create a centrally bookable in-store retail media ecosystem across 30,000 EDEKA stores. GDPR shapes the handling of shopper analytics and retailer data, while South America has seen early cloud-based adoption in Brazil and Argentina, but faces infrastructure gaps and currency volatility. The Middle East and Africa remained at an earlier adoption stage, with the UAE and Saudi Arabia's retail modernization programs driving demand for merchandising analytics and digital activation.

Competitive Landscape
The Trade Marketing Services Market is moderately fragmented. SAP SE, Oracle Corporation, and Salesforce compete with specialized providers such as UpClear, Visualfabriq, and Aforza. Circana and o9 Solutions bring analytics capabilities, while Wipro and Genpact provide service-led offerings, and no single provider covers consumer goods trade-fund optimization, field execution, and channel market-development fund management in full. This allows specialized providers to retain positions beside broader enterprise platforms, especially where customers want a focused solution for a complex operational task or need functions that an ERP implementation does not cover in sufficient detail for local teams and retail partners.
SAP has used product development, acquisition, and partnerships to extend its position. It introduced AI-assisted deal sheet generation in May 2026 and expanded its Google Cloud partnership in April 2026 to coordinate AI agents across systems. SAP completed its acquisition of Prior Labs in July 2026 and committed more than EUR 1 billion, equivalent to USD 1.10 billion at 2026 rates, over 4 years for a frontier AI lab focused on structured enterprise data. o9 Solutions introduced its APEX planning model in March 2026 to connect trade promotion, pricing, and assortment decisions. These moves show how providers are using AI to extend from individual trade tasks into wider commercial planning, structured data management, and decision support.
Opportunities remain among mid-market consumer goods manufacturers moving beyond spreadsheets, cross-border brands serving fragmented Asia-Pacific channels, and providers of deduction recovery services, because these buyers need focused tools that address immediate commercial problems without requiring a full enterprise software replacement or a lengthy multinational implementation program. Celonis and Valence introduced the Deductions and Disputes Manager in July 2026, while Genpact launched its Deductions Recovery solution in June 2026. ZINFI is applying AI to channel processes, including partner onboarding and market development fund workflows. ISO 27001 certification and GDPR compliance are important qualification criteria in North America and Europe, giving vendors with proven data-handling practices an advantage in enterprise procurement.
Trade Marketing Services Industry Leaders
SAP SE
Anaplan, Inc.
Wipro Limited
TELUS Communications Inc.
Oracle Corporation
- *Disclaimer: Major Players sorted in no particular order
Trade Marketing Services Market Companies Covered in this Report
- SAP SE
- Oracle Corporation
- Salesforce, Inc.
- Aforza Ltd
- Anaplan, Inc.
- UpClear SAS
- Repsly, Inc.
- StayinFront, Inc.
- Pepperi Ltd.
- Wiser Solutions, Inc.
- Asseco Business Solutions S.A.
- ParallelDots, Inc.
- Impartner Software, Inc.
- ZINFI Technologies, Inc.
- Mindmatrix Inc.
- Visualfabriq B.V.
- TELUS Communications Inc.
- o9 Solutions, Inc.
- Circana, LLC
- Wipro Limited

Recent Industry Developments in Trade Marketing Services Market
- July 2026: SAP SE completed the acquisition of Prior Labs, the pioneer of tabular foundation models, committing more than EUR 1 billion (USD 1.10 billion at 2026 rates) over 4 years to establish a frontier AI lab focused on structured enterprise data. The acquisition accelerated SAP's AI capability in trade planning, commercial analytics, and revenue growth management across its S/4HANA customer base.
- July 2026: Celonis and Valence Intelligence launched the Celonis Deductions and Disputes Manager, an agentic deductions management application using AI to gather, interpret, and validate deduction data from ERP systems, retailer portals, carrier websites, and internal systems. The solution compresses resolution timelines from weeks to days, targeting a problem that costs CPG brands 5% to 15% of gross sales.
- June 2026: Genpact launched its Deductions Recovery solution, an agentic AI product built on Microsoft Azure and Microsoft Foundry, designed to help consumer goods companies recover revenue lost to unresolved deduction claims. Kraft Heinz serves as a reference customer, and Genpact projects a 1.5% reduction in financial leakage per engagement and up to 15% additional annual recoveries.
- June 2026: XTEL listed its Revenue Growth Platform on the SAP Store, providing native integration with SAP S/4HANA, SAP Condition Contract Management, and SAP Business Technology Platform for CPG trade promotion optimization. In May 2026, Oakley Capital acquired a majority stake in XTEL following 40% ARR growth, providing capital for geographic expansion and RandD.


Global Trade Marketing Services Market Report Scope
The trade marketing services market refers to the ecosystem of solutions and professional services designed to help manufacturers and brands drive demand and optimize sales through their distribution channels, retailers, and business partners. This includes software platforms and strategic services for promotion planning, price and promotion optimization, retail execution and merchandising, trade analytics, and channel fund management. Deployed via cloud, on-premises, or hybrid models, these services cater to organizations of all sizes across industries such as consumer goods, retail, and healthcare. By aligning marketing strategies with distributor and retailer needs, trade marketing services enable businesses to improve shelf visibility, streamline channel campaigns, and maximize point-of-sale conversions.
The Trade Marketing Services Market Report is Segmented by Component (Solutions, and Services), Deployment Mode (Cloud, On-premises, and Hybrid), Organization Size (Large Enterprises, and Small and Medium Enterprises), Application (Promotion Planning and Calendar Management, Price and Promotion Optimization, Retail Execution and Merchandising, Trade Analytics and Decision Support, and Channel Campaign Automation and Fund Management), End User Industry (Retail and E-commerce, Media and Entertainment, Healthcare and Life Sciences, Travel and Hospitality, Consumer Goods, and Other End User Industries (BFSI, Education, Automotive, and IT and Telecom amongst Others)), and Geography (North America, South America, Europe, Asia-Pacific, Middle East, and Africa). The Market Forecasts are Provided in Terms of Value (USD).
| Solutions |
| Services |
| Cloud |
| On-premises |
| Hybrid |
| Large Enterprises |
| Small and Medium Enterprises |
| Promotion Planning and Calendar Management |
| Price and Promotion Optimization |
| Retail Execution and Merchandising |
| Trade Analytics and Decision Support |
| Channel Campaign Automation and Fund Management |
| Retail and E-commerce |
| Media and Entertainment |
| Healthcare and Life Sciences |
| Travel and Hospitality |
| Consumer Goods |
| Other End User Industries (BFSI, Education, Automotive, and IT and Telecom amongst Others) |
| North America | United States |
| Canada | |
| Mexico | |
| South America | Brazil |
| Argentina | |
| Chile | |
| Rest of South America | |
| Europe | Germany |
| United Kingdom | |
| France | |
| Italy | |
| Spain | |
| Rest of Europe | |
| Asia-Pacific | China |
| Japan | |
| India | |
| South Korea | |
| Australia | |
| Rest of Asia-Pacific | |
| Middle East | United Arab Emirates |
| Saudi Arabia | |
| Qatar | |
| Rest of Middle East | |
| Africa | South Africa |
| Egypt | |
| Nigeria | |
| Rest of Africa |
| By Component | Solutions | |
| Services | ||
| By Deployment Mode | Cloud | |
| On-premises | ||
| Hybrid | ||
| By Organization Size | Large Enterprises | |
| Small and Medium Enterprises | ||
| By Application | Promotion Planning and Calendar Management | |
| Price and Promotion Optimization | ||
| Retail Execution and Merchandising | ||
| Trade Analytics and Decision Support | ||
| Channel Campaign Automation and Fund Management | ||
| By End User Industry | Retail and E-commerce | |
| Media and Entertainment | ||
| Healthcare and Life Sciences | ||
| Travel and Hospitality | ||
| Consumer Goods | ||
| Other End User Industries (BFSI, Education, Automotive, and IT and Telecom amongst Others) | ||
| By Geography | North America | United States |
| Canada | ||
| Mexico | ||
| South America | Brazil | |
| Argentina | ||
| Chile | ||
| Rest of South America | ||
| Europe | Germany | |
| United Kingdom | ||
| France | ||
| Italy | ||
| Spain | ||
| Rest of Europe | ||
| Asia-Pacific | China | |
| Japan | ||
| India | ||
| South Korea | ||
| Australia | ||
| Rest of Asia-Pacific | ||
| Middle East | United Arab Emirates | |
| Saudi Arabia | ||
| Qatar | ||
| Rest of Middle East | ||
| Africa | South Africa | |
| Egypt | ||
| Nigeria | ||
| Rest of Africa | ||


Key Questions Answered in the Report
What is the size of the Trade Marketing Services Market?
The Trade Marketing Services Market was valued at USD 4.82 billion in 2025 and is estimated at USD 5.33 billion in 2026. It is forecast to reach USD 10.18 billion by 2031.
What is driving adoption of trade marketing services?
Companies are seeking better control over promotion spending, deductions, retail media activity, and proof of in-store execution.
Which component held the largest share in 2025?
Solutions held 58.62% share in 2025 because integrated platforms support planning, execution, settlement, and analytics.
Which deployment model is growing the fastest?
Hybrid deployment is projected to grow at a 17.18% CAGR through 2031 as enterprises retain controlled records on-premises while moving analytics to the cloud.
Which application is expected to grow most quickly?
Channel campaign automation and fund management is projected to expand at a 16.19% CAGR through 2031.
Which region is expected to grow the fastest?
Asia-Pacific is projected to expand at a 15.24% CAGR through 2031, supported by complex digital commerce and quick commerce environments.
Page last updated on:





