
Textile Manufacturing Market Size and Share
Market Overview
| Study Period | 2020 - 2031 |
|---|---|
| Market Size (2026) | USD 270.66 Billion |
| Market Size (2031) | USD 343.79 Billion |
| Growth Rate (2026 - 2031) | 4.90 % |
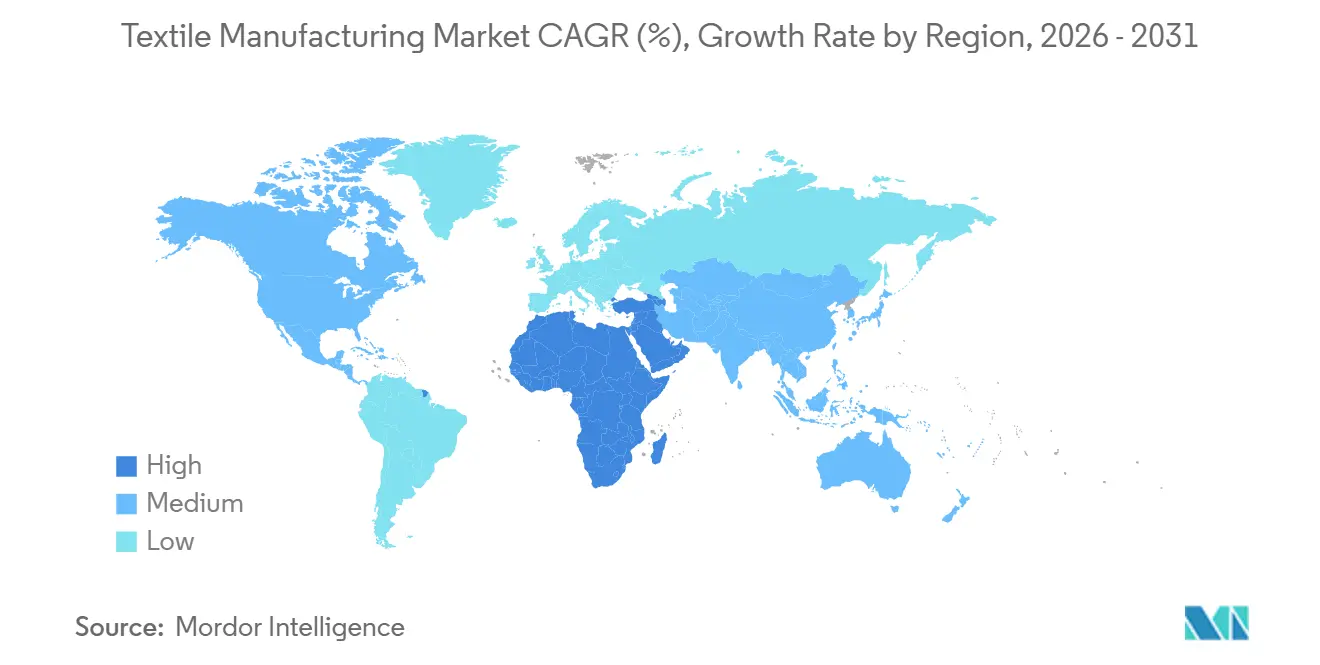
| Fastest Growing Market | Middle East and Africa |
| Largest Market | Asia-Pacific |
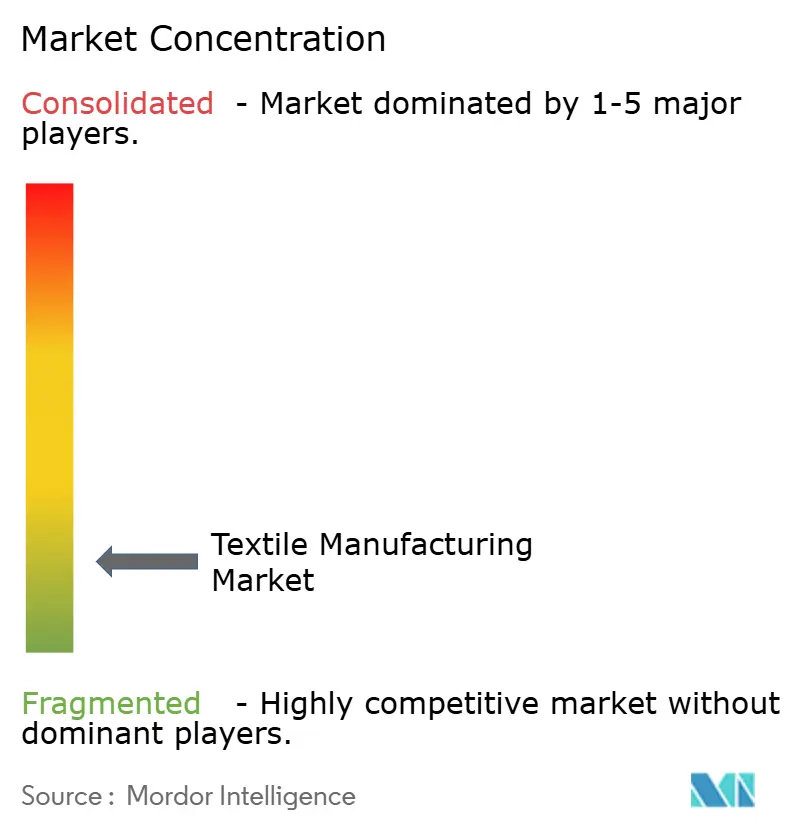
| Market Concentration | Low |
Major Players *Disclaimer: Major Players sorted in no particular order Image © Mordor Intelligence. Reuse requires attribution under CC BY 4.0. | |
Textile Manufacturing Market Analysis by Mordor Intelligence
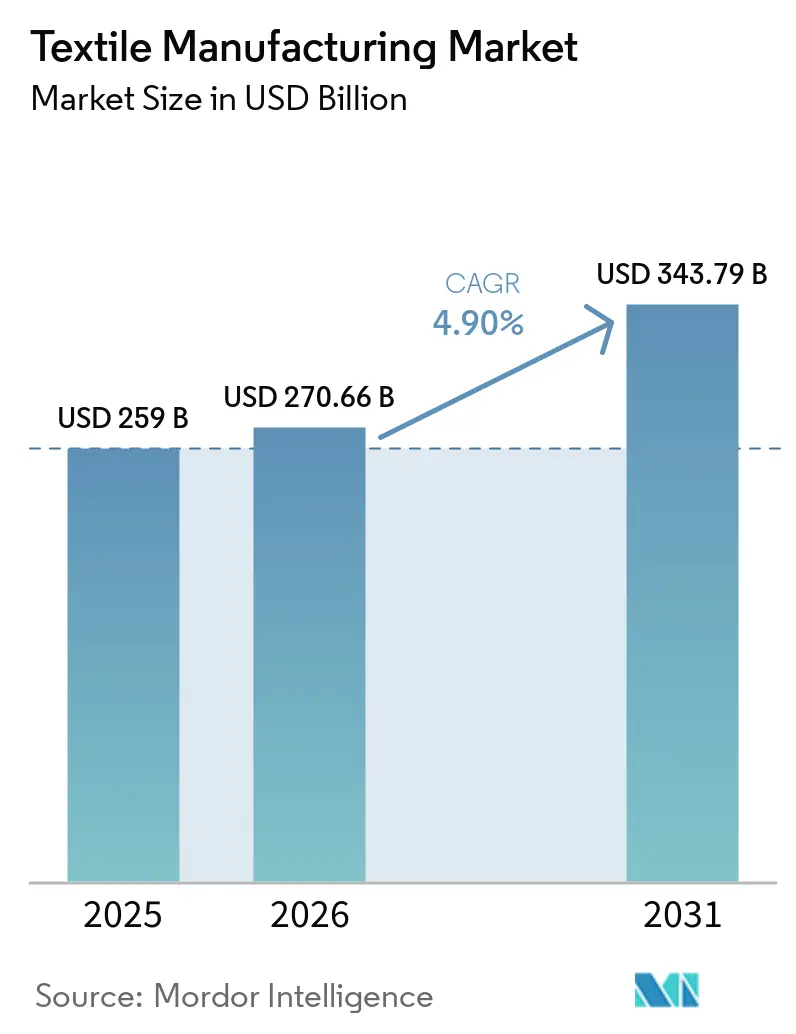
The Textile Manufacturing Market size was valued at USD 259 billion in 2025 and is estimated to grow from USD 270.66 billion in 2026 to reach USD 343.79 billion by 2031, at a CAGR of 4.90% during the forecast period (2026-2031).
The market is driven by buyer demand for certified performance, traceable materials, and documented chemical compliance. Recycled feedstock, production data, and automated quality control are becoming more relevant to supplier qualification. The European Union’s Digital Product Passport framework is reinforcing the need for auditable products and process information among export-oriented manufacturers. Nearshoring is directing investment toward locations that can offer responsive delivery and compliance-ready production. At the same time, energy costs, fiber price volatility, and wastewater compliance obligations disproportionately burden smaller producers, widening the competitive gap with large organized manufacturers with stronger operational and financial capacity in the textile manufacturing market.
Key Report Takeaways
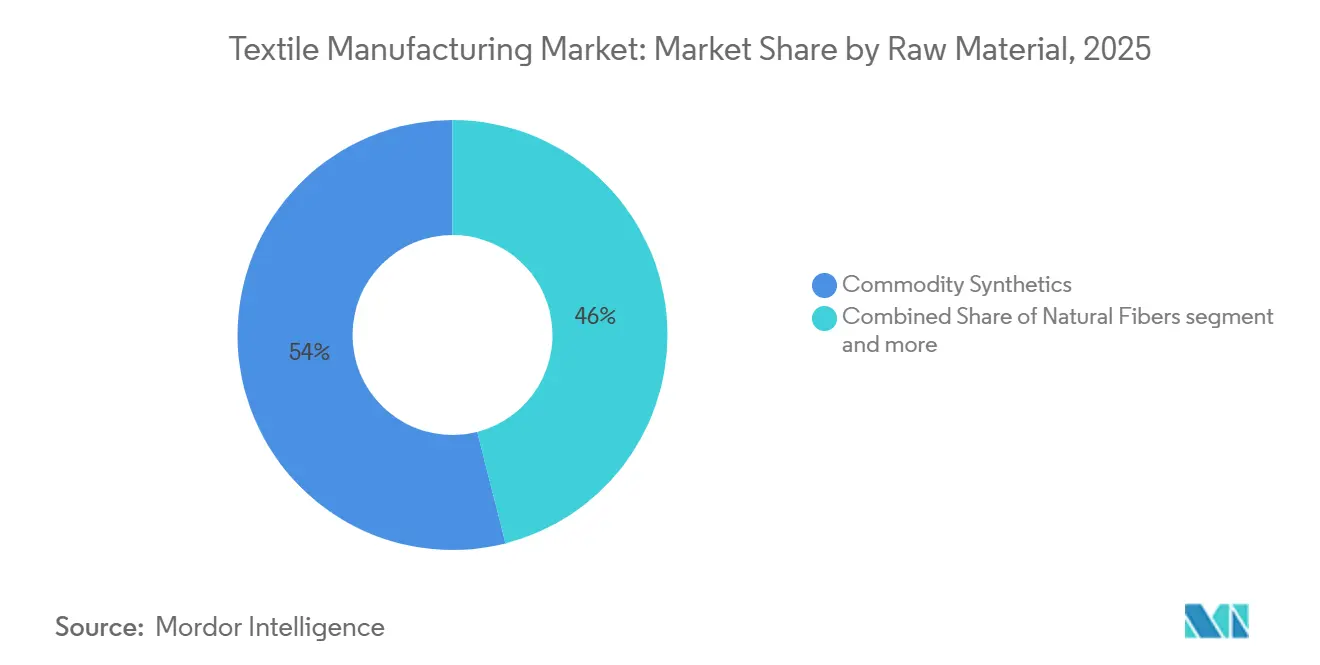
- By raw material, commodity synthetics held 54% of the textile manufacturing market share in 2025, while specialty and high-performance fibers are forecast to grow at an 8.8% CAGR through 2031.
- By manufacturing process and product type, fabric manufacturing accounted for 48.4% of the textile manufacturing market size in 2025, while textile finishing and surface treatment are projected to expand at a 7.6% CAGR through 2031.
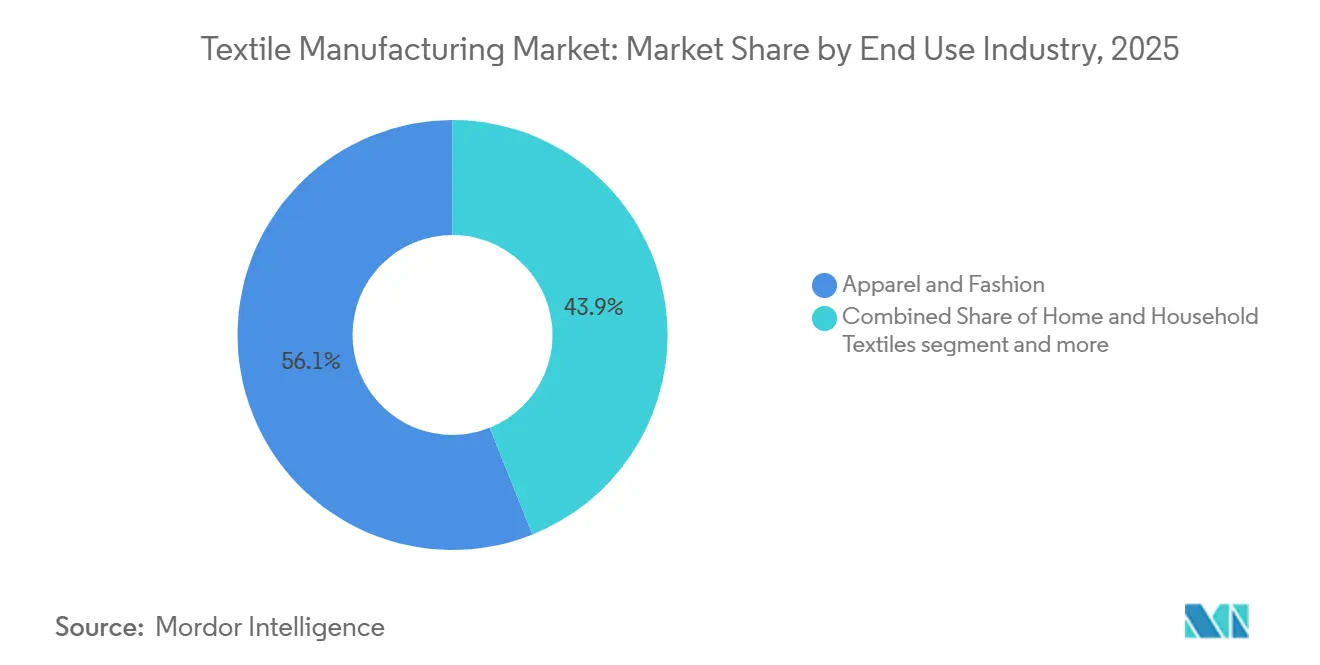
- By end-use industry, apparel and fashion held 56.1% of the textile manufacturing market share in 2025, while technical and industrial textiles are expected to record a 6.2% CAGR through 2031.
- By enterprise scale, micro, small, and medium enterprises and the unorganized sector accounted for 60% of revenue in 2025, while large organized manufacturers are projected to grow at a 5.8% CAGR through 2031.
- By geography, Asia-Pacific held 54.5% of output in 2025, while the Middle East and Africa are forecast to grow at a 5.8% CAGR through 2031.
Note: Market size and forecast figures in this report are generated using Mordor Intelligence’s proprietary estimation framework, updated with the latest available data and insights as of January 2026.
Market Trends and Insights
Drivers Impact Analysis of Textile Manufacturing Market*
| Driver | (~) % Impact on CAGR Forecast | Geographic Relevance | Impact Timeline |
|---|---|---|---|
| Demand for Technical and Performance Textiles | +1.3% | Global, with strongest demand in North America, Europe, and Asia-Pacific | Long term (≥ 4 years) |
| Expansion of Recycled and Bio-Based Fiber Capacity | +1.1% | Global, with early gains in Europe, Asia-Pacific, and Latin America | Medium term (2-4 years) |
| Digitalization of Textile Design and Production | +0.9% | Global, with leadership in Europe, ASEAN, and East Asia | Medium term (2-4 years) |
| Regulatory Push for Product Traceability and Circularity | +0.8% | European Union, with spillover to Asia-Pacific, North America, and Middle East and Africa export hubs | Long term (≥ 4 years) |
| Nearshoring of Time-Critical and Compliance-Sensitive Production | +0.7% | North America, Western Europe, and Middle East and Africa, including Egypt, Morocco, and Turkey | Short term (≤ 2 years) |
| Carbon-Credit Monetization for Lower-Impact Materials | +0.5% | Asia-Pacific, including India, and global cotton and man-made fiber belts | Long term (≥ 4 years) |
| Source: Mordor Intelligence | |||
Demand for Technical and Performance Textiles
Technical requirements in construction, mobility, health care, and defense are separating performance materials from fabric production commodities. These applications demand defined mechanical, barrier, filtration, flame-resistance, or durability properties that commodity fabrics cannot reliably meet. India’s National Technical Textiles Mission had an outlay of INR 1,480 crore (USD 169.86 million) through fiscal year 2025-26 and funded 168 research projects.[1] The program was associated with a 15% increase in Indian technical textile exports during fiscal year 2024-25. India’s technical textile exports rose from INR 8,827 crore (USD 1,013.05 million) to INR 28,392 crore (USD 3,258.47 million) over the decade ending in fiscal year 2024-25. In fiscal year 2025-26, the segment recorded an INR 3,420 crore (USD 392.5 million) trade surplus, which supports continued investment in qualified capacity.
Expansion of Recycled and Bio-Based Fiber Capacity
Recycled and bio-based materials are becoming more relevant to buyer qualification and product development. Textile Exchange reported 12% annual growth in its certifications during 2025 across more than 100,000 sites.[2] The certifications include the Global Recycled Standard and the Recycled Claim Standard. Indorama Ventures Fibers and Jiaren Chemical Recycling formed a joint venture in November 2025 with a target of up to 100,000 tonnes per year of textile-recycled PET spinning capacity. The European Union’s separate collection requirement for textile waste, effective from January 2025, expands the potential post-consumer feedstock stream for recyclers.[3] For suppliers in the textile manufacturing market, fiber origin is therefore increasingly relevant to buyer qualification and export market access, in addition to raw material cost management.
Digitalization of Textile Design and Production
Digitalization now reaches design, sampling, factory operations, quality control, and traceability. Virtual sampling can reduce the need for physical iterations before production begins. Sensor systems and computer vision help mills identify equipment and fabric issues during production. A VDMA and Gherzi position paper stated that artificial intelligence-supported sensor monitoring can reduce machinery downtime by up to 40%. The same paper stated that automated computer vision can reach up to 99.3% accuracy in fabric defect detection. Textile ETP’s (European Technology Platform for the Future of Textiles and Clothing) 2026 strategy calls for a European Textile Data Space with more than 500 active participants by 2030. Digital twins and integrated manufacturing platforms can further connect machine data with production planning, enabling manufacturers to simulate process changes, optimize machine utilization, and identify bottlenecks before they affect output. Predictive analytics can also support condition-based maintenance by using real-time equipment data to identify abnormal operating patterns and schedule interventions before failures occur. At the supply-chain level, digital product records and material-traceability systems can improve visibility of fiber origin, processing stages, chemical use, and product movement, supporting compliance with emerging sustainability and product-transparency requirements. These capabilities are particularly relevant as textile manufacturers face increasing pressure to improve productivity, reduce waste, and provide verifiable production and sustainability data to international buyers.
Regulatory Push for Product Traceability and Circularity
Regulatory requirements are making product data part of normal manufacturing practice. The European Union’s Ecodesign for Sustainable Products Regulation establishes a framework for Digital Product Passports. The Digital Product Passport registry became operational in July 2026. Larger companies placing textiles on the European Union market will need production and product data that can support future passport requirements. The information systems used to improve yields and quality can also provide the records needed for traceability. Manufacturers may increasingly need to capture standardized information on fiber composition, recycled content, processing stages, chemical use, and product durability across multiple production steps. This increases the importance of interoperable systems that can exchange data between mills, garment manufacturers, suppliers, brands, and compliance platforms rather than keeping production information in isolated systems. Smaller manufacturers may face higher implementation costs because they often lack dedicated data-management teams and integrated enterprise systems. Over time, however, the same data infrastructure can support production optimization, quality assurance, inventory management, and customer reporting, allowing compliance-related investments to generate operational benefits beyond regulatory requirements. This makes compliance investment more closely connected to operating efficiency in the textile manufacturing market.
Restraints Impact Analysis of Textile Manufacturing Market*
| Restraint | (~) % Impact on CAGR Forecast | Geographic Relevance | Impact Timeline |
|---|---|---|---|
| Volatile Fiber, Energy, and Logistics Costs | -0.90% | Global, with greatest exposure in South and Southeast Asia and the Middle East | Short term (≤ 2 years) |
| Water, Wastewater, and Chemical Compliance Burden | -0.50% | Asia-Pacific production centers and global export hubs | Long term (≥ 4 years) |
| Microfiber Shedding and PFAS Restrictions | -0.40% | European Union, with enforcement spillover to North America and key export markets | Medium term (2-4 years) |
| Fragmented Supplier Base and Uneven Manufacturing Digitization | -0.30% | Global, with strongest effect in South Asia and Sub-Saharan Africa | Long term (≥ 4 years) |
| Source: Mordor Intelligence | |||
Volatile Fiber, Energy, and Logistics Costs
Fiber, energy, and freight costs can change more quickly than the selling prices set in buyer contracts. Cotton prices are affected by agricultural conditions, weather events, and climate variability, while polyester and other synthetic inputs respond to crude oil and naphtha costs. This leaves blended-fiber producers exposed to multiple and sometimes independent sources of input volatility. Energy and freight costs can further amplify margin pressure when production is concentrated in energy-intensive processes or when export routes experience higher logistics costs. Manufacturers with stronger contract terms, hedging practices, inventory planning, or dual-fiber sourcing have greater ability to protect margins against short-term cost increases. Exposure is highest among factories that rely on spot purchases, operate with limited working-capital buffers, or have limited ability to pass higher input costs through to buyers. This creates greater margin volatility for smaller and less integrated manufacturers, particularly when buyer contracts fix prices for extended production cycles.
Water, Wastewater, and Chemical Compliance Burden
Dyeing, printing, and finishing create wastewater that requires treatment before discharge. China issued its revised Textile Industry Water Pollutant Discharge Standard, GB 4287-2026, in June 2026: the standard addresses chemical oxygen demand, suspended solids, heavy metals, and color-related parameters. The European Union also adopted a PFHxA restriction under Regulation (EU) 2024/2462, increasing compliance obligations for certain textile applications. Closed-loop treatment systems require substantial capital and may be difficult for smaller factories to finance. This creates a market-access advantage for manufacturers that can document wastewater and chemical compliance. Microfiber shedding and restrictions on certain fluorinated substances add further pressure to product and process design. These requirements are most important for producers supplying regulated export markets. They can lead mills to revise chemical selections, finishing methods, and testing procedures. Fragmented supplier networks also make common data standards more difficult to implement. Uneven factory digitalization can slow the collection of traceability records. These conditions can widen the gap between well-capitalized mills and smaller textile manufacturing market suppliers.
*Our forecasts treat driver/restraint impacts as directional, not additive. The impact forecasts reflect baseline growth, mix effects, and variable interactions.
Textile Manufacturing Market Segment Analysis
By Raw Material:
Synthetics Dominate While Specialty Fibers Grow FasterCommodity synthetics held 54% of raw material revenue in 2025. Polyester benefits from large-scale use in woven and knitted applications. Nylon remains important in performance hosiery, sportswear, and industrial netting. These materials are widely used because they support volume production and consistent processing. Their cost structure, however, remains linked to petrochemical inputs. Energy movements can therefore affect a large part of the textile manufacturing market output.
Specialty and high-performance fibers are forecast to grow at an 8.8% CAGR through 2031. Aramid, ultra-high-molecular-weight polyethylene, carbon-reinforced fibers, and related materials serve applications with defined performance requirements. Defense, aerospace, and infrastructure projects can require strength or protective properties that commodity fibers cannot provide. Natural fibers remain important but are exposed to weather conditions and agricultural price cycles. Artificial cellulosics offer a bridge between natural fiber characteristics and industrial processing. Lenzing’s August 2026 strategy emphasized premium TENCEL, ECOVERO, and VEOCEL products while reducing exposure to standard viscose.

By Manufacturing Process and Product Type:
Finishing Gains Importance Through Function and ComplianceFabric manufacturing accounted for 48.4% of revenue in 2025. Weaving remains central to shirting, denim, and technical fabric demand. Knitting supports stretch, seamless construction, and sportswear applications. Nonwoven production is relevant to medical, filtration, and geotextile products. Braiding, tufting, and 3D weaving remain smaller activities with uses in composites and protective applications. These processes keep the textile manufacturing industry connected to a broad range of material requirements.
In the textile manufacturing market, textile finishing and surface treatment are forecast to grow at a 7.6% CAGR through 2031. Pretreatment, bleaching, dyeing, printing, and functional coatings are becoming more important where performance and compliance must be documented. Digital textile printing can reduce water use compared with conventional screen printing. Yarn and thread manufacturing remains a high-volume process across the textile manufacturing market. Vardhman Textiles’ fiscal year 2025 capital program included 17,000 additional spindles and 31 million meters per year of processed fabric capacity.
By End Use Industry:
Apparel Retains Volume While Technical Uses Add ValueApparel and fashion held 56.1% of end-use demand in 2025. This category remains the principal volume outlet for many woven and knitted fabrics. Its suppliers face strong price pressure and shifting order patterns. Home and household textiles provide demand for bed, bath, upholstery, and floor-covering materials. Other uses include sports, leisure, and institutional applications. These demand areas keep the textile manufacturing industry tied to consumer spending and housing activity.
Technical and industrial textiles are projected to grow at a 6.2% CAGR through 2031. The category includes materials for airbags, seat fabrics, tire cord, surgical nonwovens, filtration, geotextiles, crop covers, protective clothing, and packaging. These applications often rely on longer qualification periods and defined performance standards. Arvind Advanced Materials acquired a 61% stake in Dalco-GFT in May 2026, adding a United States nonwoven manufacturing position across automotive, geotextile, industrial, and furniture applications. India’s 2026 budget included Mega Textile Parks with a focus on technical textile capacity.
By Enterprise Scale:
Smaller Producers Lead Revenue While Organized Mills Grow FasterMicro, small, and medium enterprises and the unorganized sector accounted for 60% of revenue in 2025. The result reflects a labor-intensive production base across spinning, weaving, dyeing, and finishing. This structure is especially visible in South Asia and Sub-Saharan Africa. A small export-grade knit mill and an informal handloom unit may both fall within the MSME category, yet differ substantially in automation capability, audit readiness, and export market access. Their automation capacity, audit readiness, and export access can differ substantially. This diversity makes the textile manufacturing market difficult to assess through enterprise size alone.
Large organized manufacturers are forecast to grow at a 5.8% CAGR through 2031. They can spread the cost of automation, digital systems, and environmental infrastructure across larger output volumes. They also have more capacity to meet buyer audits and traceability expectations. Indorama Ventures’ 2026 roadmap focuses on structural cost leadership, portfolio rationalization, and deeper digital integration. Compliance thresholds can create step changes when producers seek export certifications or respond to buyer audits. These events can support consolidation within selected textile manufacturing market product categories.
Geography Analysis
APAC Textile Manufacturing Market
Asia-Pacific held 54.5% of global output in 2025. China has integrated fiber-to-fabric capability across natural and synthetic materials. India, Bangladesh, Vietnam, and Indonesia add spinning, knitting, weaving, and apparel-linked intermediate capacity. India’s policy focus includes an export target of USD 100 billion by 2030. Japan and South Korea hold specialized positions in functional fibers and precision weaving. The region remains central to the textile manufacturing market even as buyers diversify sourcing.
EMEA Textile Manufacturing Market
The Middle East and Africa are forecast to grow at a 5.8% CAGR through 2031. Egypt is attracting integrated capacity that can serve regional and European demand. A USD 350 million spinning and textile complex was announced for New October City in January 2026. Morocco is also developing capacity for European proximity sourcing. Turkey continues to function as a production hub and a link to European compliance standards. These investments can support regional fiber, fabric, and finishing supply chains.
Europe and the Americas Textile Manufacturing Market
Europe has a lower production volume but a substantial influence over compliance requirements. The Ecodesign for Sustainable Products Regulation and Digital Product Passport framework affect exporters selling into the European Union. Italy, Germany, and the Nordic countries retain specialized positions in technical textiles, finishing chemistry, and textile machinery. North American production is smaller than consumption, while Mexico and Central America can benefit from nearshoring. Brazil has a broad cotton-to-fabric base, and Argentina contributes wool and specialty natural fiber processing. This geographic redistribution creates demand for water treatment, energy efficiency, technical skills, and reliable compliance systems across the textile manufacturing market.
Competitive Landscape
The textile manufacturing market exhibits a low level of market concentration across many product categories and processing stages. Texhong International, Weiqiao Pioneering Group, and Indorama Ventures are active in high-volume yarn and polyester fiber supply. Toray Industries, Hyosung TNC, and Lenzing focus on differentiated materials and higher-value applications. This distinction leaves commodity suppliers more exposed to energy costs and scale competition. Specialty suppliers rely more on product performance, process capability, and branded material positions.
Lenzing is accelerating a strategy centered on premium nonwovens and branded cellulosic fibers. Hyosung TNC announced capacity expansion for personal hygiene spandex at its Brazil facility in July 2026. Coats and Tajima signed a strategic cooperation agreement in July 2026 that combines thread products with digital embroidery and software capabilities. These actions show how established producers are pairing material capability with application expertise or digital tools. Manufacturers that pair material capability with application expertise or digital tools are better positioned to retain key buyers and command premium pricing.
Textile-to-textile recycling remains constrained by feedstock collection, sorting, and verified output requirements. Mills increasingly require integrated systems for product data management, real-time quality monitoring, and demand planning. Certified technical textile capacity in the Middle East, Africa, and Latin America remains less developed than the demand opportunities in those regions. Arvind’s investment in Dalco-GFT adds a direct position in United States nonwovens. Indorama’s joint venture with Jiaren targets textile-recycled PET spinning capacity.
Textile Manufacturing Industry Leaders
-
Texhong International Group Limited
-
Jiangsu Sanfame Polyester Material Co., Ltd.
-
Billion Industrial Holdings Limited
-
Coats Group plc
-
Zhejiang Hangmin Co., Ltd.
- *Disclaimer: Major Players sorted in no particular order
Textile Manufacturing Market Companies Covered in this Report
- Texhong International Group Limited
- Jiangsu Sanfame Polyester Material Co., Ltd.
- Billion Industrial Holdings Limited
- Coats Group plc
- Zhejiang Hangmin Co., Ltd.
- Bros Eastern, Ltd.
- Eclat Textile Co., Ltd.
- Huafu Fashion Co., Ltd.
- Vardhman Textiles Limited
- Toray Industries, Inc.
- Far Eastern New Century Corporation
- Weiqiao Pioneering Group Co., Ltd.
- Reliance Industries Limited
- Indorama Ventures Public Company Limited
- Lenzing AG
- Hyosung TNC Corporation
- Arvind Limited
- Welspun Living Limited
- Unifi, Inc.
- Freudenberg SE
Recent Industry Developments in Textile Manufacturing Market
- July 2026: Coats Group and Tajima Industries signed a Memorandum of Strategic Cooperation combining Coats’ thread innovation and 100% recycled polyester thread capabilities with Tajima’s Intelligent Thread Management, DCP digital embroidery platforms, and PulseID software to improve productivity and quality at scale.
- May 2026: Arvind Advanced Materials acquired 61% of Dalco-GFT, a United States nonwovens manufacturer serving automotive, geotextile, industrial, and furniture markets.
- November 2025: Indorama Ventures Fibers and Jiaren Chemical Recycling established a joint venture targeting up to 100,000 tonnes per year of textile-recycled PET spinning capacity.
Global Textile Manufacturing Market Report Scope
The Textile Manufacturing Market is Segmented by Raw Material (Natural Fibers, Commodity Synthetics, and More), by Manufacturing Process and Product Type (Fabric Manufacturing, and More), by End Use Industry (Apparel and Fashion, and More), by Enterprise Scale (Large Organized Manufacturers, and More), and by Geography (North America, and More). The Report Offers Market Size and Value (USD) Forecasts for all the Above Segments.
| Natural Fibers | Plant-Based Fibers |
| Animal-Based Fibers (Wool, Silk and Other Animal Fibers) | |
| Man-Made Cellulosic Fibers (Viscose/Rayon, Lyocell, Modal, and Acetate) | |
| Commodity Synthetics (Polyester, Nylon/Polyamide, Polypropylene, Acrylic and Elastane) | |
| Specialty and High-Performance Fibers (Aramid, UHMWPE, etc.) |
| Yarn and Thread Manufacturing | |
| Fabric Manufacturing | Weaving |
| Knitting and Crocheting | |
| Nonwoven and Felt Manufacturing | |
| Other Fabric-Formation Processes | |
| Textile Finishing and Surface Treatment (Pretreatment, Bleaching, Dyeing, Printing, etc.) |
| Apparel and Fashion | |
| Home and Household Textiles | |
| Technical and Industrial Textiles | Transportation and Mobility |
| Medical and Hygiene | |
| Industrial Processing and Filtration | |
| Construction and Geotextiles | |
| Protective and Safety | |
| Packaging | |
| Other Technical Applications - Agriculture, etc. |
| Large Organized Manufacturers |
| Micro, Small, and Medium Enterprises (MSMEs) and the unorganized sector |
| North America | United States |
| Canada | |
| Mexico | |
| South America | Brazil |
| Argentina | |
| Rest of South America | |
| Europe | Germany |
| Italy | |
| United Kingdom | |
| France | |
| Spain | |
| BENELUX (Belgium, Netherlands, and Luxembourg) | |
| NORDICS (Denmark, Finland, Iceland, Norway, and Sweden) | |
| Rest of Europe | |
| Asia-Pacific | China |
| India | |
| Japan | |
| South Korea | |
| Bangladesh | |
| ASEAN (Indonesia, Thailand, Philippines, Malaysia, Vietnam) | |
| Rest of Asia-Pacific | |
| Middle East and Africa | Saudi Arabia |
| United Arab Emirates | |
| Qatar | |
| Kuwait | |
| Turkey | |
| Egypt | |
| South Africa | |
| Nigeria | |
| Rest of Middle East and Africa |
| By Raw Material | Natural Fibers | Plant-Based Fibers |
| Animal-Based Fibers (Wool, Silk and Other Animal Fibers) | ||
| Man-Made Cellulosic Fibers (Viscose/Rayon, Lyocell, Modal, and Acetate) | ||
| Commodity Synthetics (Polyester, Nylon/Polyamide, Polypropylene, Acrylic and Elastane) | ||
| Specialty and High-Performance Fibers (Aramid, UHMWPE, etc.) | ||
| By Manufacturing Process and Product Type | Yarn and Thread Manufacturing | |
| Fabric Manufacturing | Weaving | |
| Knitting and Crocheting | ||
| Nonwoven and Felt Manufacturing | ||
| Other Fabric-Formation Processes | ||
| Textile Finishing and Surface Treatment (Pretreatment, Bleaching, Dyeing, Printing, etc.) | ||
| By End Use Industry | Apparel and Fashion | |
| Home and Household Textiles | ||
| Technical and Industrial Textiles | Transportation and Mobility | |
| Medical and Hygiene | ||
| Industrial Processing and Filtration | ||
| Construction and Geotextiles | ||
| Protective and Safety | ||
| Packaging | ||
| Other Technical Applications - Agriculture, etc. | ||
| By Enterprise Scale | Large Organized Manufacturers | |
| Micro, Small, and Medium Enterprises (MSMEs) and the unorganized sector | ||
| By Geography | North America | United States |
| Canada | ||
| Mexico | ||
| South America | Brazil | |
| Argentina | ||
| Rest of South America | ||
| Europe | Germany | |
| Italy | ||
| United Kingdom | ||
| France | ||
| Spain | ||
| BENELUX (Belgium, Netherlands, and Luxembourg) | ||
| NORDICS (Denmark, Finland, Iceland, Norway, and Sweden) | ||
| Rest of Europe | ||
| Asia-Pacific | China | |
| India | ||
| Japan | ||
| South Korea | ||
| Bangladesh | ||
| ASEAN (Indonesia, Thailand, Philippines, Malaysia, Vietnam) | ||
| Rest of Asia-Pacific | ||
| Middle East and Africa | Saudi Arabia | |
| United Arab Emirates | ||
| Qatar | ||
| Kuwait | ||
| Turkey | ||
| Egypt | ||
| South Africa | ||
| Nigeria | ||
| Rest of Middle East and Africa | ||
Key Questions Answered in the Report
What is the projected growth rate for textile manufacturing through 2031?
The textile manufacturing market is projected to grow at a 4.9% CAGR from 2026 to 2031, reaching USD 343.8 billion by 2031.
Which raw materials are growing fastest in textile production?
In the textile manufacturing market, specialty and high-performance fibers are projected to grow at an 8.8% CAGR through 2031, supported by defense, aerospace, infrastructure, and protective applications.
Why are technical textiles important to manufacturers?
Technical and industrial textiles are forecast to grow at a 6.2% CAGR because buyers require defined performance, testing, and compliance standards.
Which production process has the strongest forecast growth?
In the textile manufacturing market, textile finishing and surface treatment are forecast to grow at a 7.6% CAGR through 2031 as functional performance and chemical compliance become more important.
Which region leads global textile output?
Asia-Pacific held 54.5% of global output in 2025, supported by integrated capacity in China and expanding production in India, Bangladesh, Vietnam, and Indonesia.
How are traceability rules changing textile production?
Across the textile manufacturing market, Digital Product Passport requirements and related rules encourage manufacturers to collect product and process data, strengthening the role of digital systems and auditable compliance.