Testing And Analysis Services Market Size and Share
Market Overview
| Study Period | 2020 - 2031 |
|---|---|
| Market Size (2026) | USD 40.19 Billion |
| Market Size (2031) | USD 54.92 Billion |
| Growth Rate (2026 - 2031) | 6.44% CAGR |
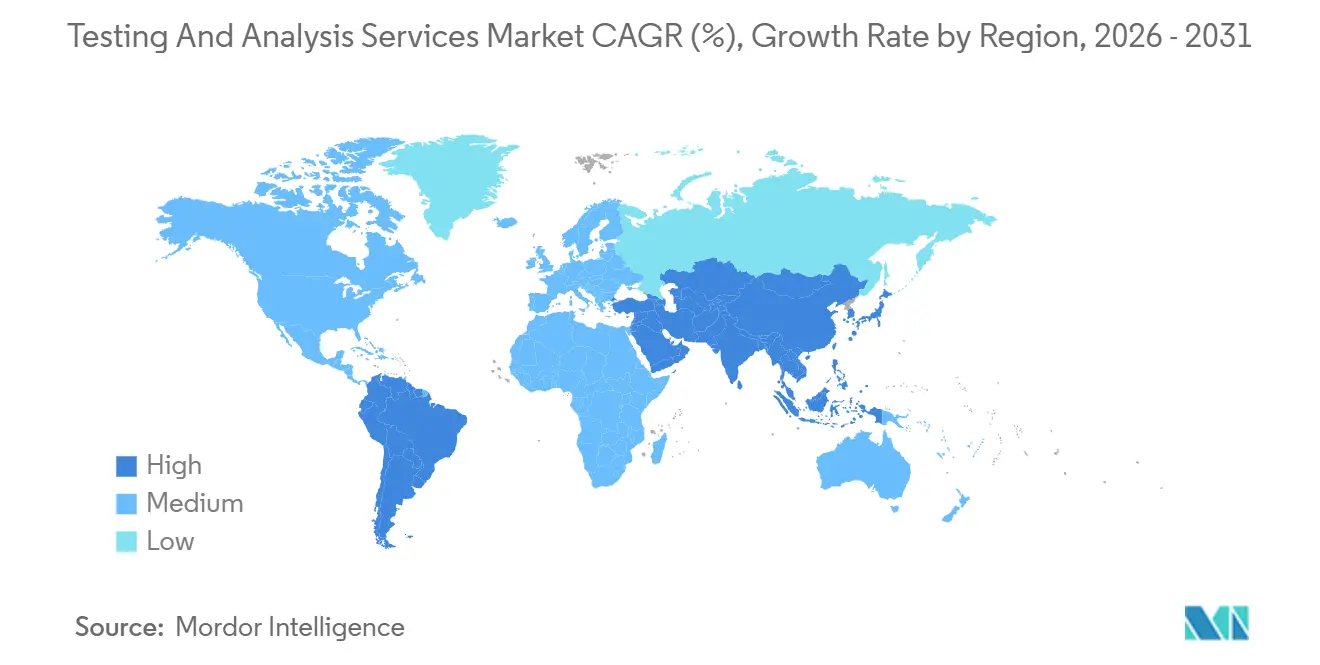
| Fastest Growing Market | Asia Pacific |
| Largest Market | North America |
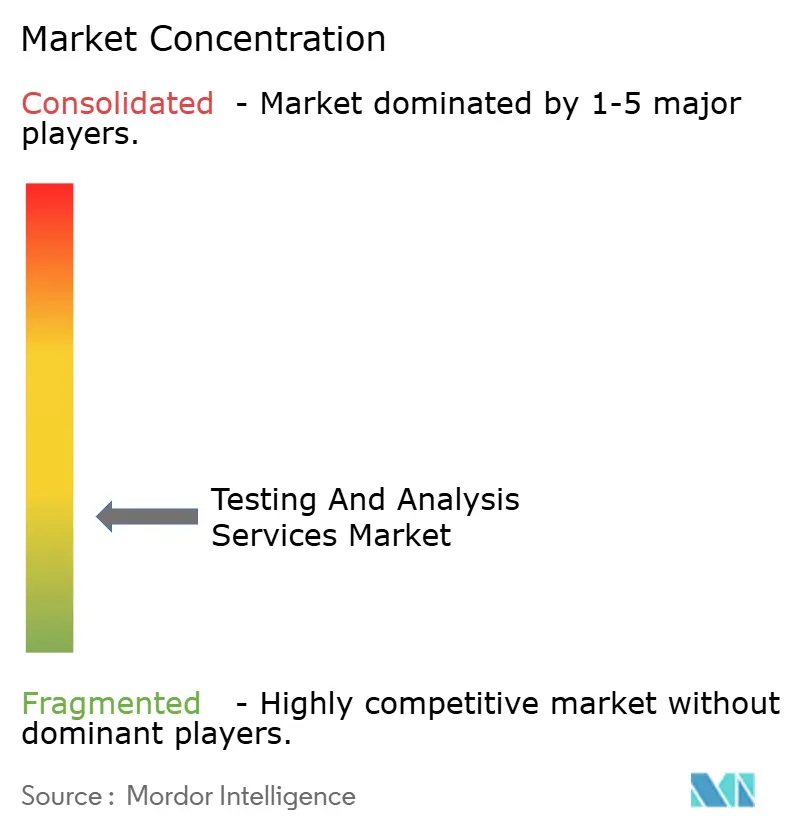
| Market Concentration | Low |
Major Players *Disclaimer: Major Players sorted in no particular order Image © Mordor Intelligence. Reuse requires attribution under CC BY 4.0. | |
Testing And Analysis Services Market Analysis by Mordor Intelligence
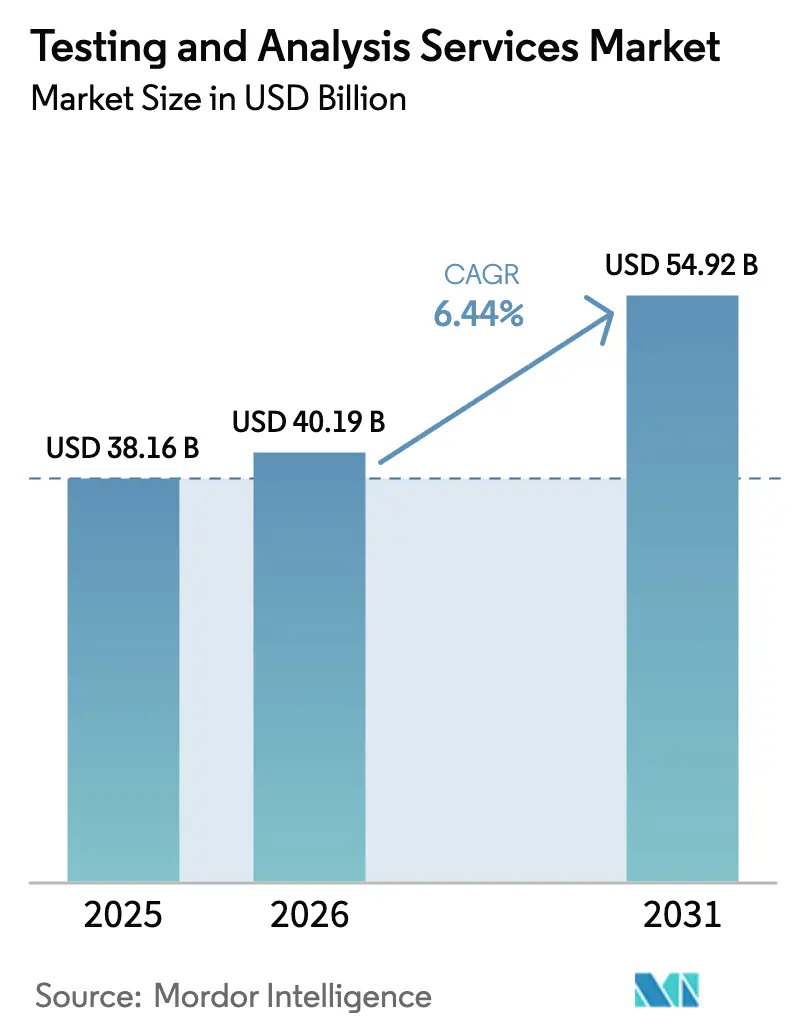
The Testing And Analysis Services Market size is expected to increase from USD 38.16 billion in 2025 to USD 40.19 billion in 2026 and reach USD 54.92 billion by 2031, growing at a CAGR of 6.44% over 2026-2031.
A converging mix of tighter global regulations, electrification-driven mineral prospecting, and decentralized testing infrastructure is reshaping demand beyond the traditional pharmaceutical and food-safety core. Stand-alone laboratories still anchor revenue, yet hospital-based facilities are expanding rapidly as health systems weave integrated diagnostics into clinical care. Chromatography remains the workhorse technique, but bioassay and immunoassay demand is accelerating on the back of biologics and vaccine pipelines. Regional growth is tilting toward Asia-Pacific where India and China are scaling laboratory networks, while North America maintains a regulatory edge rooted in rigorous FDA and EPA oversight.
Key Report Takeaways
- By service provider, stand-alone laboratories held 39.42% of the testing and analysis services market share in 2025, whereas hospital-based facilities are forecast to grow at an 8.82% CAGR through 2031.
- By test technique, chromatography led with 31.55% revenue share in 2025; bioassay and immunoassay methods are projected to expand at a 9.64% CAGR to 2031.
- By sample type, biological matrices contributed 24.64% of 2025 volumes; clay minerals are on track to grow at an 8.24% CAGR between 2026-2031.
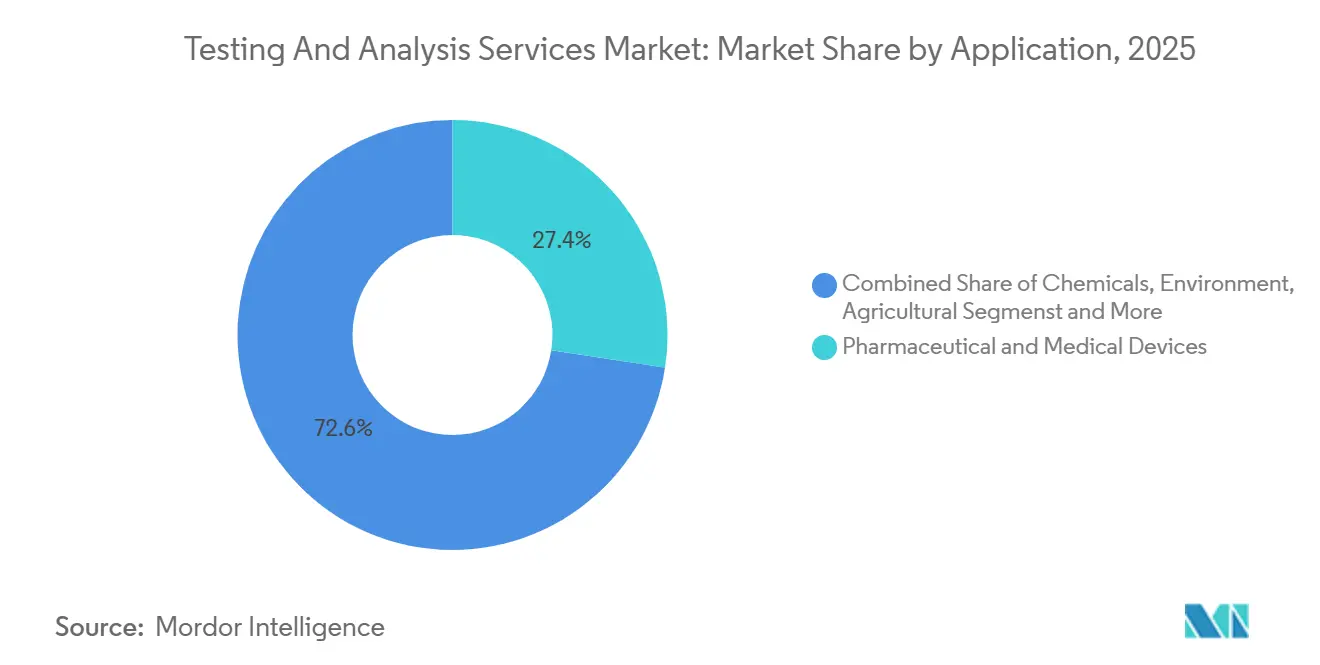
- By application, pharmaceutical and medical-device testing represented 27.42% of 2025 revenue; agricultural testing is set to rise at a 10.01% CAGR to 2031.
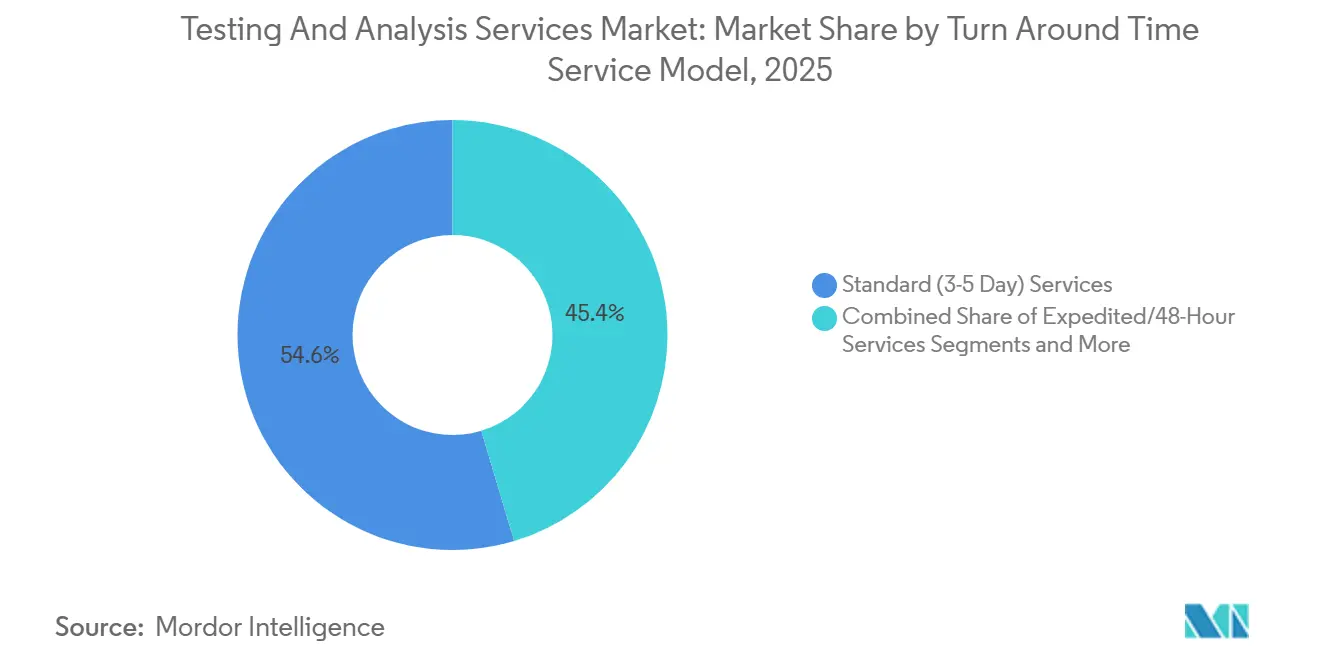
- By service model, standard three-to-five-day contracts captured 54.63% of 2025 revenue, and on-site or mobile laboratories are projected to post a 10.51% CAGR through 2031.
- By geography, North America accounted for 33.11% of 2025 revenue, while Asia-Pacific is advancing at an 8.83% CAGR through 2031.
Note: Market size and forecast figures in this report are generated using Mordor Intelligence’s proprietary estimation framework, updated with the latest available data and insights as of January 2026.
Global Testing And Analysis Services Market Trends and Insights
Drivers Impact Analysis*
| Driver | (~) % Impact on CAGR Forecast | Geographic Relevance | Impact Timeline |
|---|---|---|---|
| Stringent Global Regulations in Food, Pharma & Environment | 1.4% | Global, with peak enforcement in North America, EU, and APAC (India, China) | Medium term (2–4 years) |
| Surging Pharma-Biotech R&D Outlay | 1.2% | North America & Europe, spillover to APAC contract-research hubs (India, South Korea) | Short term (≤ 2 years) |
| Growing Environmental-Monitoring Mandates | 1.1% | Global, concentrated in North America (PFAS), EU (Green Deal), China (air quality) | Long term (≥ 4 years) |
| Expansion of Cross-Border Trade & Quality Certification | 0.9% | Global, with emphasis on APAC export corridors and Middle East food imports | Medium term (2–4 years) |
| Decentralized Microfluidic/Portable Testing Adoption | 0.8% | APAC and Africa for point-of-care diagnostics; North America for field environmental sampling | Long term (≥ 4 years) |
| Battery-Mineral Exploration Boom Boosting Geochemical Assays | 1.0% | APAC (lithium triangle: Australia, Chile, Argentina), North America (domestic supply chains) | Medium term (2–4 years) |
| Source: Mordor Intelligence | |||
Stringent Global Regulations In Food, Pharma & Environment
Tighter rules across food safety, drug approvals, and pollution control are compressing product-launch timelines and elevating analytical-validation standards. The FDA’s 2024 guidance on elemental impurities now requires inductively coupled plasma mass spectrometry for 24 elements, rendering older atomic-absorption methods obsolete.[1]U.S. Food and Drug Administration, “Control of Elemental Impurities,” U.S. Food and Drug Administration, fda.gov Europe’s Farm-to-Fork framework widened maximum-residue testing to more than 500 pesticide compounds, a move that only high-capacity laboratories can handle efficiently.[2]European Food Safety Authority, “Pesticide Residue Monitoring Report 2025,” European Food Safety Authority, efsa.europa.eu India’s FSSAI plans to add 1,000 accredited food laboratories by 2028, signaling public-private opportunities. China mandated quarterly third-party emissions audits for industrial parks beginning September 2024, effectively doubling environmental testing demand in Tier 2 and Tier 3 cities. The cumulative effect favors operators with broad accreditation portfolios and capital reserves for rapid method validation.
Surging Pharma-Biotech R&D Outlay
Global R&D spending by drug makers hit USD 244 billion in 2024, and sponsors outsourced 38% of analytical budgets to external labs. Biologics pipelines are driving growth in bioassay and immunoassay work, which posted a 9.64% CAGR through 2031. Major firms such as Pfizer raised external lab spend by more than 20% in 2024 to accelerate oncology and rare-disease programs. India’s contract-research hubs earned USD 3.2 billion from testing in 2024, leveraging cost advantages and proximity to active-pharmaceutical-ingredient clusters. Laboratories offering regulatory-affairs support and electronic data integration are capturing premium prices, while commodity assay providers face margin pressure.
Growing Environmental Monitoring Mandates
The EPA’s October 2024 rule capped PFAS in drinking water at parts-per-trillion thresholds, creating an estimated USD 1.8 billion in annual testing demand.[3]U.S. Environmental Protection Agency, “PFAS National Primary Drinking Water Regulation,” U.S. Environmental Protection Agency, epa.gov Europe expanded continuous emissions monitoring to 15,000 additional facilities under its Industrial Emissions Directive, straining regional laboratory capacity. China committed RMB 120 billion to air, water, and soil monitoring through 2025, stipulating ISO/IEC 17025 accreditation for service providers. Australia introduced soil PFAS thresholds in mid-2024, boosting geochemical and hydrogeological assays. These mandates shift environmental surveillance from periodic checks to continuous, data-heavy operations, rewarding labs that automate sample preparation and cloud-based reporting.
Expansion of Cross-Border Trade & Quality Certification
Merchandise trade reached USD 25.3 trillion in 2024, with regulated goods—food, pharmaceuticals, chemicals—making up more than a quarter. The African Continental Free Trade Area harmonized conformity rules yet still requires re-testing at destination markets, doubling lab work for exporters. Saudi Arabia’s pre-shipment program now demands certificates of analysis from ISO 17025 labs in the country of origin, inflating Middle-East testing volumes.. Pending U.S.-EU mutual-recognition talks could eventually compress duplicate testing, raising the bar for labs with transatlantic accreditations. Multi-site networks are best positioned to arbitrage these regulatory asymmetries.
Restraints Impact Analysis*
| Restraint | (~) % Impact on CAGR Forecast | Geographic Relevance | Impact Timeline |
|---|---|---|---|
| High Cap-Ex & Opex of Advanced Analytical Instruments | -0.7% | Global, acute in APAC and Africa where capital access is constrained | Short term (≤ 2 years) |
| Shortage of Skilled Analytical Chemists & Lab Technicians | -0.6% | North America, Europe, and APAC (India, China) facing talent gaps | Medium term (2–4 years) |
| Increasing Data-Integrity Audit Failures for Outsource Labs | -0.4% | Global, concentrated in contract-research hubs (India, China, Eastern Europe) | Short term (≤ 2 years) |
| Digital Cheminformatics Models Cannibalizing Routine Tests | -0.5% | North America and Europe, where computational infrastructure is mature | Long term (≥ 4 years) |
| Source: Mordor Intelligence | |||
High Cap-Ex & Opex Of Advanced Analytical Instruments
Top-tier mass spectrometers and NMR systems can cost up to USD 3 million each, with annual service contracts consuming up to 12% of purchase price. Producer-price inflation for analytical equipment rose 6.2% year-over-year in 2024, outpacing general lab-equipment costs. Pay-per-sample leasing eases cash flow yet cuts gross margins by up to 20% compared with outright ownership. One-third of European clinical laboratories delayed upgrades in 2024 due to higher interest rates, despite rising sample volumes. Capital intensity entrenches scale advantages for global networks while constraining regional specialists.
Shortage Of Skilled Analytical Chemists & Lab Technicians
Demand for chemical technicians is growing faster than graduation rates, widening structural labor gaps. U.S. chemistry degree completions fell 11% between 2019-2023 even as employer demand climbed. Median pay for mid-career analytical chemists rose 9.3% in 2024 to USD 87,400, reflecting intensified hiring competition. India faces a shortfall of 42,000 lab technicians, driven by limited vocational capacity and overseas migration. Germany’s apprenticeship enrollments for lab assistants dropped 18% over five years, prompting calls for immigration reform. Laboratories must choose between wage inflation and automation, a trade-off that strains smaller operators.
*Our forecasts treat driver/restraint impacts as directional, not additive. The impact forecasts reflect baseline growth, mix effects, and variable interactions.
Segment Analysis
By Sample Type: Biological Matrices Remain Core While Clay Minerals Accelerate
Biological samples accounted for 24.64% of 2025 test volumes, underscoring pharmaceutical bioanalysis and clinical diagnostics. This slice of the testing and analysis services market delivered stable revenue but faces price pressure as hospital labs automate high-volume assays. Clay minerals captured only a mid-single-digit share but are forecast to grow at an 8.24% CAGR, mirroring the battery-grade lithium boom. The segment’s upswing is anchored by assays such as X-ray diffraction and inductively coupled plasma optical emission spectrometry, which optimize extraction routes for complex mineralogy.
Rising demand for lithium-bearing clays in Nevada and North Carolina requires 30% more analytical runs per ton of ore than brine or hard-rock sources, lifting the testing and analysis services market size for this niche. Meanwhile, water and soil testing benefit from PFAS rules but operate at lower price points. Metal-alloy testing supports aerospace and additive manufacturing, while chemical-product assays underpin REACH and TSCA filings. Collectively, diversified sample streams create a balanced volume pipeline that shelters providers from single-sector cyclicality.


By Test Technique: Chromatography Leads Yet Bioassays Gain Momentum
Chromatography held 31.55% of 2025 revenue, giving the method the largest testing and analysis services market share among techniques. Its ubiquity spans impurity profiling, pesticide residue screening, and trace pollutant quantification. Bioassay and immunoassay workflows are growing fastest at a 9.64% CAGR as regulators replace animal potency studies with cell-based alternatives in biologics lot release. This trend expands the testing and analysis services market size for high-complexity, higher-margin assays tied to monoclonal antibodies and mRNA vaccines.
Spectroscopy and mass-spectrometry methods underpin structure elucidation and ultra-trace detection, yet their capital intensity limits penetration beyond top-tier labs. Microscopy, imaging, mechanical, and thermal analyses retain critical roles in failure analysis and material qualification, particularly for aerospace and medical-device clients. Vendors are bundling chromatography hardware with data-analysis software to offset commoditization, shifting the value proposition from instrument sales to workflow optimization.
By Turn-Around Time Service Model: Standard Contracts Dominate As Mobile Labs Gain Field Traction
Standard three-to-five-day services accounted for 54.63% of 2025 revenue, anchoring the testing and analysis services market with predictable batch workflows. Expedited 48-hour contracts and on-site or mobile laboratories are rising faster, with the latter clocking a 10.51% CAGR through 2031. Mining clients value four-hour field assays that guide drilling vectors in real time, while decentralized clinical trials rely on mobile stability chambers to cut patient dropout.
Continuous monitoring contracts deliver steady cash flow but demand upfront investment in automated samplers and telemetry. Regulatory conservatism still ties many GMP and food-safety protocols to centralized labs, yet hybrid models blending field screening with reference confirmation are proliferating. Providers that scale mobile capacity without compromising accreditation stand to widen their competitive moat.
By Service Provider: Stand-Alone Networks Lead As Hospitals Internalize Diagnostics
Stand-alone laboratories secured 39.42% of 2025 revenue, leveraging multi-site footprints and broad ISO 17025 scopes to serve regulated industries. Hospital-based labs, however, are expanding at an 8.82% CAGR as integrated delivery networks in the United States invest in companion-diagnostic and pharmacogenomic capabilities. This migration reshapes the testing and analysis services market by moving esoteric assays in-house, reducing reference-lab volumes for routine clinical panels.
Clinic-based labs occupy a shrinking niche between hospital integration and point-of-care devices. Independent providers retain advantages in pharmaceutical, environmental, and food sectors where extensive accreditation and method validation are mandatory. Yet they must navigate rising wage costs and instrument inflation to maintain margin integrity.
By Application: Pharma Anchors Revenue As Agriculture Emerges Fastest
Pharmaceutical and medical-device testing generated 27.42% of 2025 revenue, underscoring the sector’s reliance on external laboratories for stability, impurity, and biocompatibility studies. Agricultural testing is poised for the fastest expansion at a 10.01% CAGR through 2031, propelled by stricter pesticide-residue surveillance and soil-microbiome profiling. This momentum enlarges the testing and analysis services market size within agriscience, a segment historically underserved by high-complexity laboratories.
Food and beverage testing remains volume-heavy but price-sensitive, while chemical and environmental assays benefit from REACH expansion and PFAS regulation. The resulting application spread diversifies revenue, cushioning laboratories against sector-specific downturns and aligning services with global sustainability priorities.
Geography Analysis
North America commanded 33.11% of 2025 revenue, bolstered by FDA pre-market scrutiny and EPA PFAS rules. European demand is steady under REACH and the Green Deal, though Brexit forces British drug makers to duplicate assays in EU27 labs. Asia-Pacific is outpacing all regions at an 8.83% CAGR, driven by India’s FSSAI lab-expansion plan, China’s air-quality audits, and booming contract-research hubs in Hyderabad, Shanghai, and Seoul.
Japan’s pharma sector is offshoring stability testing to South Korea and Singapore to trim costs, and Australia’s lithium exploration generated USD 680 million in geochemical assays during 2024. Middle East and Africa markets are emerging; Saudi Arabia’s SFDA pre-shipment rules and South Africa’s mining sector drive pockets of demand, yet accreditation gaps constrain scale. South America leans on Brazil’s agribusiness exports and Chile’s lithium projects, offsetting Argentina’s investment headwinds. Geographic diversification is thus central to sustaining growth amid regulatory fragmentation and labor cost differentials.

Competitive Landscape
Global players such as SGS, Eurofins Scientific, Bureau Veritas, Intertek, and ALS are key players of testing and analysis services market share, leaving material room for regional specialists. Eurofins added 14 sites in 2024 through acquisitions that deepened its food and environmental coverage, raising its global network above 900 locations. SGS rolled out a blockchain-enabled supply chain platform that couples analytical results with certificates of origin, targeting traceability-conscious clients.
Mobile labs and point-of-need devices threaten to unbundle traditional workflows. Shimadzu’s portable mass spectrometers and Mitra’s microsampling kits enable on-site screening, forcing incumbents to offer hybrid models or risk disintermediation. ISO 17025 flexible scopes are becoming a decisive differentiator; Bureau Veritas reports that 78% of its labs can modify methods without fresh accreditation, cutting client onboarding time. Rising data-integrity scrutiny is prompting sponsors to cull vendor rosters, pushing smaller outfits to either invest in 21 CFR Part 11-compliant systems or exit regulated markets.
Testing And Analysis Services Industry Leaders
ALS Limited
Eurofins Scientific
Intertek Group plc
SGS SA
Bureau Veritas SA
- *Disclaimer: Major Players sorted in no particular order

Recent Industry Developments
- January 2026: Uttar Pradesh announced an ASCA laboratory that will deliver end-to-end testing, validation, and certification for medical devices accredited by the FDA, supporting India’s export ambitions.
- January 2026: At MD&M West, Hohenstein Medical unveiled expanded ISO 18562 gas-pathway testing for respiratory devices across −20 °C to 50 °C ranges.
- January 2026: STEMart broadened genetic toxicology services with an in-vivo rat micronucleus test, helping manufacturers meet patient-safety and regulatory requirements.


Global Testing And Analysis Services Market Report Scope
Testing and analysis services involve technical, scientific, or digital procedures used to evaluate the physical, chemical, or functional characteristics of materials, products, and software. These services ensure quality control, safety compliance, and regulatory adherence by testing components against specific standards.
The Testing and Analysis Services Market Report is segmented by Sample Type, Test Technique, Turn-around Time Service Model, Service Provider, Application, and Geography. By Sample Type, the market is segmented into Water, Soil, Sediment, Clay Minerals, Metal Alloy, Biological Sample, Chemical Products, Minerals, and Others. By Test Technique, the market is segmented into Chromatography, Spectroscopy, Microscopy & Imaging, Mechanical & Physical Testing, Thermal Analysis, Bioassay & Immunoassay, and Others. By Turn-around Time Service Model, the market is segmented into Standard 3–5 Day, Expedited 48-Hour, On-Site/Mobile Lab, and Continuous Monitoring. By Service Provider, the market is segmented into Hospital-Based, Stand-Alone, Clinic-Based, and Others. By Application, the market is segmented into Food & Beverages, Pharmaceutical & Medical Devices, Chemicals, Environment, Agricultural, and Others. By Geography, the market is segmented into North America, Europe, Asia-Pacific, Middle East & Africa, and South America. The market report also covers the estimated market sizes and trends for 17 countries across major regions globally. Market Forecasts are Provided in Terms of Value (USD).
| Water |
| Soil |
| Sediment |
| Clay Minerals |
| Metal Alloy |
| Biological Sample |
| Chemical Products |
| Minerals |
| Others |
| Chromatography |
| Spectroscopy |
| Microscopy & Imaging |
| Mechanical & Physical Testing |
| Thermal Analysis |
| Bioassay & Immunoassay |
| Others |
| Standard (3–5 Day) Testing Services |
| Expedited / 48-Hour Services |
| On-Site / Mobile Lab Services |
| Continuous Monitoring Contracts |
| Hospital-Based Laboratories |
| Stand-Alone Laboratories |
| Clinic-Based Laboratories |
| Others |
| Food & Beverages |
| Pharmaceutical & Medical Devices |
| Chemicals |
| Environment |
| Agricultural |
| Others |
| North America | United States |
| Canada | |
| Mexico | |
| Europe | Germany |
| France | |
| United Kingdom | |
| Italy | |
| Spain | |
| Rest of Europe | |
| Asia-Pacific | China |
| Japan | |
| India | |
| South Korea | |
| Australia | |
| Rest of Asia-Pacific | |
| Middle East & Africa | GCC |
| South Africa | |
| Rest of Middle East & Africa | |
| South America | Brazil |
| Argentina | |
| Rest of South America |
| By Sample Type | Water | |
| Soil | ||
| Sediment | ||
| Clay Minerals | ||
| Metal Alloy | ||
| Biological Sample | ||
| Chemical Products | ||
| Minerals | ||
| Others | ||
| By Test Technique / Methodology | Chromatography | |
| Spectroscopy | ||
| Microscopy & Imaging | ||
| Mechanical & Physical Testing | ||
| Thermal Analysis | ||
| Bioassay & Immunoassay | ||
| Others | ||
| By Turn-around Time Service Model | Standard (3–5 Day) Testing Services | |
| Expedited / 48-Hour Services | ||
| On-Site / Mobile Lab Services | ||
| Continuous Monitoring Contracts | ||
| By Service Provider | Hospital-Based Laboratories | |
| Stand-Alone Laboratories | ||
| Clinic-Based Laboratories | ||
| Others | ||
| By Application | Food & Beverages | |
| Pharmaceutical & Medical Devices | ||
| Chemicals | ||
| Environment | ||
| Agricultural | ||
| Others | ||
| By Geography | North America | United States |
| Canada | ||
| Mexico | ||
| Europe | Germany | |
| France | ||
| United Kingdom | ||
| Italy | ||
| Spain | ||
| Rest of Europe | ||
| Asia-Pacific | China | |
| Japan | ||
| India | ||
| South Korea | ||
| Australia | ||
| Rest of Asia-Pacific | ||
| Middle East & Africa | GCC | |
| South Africa | ||
| Rest of Middle East & Africa | ||
| South America | Brazil | |
| Argentina | ||
| Rest of South America | ||


Key Questions Answered in the Report
How large is the testing and analysis services market in 2026?
The market is valued at USD 40.19 billion in 2026 and is projected to reach USD 54.92 billion by 2031.
Which segment holds the highest testing and analysis services market share by technique?
Chromatography leads with a 31.55% share in 2025.
What is the fastest-growing application through 2031?
Agricultural testing is forecast to grow at a 10.01% CAGR.
Why is Asia-Pacific the quickest-expanding region?
Regulatory expansion in India and China, rising contract-research activity, and battery-mineral exploration fuel an 8.83% CAGR.
How are mobile laboratories influencing client demand?
On-site and mobile labs cut turnaround from days to hours, growing at a 10.51% CAGR as mining and decentralized clinical trials prioritize real-time data.
What drives the rise of bioassay and immunoassay techniques?
The shift toward biologics and vaccines requires cell-based potency testing, propelling bioassay and immunoassay methods at a 9.64% CAGR.
Page last updated on:


