Terminal Automation Market Size and Share
Market Overview
| Study Period | 2019 - 2030 |
|---|---|
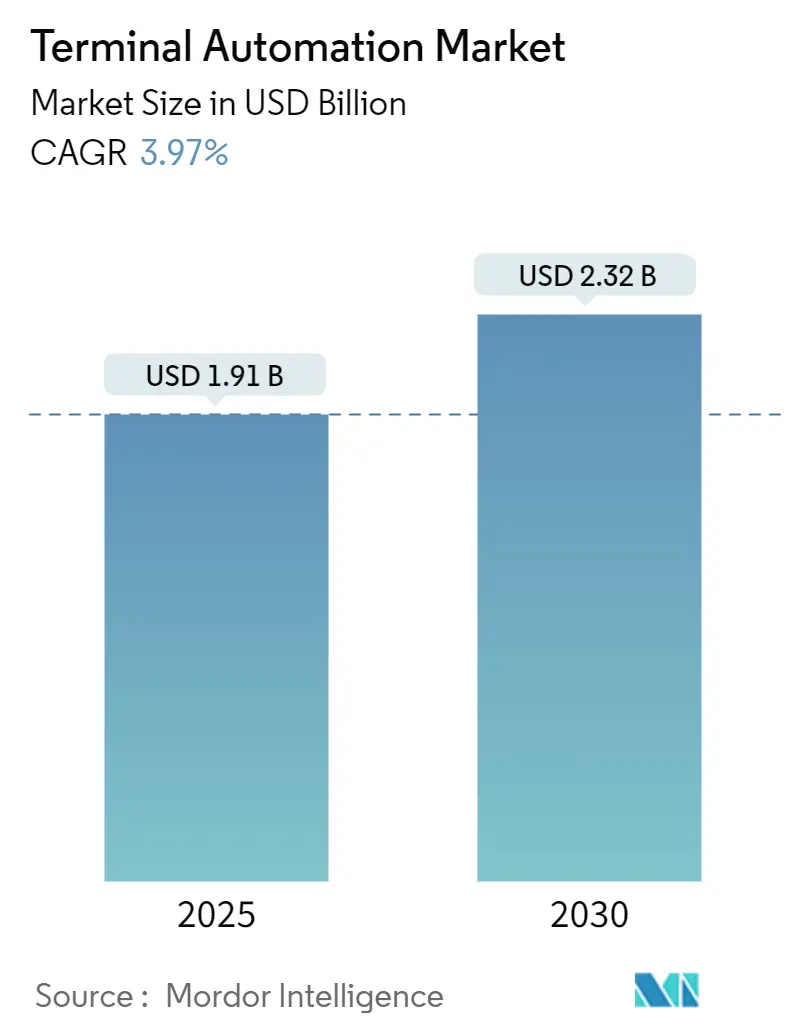
| Market Size (2025) | USD 1.91 Billion |
| Market Size (2030) | USD 2.32 Billion |
| Growth Rate (2025 - 2030) | 3.97% CAGR |
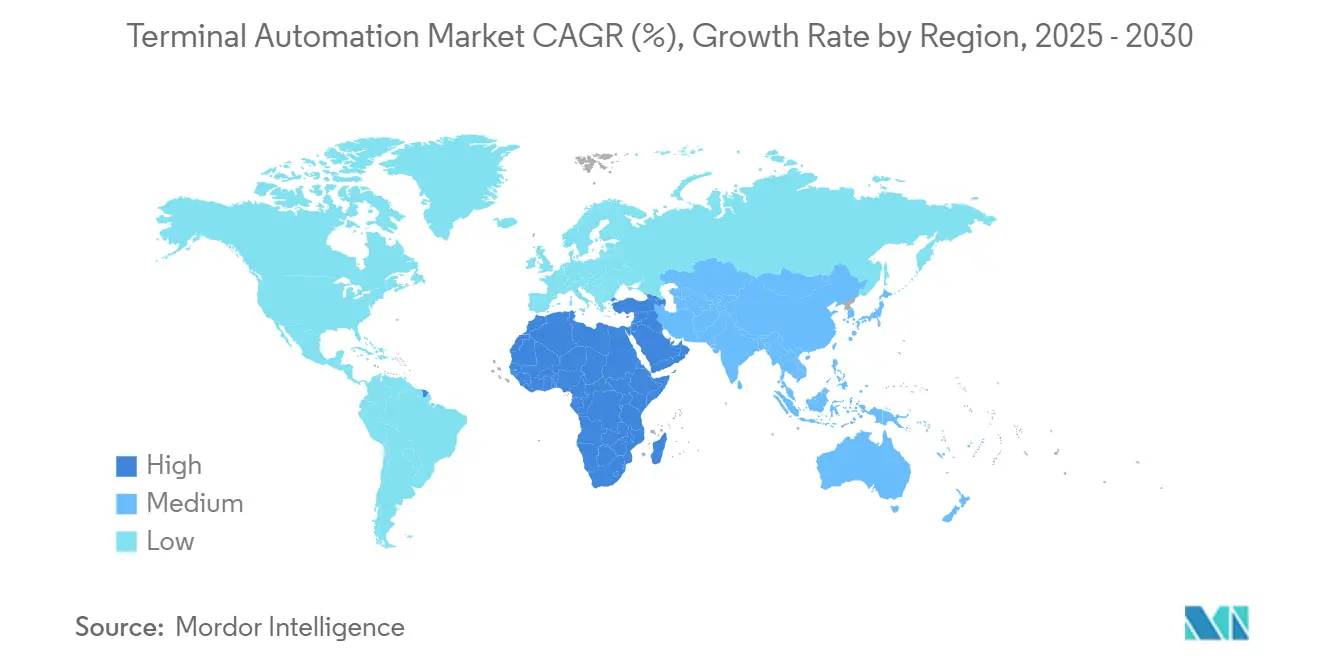
| Fastest Growing Market | Middle East and Africa |
| Largest Market | Asia Pacific |
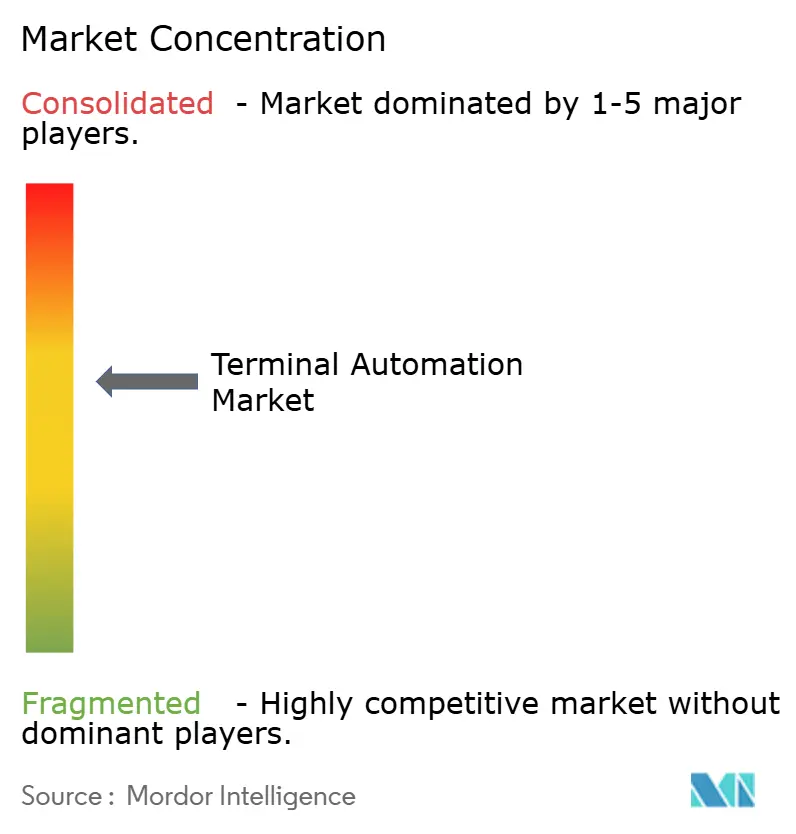
| Market Concentration | Medium |
Major Players *Disclaimer: Major Players sorted in no particular order Image © Mordor Intelligence. Reuse requires attribution under CC BY 4.0. | |
Terminal Automation Market Analysis by Mordor Intelligence
The terminal automation market size is projected to advance from USD 1.91 billion in 2025 to USD 2.32 billion in 2030, registering a 3.97% CAGR over the forecast period. Growth stems from stricter global safety regulations, rising demand for real-time visibility, and ongoing digital transformation programs that weave SCADA, DCS, PLC, 5G, and cloud analytics into hazardous-area logistics. Increasing infrastructure spending at mega-ports, LNG hubs, and chemical storage parks triggers large-scale upgrades, while competitive intensity favors vendors that combine hardware, software, and lifecycle services. The Asia-Pacific region anchors demand with heavy investments in automated container terminals, although the Middle East and Africa hold the fastest growth potential as governments fund green-field LNG and petrochemical projects. Hardware sales currently dominate revenue, yet services outpace all other categories as operators seek continuous optimization, cybersecurity, and predictive maintenance support. Strategic partnerships, joint ventures, and targeted mergers and acquisitions (M&A) signal a race to build turnkey portfolios that align with evolving environmental, social, and governance (ESG) mandates.
Key Report Takeaways
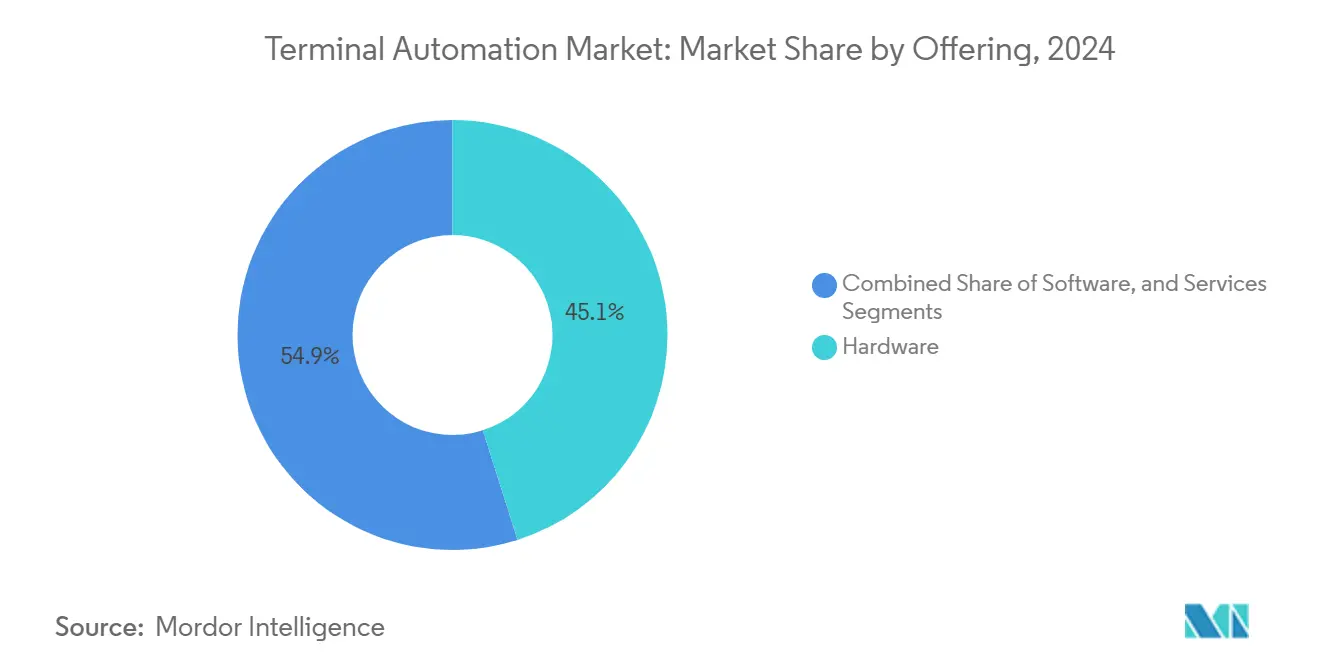
- By offering, hardware captured 45.1% of the terminal automation market share in 2024, while services are forecast to expand at a 5.13% CAGR to 2030.
- By terminal type, oil & gas storage led with a 48.2% revenue share in 2024; container and cargo ports are projected to record the highest CAGR at 5.33% through 2030.
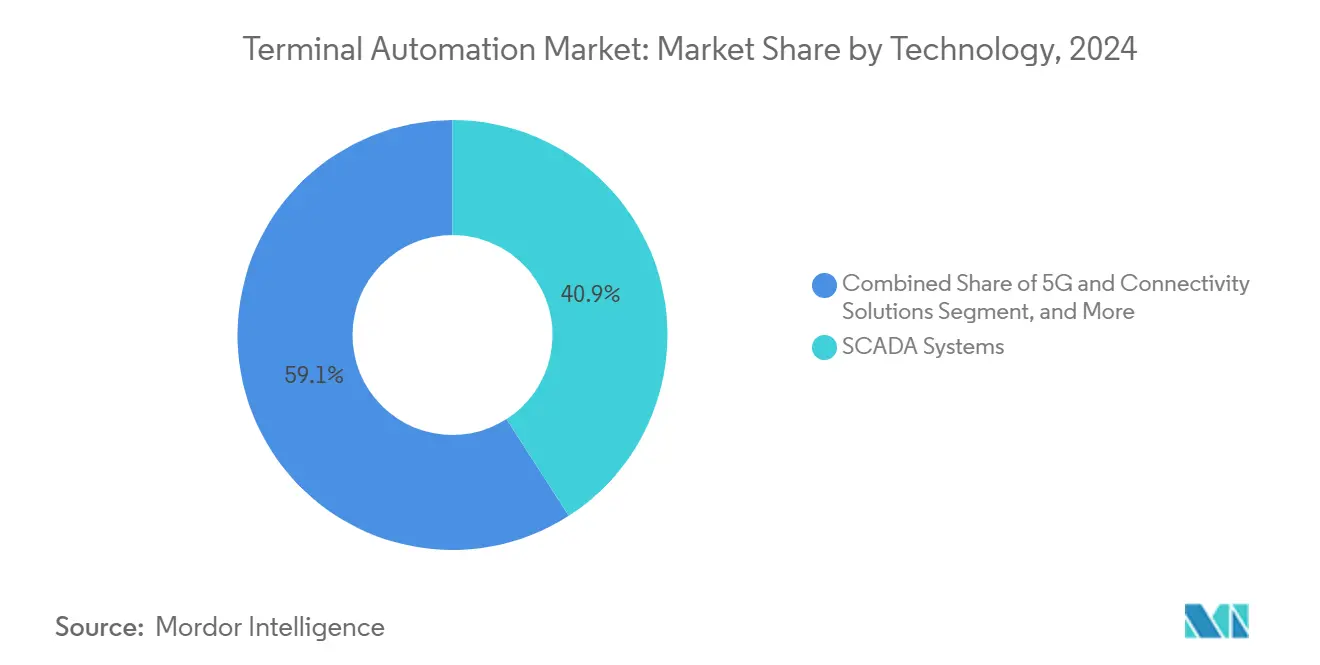
- By 2024, SCADA systems are expected to account for 40.9% of the terminal automation market size, and 5G & connectivity solutions are projected to grow at a 6.73% CAGR through 2030.
- By end-user, the oil & gas sector held a 55.3% share of the terminal automation market size in 2024, whereas the logistics and ports segment is expected to grow at a 6.34% CAGR through 2030.
- By geography, the Asia-Pacific region commanded a 37.8% share of the terminal automation market in 2024; the Middle East and Africa region is expected to accelerate at a 5.12% CAGR between 2025 and 2030.
Global Terminal Automation Market Trends and Insights
Drivers Impact Analysis*
| Driver | (~) % Impact on CAGR Forecast | Geographic Relevance | Impact Timeline |
|---|---|---|---|
| Surge in demand for safety-compliant operations at oil and gas terminals | +2.10% | Global, with concentration in North America and Middle East | Medium term (2-4 years) |
| Stricter environmental mandates for emission and spill control | +1.80% | Europe and North America core, expanding to APAC | Long term (≥ 4 years) |
| Rising container-throughput pressures at mega-ports | +2.30% | APAC core, spill-over to Europe and North America | Short term (≤ 2 years) |
| Adoption of digital twins for remote asset visibility | +1.40% | Global, with early adoption in developed markets | Medium term (2-4 years) |
| Roll-out of 5G private networks enabling real-time control | +1.60% | APAC and North America leading, Europe following | Medium term (2-4 years) |
| Government decarbonization incentives for bulk-storage sites | +1.20% | Europe leading, expanding to North America and APAC | Long term (≥ 4 years) |
| Source: Mordor Intelligence | |||
Surge in Demand for Safety-Compliant Operations at Oil & Gas Terminals
Updated API 2350 overfill guidelines require automated level monitoring and proof-tested shutdown logic, pushing operators to retrofit legacy sites with certified instrumentation and SIL-rated controls. ExxonMobil’s Beaumont terminal reported zero recordable incidents and 60% faster compliance reporting after a full automation retrofit in 2024.[1]ExxonMobil Corporation, “Beaumont Refinery Terminal Automation Implementation,” corporate.exxonmobil.com The economic rationale is clear, with single-incident liabilities ranging from USD 50 million to USD 200 million across cleanup, fines, and downtime. Upgrades initially concentrate in the United States and Saudi Arabia; however, similar safety standards in Canada and the UAE broaden the spending base.
Rising Container-Throughput Pressures at Mega-Ports
Container volumes at Asia-Pacific hubs have climbed 40% since 2020, overwhelming crane fleets and yard crews. Shanghai’s fourth-phase automated wharf cut vessel dwell time from 18 hours to 12 hours and lifted annual capacity by 35% in 2024.[2]Shanghai International Port Group, “Automated Terminal Expansion Project Results,” portshanghai.com.cn Singapore’s Tuas megaport, live since late 2024, processes 65 million TEU per year with a lights-out operation that side-steps labor bottlenecks. Each hour of delay costs shippers about USD 3,000 per container, making automation a direct cost-avoidance play for ports on primary East-West lanes.
Adoption of Digital Twins for Remote Asset Visibility
Shell’s Pernis refinery mirrors all 1,600 valves and 280 pumps in a cloud-hosted replica that predicts failure signatures seven days ahead, cutting unscheduled downtime 25% and boosting utilization 30% in 2024.[3]Shell Global, “Pernis Refinery Digital Twin Roll-Out,” shell.com Digital twins link historian data, CAD models, and real-time sensor tags into an always-on diagnostic layer, turning inspection rounds into analytics-driven workflows. Early deployments occurred in Western Europe, yet payback periods of under three years draw new projects across Japan, Australia, and the Gulf states.
Roll-Out of 5G Private Networks Enabling Real-Time Control
Hamburg Port’s dedicated 3.7 GHz band reduced crane response latency tenfold, enabling fleet-wide orchestration of autonomous vehicles that raised berth productivity 22% during 2024 trials.[4]Nokia Corporation, “Hamburg Port 5G Private Network Deployment,” nokia.com Private 5G outperforms Wi-Fi in dense metal environments and allows uplink video streams for remote crane operators, while network slicing isolates safety-critical traffic. The model is now copied at L.A./Long Beach terminals and select Indian ports receiving government spectrum incentives.
Restraints Impact Analysis*
| Restraint | (~) % Impact on CAGR Forecast | Geographic Relevance | Impact Timeline |
|---|---|---|---|
| High upfront CAPEX and long payback cycles | -1.70% | Global, particularly affecting smaller terminal operators | Medium term (2-4 years) |
| Legacy system interoperability challenges | -1.30% | North America and Europe with aging infrastructure | Short term (≤ 2 years) |
| Escalating cyber-risk exposure in OT environments | -0.90% | Global, with heightened concern in critical infrastructure | Long term (≥ 4 years) |
| Scarcity of skilled automation engineers | -1.10% | Global, most acute in developed markets | Long term (≥ 4 years) |
| Source: Mordor Intelligence | |||
High Upfront CAPEX and Long Payback Cycles
Comprehensive projects for mid-size terminals average USD 25 million with 5- to 7-year returns, straining cash flows of independent operators. The International Association of Ports and Harbors notes operational savings of USD 4 million–USD 6 million per annum, yet lenders still view automation as high-risk unless volumes are under long-term contracts.[5]International Association of Ports and Harbors, “Global Port Automation Trends Report,” iaphworldports.org Hybrid funding, which blends green bonds with vendor-backed service agreements, is emerging to mitigate capital peaks.
Legacy System Interoperability Challenges
Installed SCADA platforms from the early 2000s often use Modbus RTU or proprietary variants incompatible with modern OPC UA stacks. An Industrial Internet Consortium survey found 70% of terminals require protocol conversion or rip-and-replace strategies, adding 15%–20% to project budgets.[6]Industrial Internet Consortium, “Terminal Infrastructure Interoperability Study,” iiconsortium.org North American refineries built before 2005 are particularly affected, prompting phased migrations and the use of interface gateways that prolong timelines.
*Our forecasts treat driver/restraint impacts as directional, not additive. The impact forecasts reflect baseline growth, mix effects, and variable interactions.
Segment Analysis
By Offering: Lifecycle Services Propel Growth Beyond Hardware
Hardware components captured 45.1% of 2024 revenue, the largest terminal automation market share, as sensors, PLCs, and safety systems remain the non-negotiable entry ticket for any project. Services, although smaller, are expanding at an 4.13% CAGR and are projected to outpace capital equipment growth through 2030, signaling a pivot toward outcome-based contracts that re-optimize installed assets over time.
Growth in services enlarges the terminal automation market size because owners shift budgets from one-off hardware purchases to multiyear cybersecurity, analytics, and remote-monitoring agreements. Vendors bundle software updates, patch management, and predictive maintenance into fixed annual fees that smooth cash flow for operators while anchoring recurring revenue for suppliers.


By Terminal Type: Ports Surge While Oil & Gas Retains Scale
Oil and gas storage sites retained 48.2% of 2024 revenue, the highest terminal automation market share, thanks to decades of mandatory safety and overfill compliance spending. Container and cargo ports, however, post the fastest 4.33% CAGR as automated cranes and yard vehicles tackle surging throughput at mega-hubs in China and Singapore.
Ports expand the terminal automation market size by deploying integrated TOS-to-SCADA stacks that cut vessel dwell time and reduce labor dependency. Petroleum terminals, in contrast, focus on modernizing legacy control loops with SIL-rated instrumentation, keeping their spending steady but less explosive than the green-field port projects now underway across Asia-Pacific.
By Technology: SCADA Core Meets 5G Edge Revolution
SCADA platforms delivered 40.9% of 2024 sales, anchoring supervisory control for pumps, valves, and custody meters and thus holding the largest terminal automation market share. Private 5G and other connectivity solutions grow fastest at 5.73% CAGR because real-time video, LIDAR, and autonomous vehicle control require sub-10-millisecond latency that Wi-Fi cannot guarantee.
The accelerating rollout of 5G widens the terminal automation market size by unlocking new use cases-remote crane driving, drone inspections, and AR maintenance-without rewiring entire sites. Meanwhile, SCADA migrates to open protocols and edge architectures so that historic data can feed AI models living in the same 5G-enabled cloud, blending old and new technology stacks under one cybersecurity umbrella.
By End-User Industry: Logistics Races Ahead of Established Hydrocarbon Bases
Oil and gas sector held 55.3% of 2024 revenue, safeguarding its lead in terminal automation market size through stringent safety, vapor control, and environmental reporting rules. Logistics and ports, however, register a 5.34% CAGR, narrowing the gap as e-commerce and near-shoring fill container yards faster than manual workflows can manage.
Rising port projects push vendors to tailor modular offerings that scale across dozens of berths, while hydrocarbon players channel budgets into digital twins that predict failures and trim downtime. Chemical, mining, and power terminals adopt similar platforms, yet their combined spend still trails the two dominant segments, confirming a bifurcated growth narrative inside the broader terminal automation market share landscape.
Geography Analysis
Asia-Pacific commanded 37.8% of 2024 revenue, the largest regional terminal automation market share, as China alone invested more than USD 5 billion in automated wharves and LNG jetties during the year. Flagship projects in Shanghai, Busan, and Singapore embed 5G networks and AI berth planning, keeping the regional terminal automation market size well ahead of any other bloc.
The Middle East and Africa region shows a 5.12% CAGR through 2030, the fastest trajectory globally. Saudi Aramco’s Ras Tanura upgrade and the UAE’s Jebel Ali expansion weave digital twins, SIL-3 safety loops, and autonomous yard vehicles into green-field layouts, pushing local operators to leapfrog legacy architectures. These investments reinforce national diversification agendas and tighten compliance with IMO and ISO safety frameworks.
North America and Europe remain mature yet active. U.S. Gulf Coast refineries upgrade cyber-hardening and protocol gateways, while the Port of Rotterdam applies AI queue optimization to meet EU climate rules. South America lags in installed base but gains momentum as Brazil modernizes grain and ore terminals, adding incremental demand that rounds out global terminal automation market size growth without reshaping the leadership hierarchy.

Competitive Landscape
Global leadership rests with five multi-industry automation majors-Honeywell, Emerson, ABB, Schneider Electric, and Siemens-whose combined portfolios cover sensors to MES dashboards. They leverage long-standing hydrocarbon credentials to cross-sell into ports and chemicals, bundling capex projects with decade-long service renewals. ABB’s 2024 acquisition of Siemens’ marine automation arm strengthened its quay crane and yard management lineup, illustrating convergence between maritime and process domains. Mid-market challengers, such as Yokogawa, Rockwell Automation, and AspenTech, differentiate themselves through open-architecture platforms and AI edge analytics.
Strategic playbooks center on digital ecosystems. Vendors court 5G carriers and cloud hyperscalers to pre-integrate connectivity, security, and data lakes, reducing deployment friction for brownfield sites. Patent activity surged 35% in 2024, especially around autonomous guided vehicles and cybersecurity anomaly detection, underscoring rising IP defensibility. Service revenue exceeds 30% of automation majors’ segment sales, signaling a shift from reliance on hardware margins to subscription analytics, outcome-based maintenance, and remote operations centers.
Fragmentation persists in specialist niches-loading-arm actuators, custody-metering skids, terminal management software-where regional players thrive on localized codes and service proximity. Consolidation is expected as integrators seek bolt-on software assets to satisfy end-to-end solution mandates in new green-field petrochemical zones.
Terminal Automation Industry Leaders
Honeywell International Inc.
Emerson Electric Co.
ABB Ltd.
Schneider Electric SE
Siemens AG
- *Disclaimer: Major Players sorted in no particular order

Recent Industry Developments
- April 2025: Rockwell Automation introduced a zero-trust security suite for terminal OT environments after securing ISO 27001 re-certification, bolstering its advisory services funnel. Strategy is to capture rising spend on cybersecurity retrofits amid escalating ransomware incidents.
- October 2024: Honeywell won a USD 180 million contract for Saudi Aramco’s Ras Tanura upgrade, aiming to embed digital twins and advanced process control to boost throughput without expanding footprint. Strategy: deepen footprint in Middle Eastern mega-refineries and lock in 10-year service tail.
- September 2024: ABB acquired Siemens’ marine automation business for USD 850 million to fold quay-side control and shore-power assets into its global industrial automation stack. Strategy: accelerate port vertical integration and capture cross-selling synergies in container-yard electrification.
- August 2024: Emerson invested USD 200 million in its Singapore plant for SCADA and field-instrument production targeting Asia-Pacific terminals. Strategy: near-shore manufacturing to curtail lead times and support local content rules under the Regional Comprehensive Economic Partnership (RCEP) trade accords.


Global Terminal Automation Market Report Scope
The Terminal Automation Market Report is Segmented by Offering (Hardware, Software, and Services), Technology (SCADA Systems, Distributed Control Systems, and More),Terminal Type (Oil and Gas Storage Terminals, Container and Cargo Ports, Airports Fueling Terminals, and More), End-User Industry (Oil and Gas, Logistics and Ports, Mining and Metals, and More), and Geography. The Market Forecasts are Provided in Terms of Value (USD).
| Hardware |
| Software |
| Services |
| Oil and Gas Storage Terminals |
| Container and Cargo Ports |
| Airports Fueling Terminals |
| Chemical and Bulk-Liquid Terminals |
| SCADA Systems |
| Distributed Control Systems (DCS) |
| Programmable Logic Controllers (PLC) |
| Enterprise / MES Software |
| Sensors and Field Devices |
| 5G and Connectivity Solutions |
| Oil and Gas |
| Chemicals |
| Logistics and Ports |
| Mining and Metals |
| Power and Utilities |
| Food and Beverages |
| North America | United States | |
| Canada | ||
| Mexico | ||
| South America | Brazil | |
| Argentina | ||
| Rest of South America | ||
| Europe | Germany | |
| United Kingdom | ||
| France | ||
| Italy | ||
| Spain | ||
| Russia | ||
| Rest of Europe | ||
| Asia-Pacific | China | |
| Japan | ||
| India | ||
| South Korea | ||
| South-East Asia | ||
| Rest of Asia-Pacific | ||
| Middle East and Africa | Middle East | Saudi Arabia |
| United Arab Emirates | ||
| Turkey | ||
| Rest of Middle East | ||
| Africa | South Africa | |
| Nigeria | ||
| Rest of Africa | ||
| By Offering | Hardware | ||
| Software | |||
| Services | |||
| By Terminal Type | Oil and Gas Storage Terminals | ||
| Container and Cargo Ports | |||
| Airports Fueling Terminals | |||
| Chemical and Bulk-Liquid Terminals | |||
| By Technology | SCADA Systems | ||
| Distributed Control Systems (DCS) | |||
| Programmable Logic Controllers (PLC) | |||
| Enterprise / MES Software | |||
| Sensors and Field Devices | |||
| 5G and Connectivity Solutions | |||
| By End-User Industry | Oil and Gas | ||
| Chemicals | |||
| Logistics and Ports | |||
| Mining and Metals | |||
| Power and Utilities | |||
| Food and Beverages | |||
| By Geography | North America | United States | |
| Canada | |||
| Mexico | |||
| South America | Brazil | ||
| Argentina | |||
| Rest of South America | |||
| Europe | Germany | ||
| United Kingdom | |||
| France | |||
| Italy | |||
| Spain | |||
| Russia | |||
| Rest of Europe | |||
| Asia-Pacific | China | ||
| Japan | |||
| India | |||
| South Korea | |||
| South-East Asia | |||
| Rest of Asia-Pacific | |||
| Middle East and Africa | Middle East | Saudi Arabia | |
| United Arab Emirates | |||
| Turkey | |||
| Rest of Middle East | |||
| Africa | South Africa | ||
| Nigeria | |||
| Rest of Africa | |||


Key Questions Answered in the Report
What is the projected value of the terminal automation market in 2030?
The terminal automation market size is expected to reach USD 2.32 billion by 2030.
Which region currently leads spending on automated terminals?
Asia-Pacific holds the largest share at 37.8% of 2024 revenue.
Which technology segment is growing the fastest?
5G and connectivity solutions are advancing at a 5.73% CAGR through 2030.
Why are services outpacing hardware growth?
Operators seek continuous optimization, cybersecurity, and predictive maintenance, shifting budgets toward lifecycle services.
What is the main barrier for small terminal operators?
High upfront capital costs and 5- to 7-year payback periods limit large-scale deployments.
How are ports addressing container congestion?
Automated cranes, autonomous vehicles, and AI berth schedulers cut vessel turnaround times and raise throughput.
Page last updated on:


