Telecom Network Sustainability Market Size and Share
Market Overview
| Study Period | 2020 - 2031 |
|---|---|
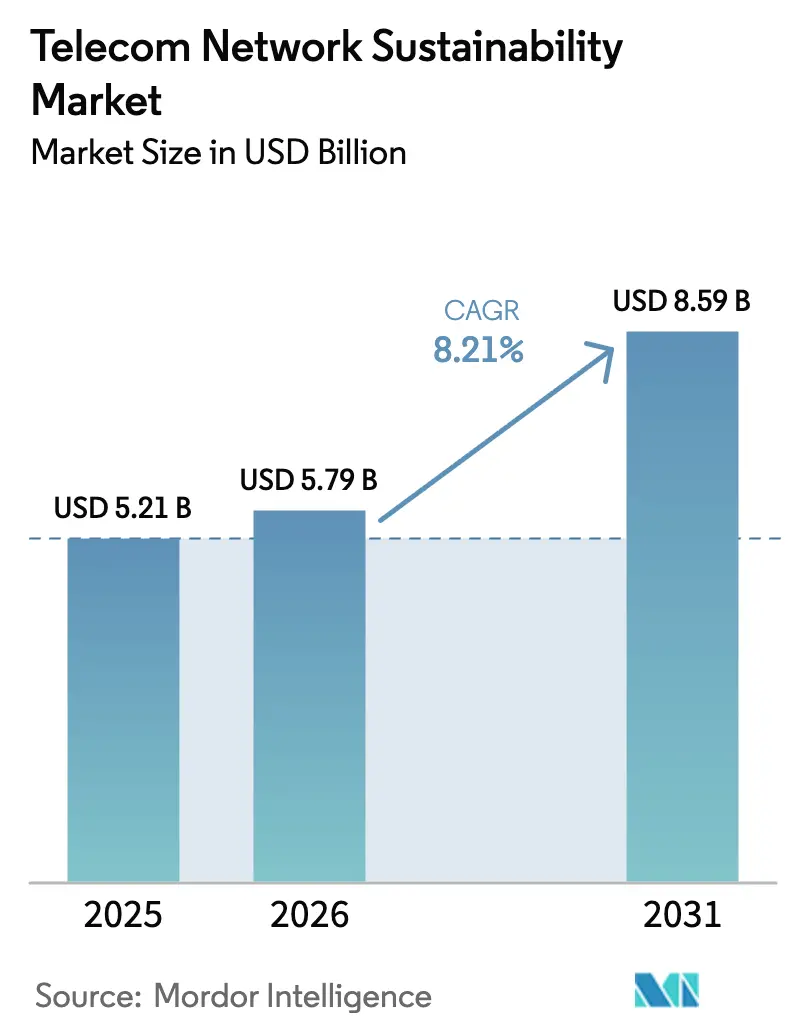
| Market Size (2026) | USD 5.79 Billion |
| Market Size (2031) | USD 8.59 Billion |
| Growth Rate (2026 - 2031) | 8.21% CAGR |
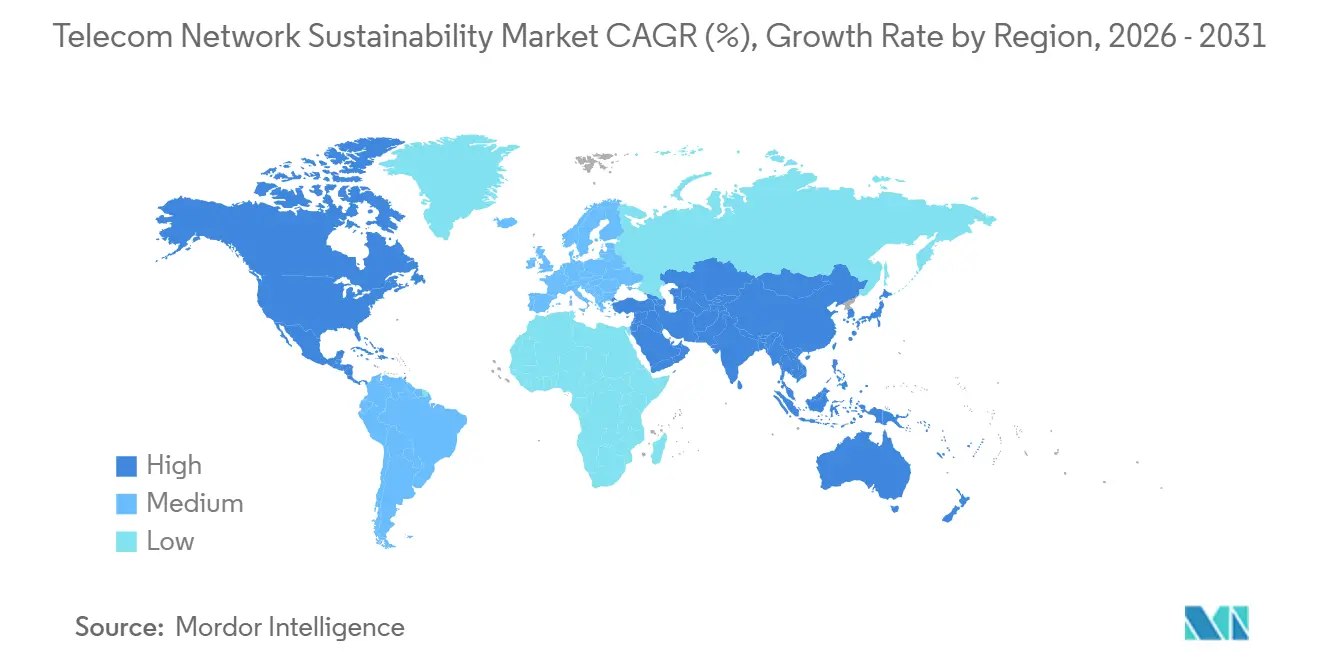
| Fastest Growing Market | Asia Pacific |
| Largest Market | North America |
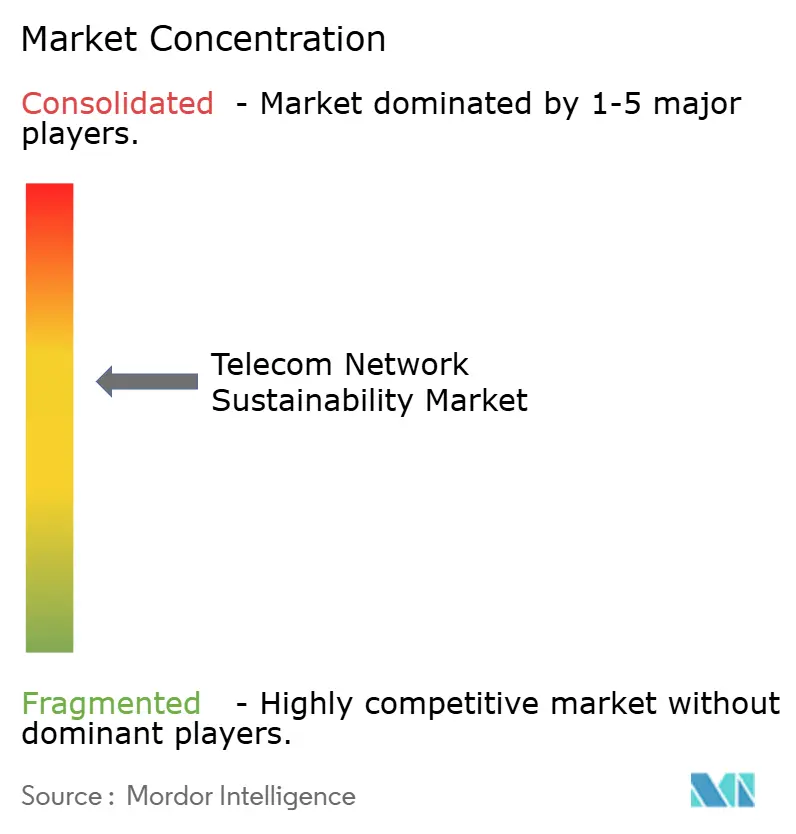
| Market Concentration | Medium |
Major Players *Disclaimer: Major Players sorted in no particular order Image © Mordor Intelligence. Reuse requires attribution under CC BY 4.0. | |
Telecom Network Sustainability Market Analysis by Mordor Intelligence
The Telecom Network Sustainability Market size is expected to grow from USD 5.21 billion in 2025 to USD 5.79 billion in 2026 and is forecast to reach USD 8.59 billion by 2031 at 8.21% CAGR over 2026-2031. Escalating electricity bills from 5G densification, binding carbon-neutrality mandates, and the availability of ESG-linked financing are together raising sustainability to a board-level priority. Operators are directing capital toward AI-driven radio access network (RAN) sleep-mode software, modular Open RAN hardware, and on-site renewable microgrids to curb Scope 1 and 2 emissions and secure preferential lending rates. Market momentum is reinforced by hyperscale cloud providers that insist colocation partners match their 24/7 carbon-free energy timelines, while tower companies monetize green infrastructure across multiple tenants through premium leases.
Key Report Takeaways
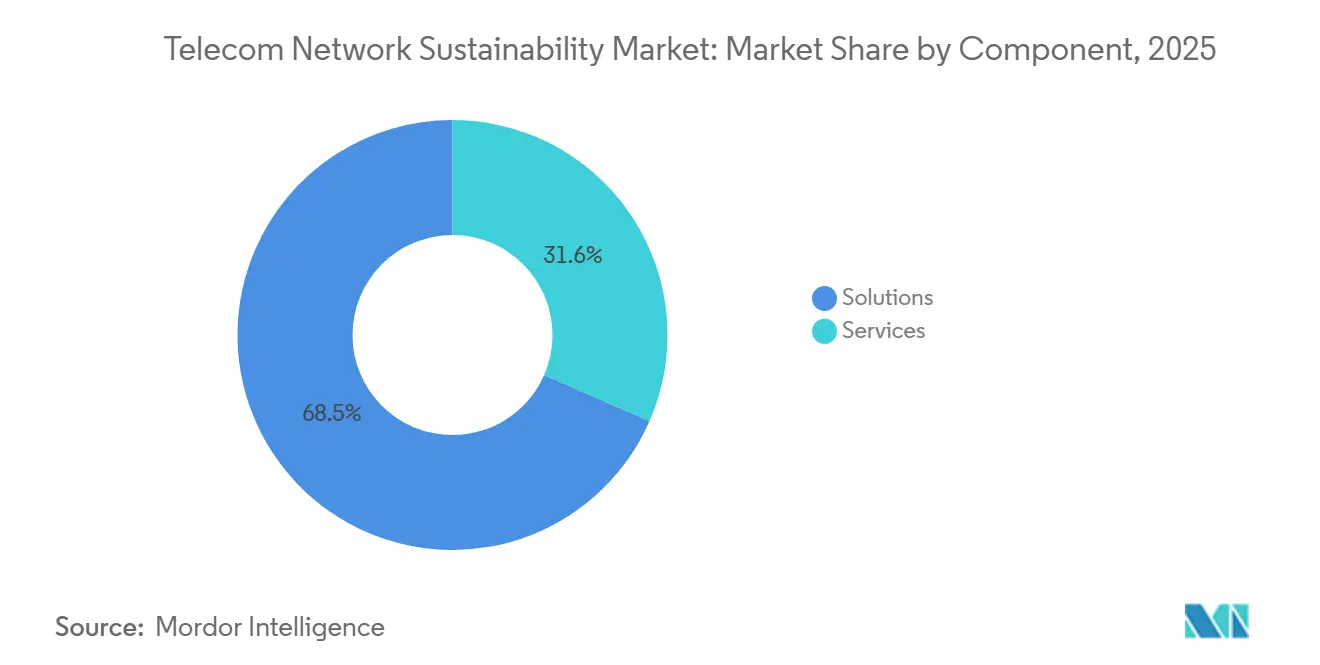
- By component, solutions led the telecom network sustainability market with 68.45% in 2025, and services are projected to expand at an 8.98% CAGR through 2031.
- By network layer, access network accounted for 37.89% of the telecom network sustainability market in 2025, whereas data centers and edge facilities are advancing at a 9.12% CAGR through 2031.
- By deployment model, cloud and software-as-a-service configurations captured 56.31% of the telecom network sustainability market in 2025 and are expected to grow at a 9.87% CAGR through 2031.
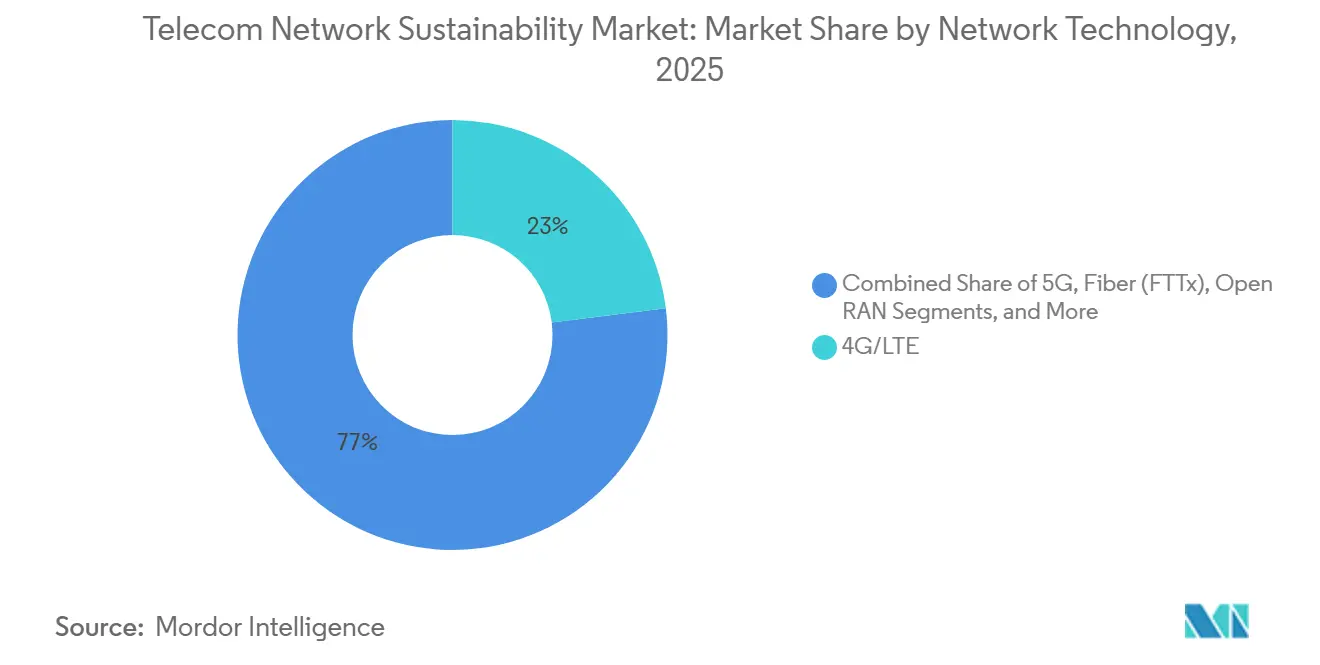
- By network technology, 4G captured 23.01% of the telecom network sustainability market in 2025, and satellite (LEO) is expected to grow at a 10.08% CAGR through 2031.
- By operator type, mobile network operators held 21.87% of the telecom network sustainability market share in 2025, while neutral hosts and tower companies recorded the fastest CAGR at 8.56% through 2031.
- By geography, the North American region held 26.78% of the telecom network sustainability market share in 2025, while Asia-Pacific is forecast to post the fastest regional CAGR of 10.19% through 2031.
Note: Market size and forecast figures in this report are generated using Mordor Intelligence’s proprietary estimation framework, updated with the latest available data and insights as of January 2026.
Global Telecom Network Sustainability Market Trends and Insights
Drivers Impact Analysis*
| Driver | (~) % Impact on CAGR Forecast | Geographic Relevance | Impact Timeline |
|---|---|---|---|
| Net-Zero Commitments and ESG Regulation | +1.8% | Global, with EU and North America leading enforcement | Medium term (2-4 years) |
| Escalating Energy Costs From 5G Densification | +1.5% | Global, acute in Asia-Pacific and Africa where grid tariffs are volatile | Short term (≤ 2 years) |
| Availability of Green Financing and ESG-Linked Bonds | +1.2% | Europe, North America, Asia-Pacific tier-1 markets | Medium term (2-4 years) |
| Vendor Eco-Design and Lifecycle-Assessment Standards | +1.0% | Global, concentrated in markets with ISO 14001 adoption | Long term (≥ 4 years) |
| AI-Driven RAN Sleep-Mode Optimization | +1.4% | North America, Europe, China, Japan, South Korea | Short term (≤ 2 years) |
| Metal Recovery Revenue From Decommissioned Gear | +0.6% | Europe, North America, select Asia-Pacific markets with reverse-logistics infrastructure | Long term (≥ 4 years) |
| Source: Mordor Intelligence | |||
Net-Zero Commitments and ESG Regulation
Investors no longer reward telecom operators that treat carbon reporting as a footnote. When the European Union’s Corporate Sustainability Reporting Directive took effect, procurement teams at Vodafone and Telefónica began scoring bids partly on life-cycle emissions, and vendors that lacked verified data suddenly fell off short lists. [1]European Commission, “Corporate Sustainability Reporting Directive,” ec.europa.eu China’s Ministry of Industry and Information Technology set a matching 2030 ceiling, prompting China Mobile to wire 1.2 million base stations with AI energy software in a single year. This pivot forces every participant in the telecom network sustainability market to publish auditable carbon numbers to access the USD 500 billion ESG-bond pool priced in 2025.
Escalating Energy Costs From 5G Densification
Moving from wide-area 4G sites to dense 5G clusters doubled, and sometimes tripled, monthly electricity bills, especially in markets where utilities raise tariffs with little notice. Ericsson recorded 4-5 kW draws for a typical 5G macro site, compared with 2-3 kW for 4G hardware, pushing many rural markets into negative-margin territory when grid prices spike. [2]Ericsson, “Mobility Report 2025,” ericsson.com Tower operators answered by rolling out hybrid solar-battery kits; American Tower’s 3,000-site program in Africa and Latin America cut diesel burn by 60% and saved roughly 50,000 t of CO₂ each year. [3]American Tower Corporation, “2025 Sustainability Report,” americantower.com Cost relief of that scale is nudging smaller carriers toward shared off-grid power, expanding the addressable slice of the telecom network sustainability market.
AI-Driven RAN Sleep-Mode Optimization
Machine-learning engines that power down radios during traffic lulls moved from lab demo to network default in 2025. Vodafone’s U.K. field trial across 2,500 sites trimmed electricity by 15% without dropping a single call, while Three UK reported 70% off-peak savings after switching off 5G carriers for a few hours each night. Nokia’s ReefShark chipset embeds inference cores that adjust beamforming on the fly, lowering energy per transmitted bit by up to 90% relative to first-generation basebands. These savings compound annually, making AI control software a mandatory line item for any operator wishing to remain in the top tier of the telecom network sustainability market.
Vendor Eco-Design and Life-Cycle Standards
Radio makers now showcase recycled metals and circular take-back schemes with the same pride once reserved for throughput charts. Ericsson’s AIR 3268 unit blends recycled aluminum and offers a 40% lower power draw than its predecessor, and Nokia recovered 95% of decommissioned base-station mass in 2025. Compliance with ISO 14001 and ETSI life-cycle checklists has become an entry ticket for European tenders, lifting the technology floor across the telecom network sustainability market.
Restraints Impact Analysis*
| Restraint | (~) % Impact on CAGR Forecast | Geographic Relevance | Impact Timeline |
|---|---|---|---|
| High Capex to Retrofit Legacy Infrastructure | -1.1% | Global, acute in Europe and North America with aging 3G/4G networks | Medium term (2-4 years) |
| Absence of Unified Sustainability KPIs | -0.7% | Global, fragmentation most severe in emerging markets | Long term (≥ 4 years) |
| Site Delays for Renewable Micro-Grids | -0.5% | Africa, Latin America, rural Asia-Pacific | Short term (≤ 2 years) |
| Scarcity of Low-Carbon Steel and Recycled Plastics | -0.4% | Global, supply-chain bottlenecks concentrated in Asia-Pacific manufacturing hubs | Medium term (2-4 years) |
| Source: Mordor Intelligence | |||
High Capex to Retrofit Legacy Infrastructure
Upgrading brownfield networks for sustainability requires significant capital, often at odds with short-term ROI goals. For a tier-1 operator managing 50,000 sites, this equates to USD 750 million-1.25 billion, or 15-25% of annual capex in stagnant revenue markets. In Europe, operators like Orange and Deutsche Telekom still rely on outdated 3G base stations incapable of AI-driven energy optimization, forcing a two-tiered upgrade cycle. Urban sites are prioritized, widening the energy-efficiency gap with rural areas. Leasing models from tower companies, which finance upgrades and recover costs via higher rents, shift rather than eliminate the capex burden.
Absence of Unified Sustainability KPIs
Operators juggle GRI 305, TCFD, SBTi, and a handful of national templates, dedicating up to a dozen full-time staff and USD 5 million a year simply to fill out overlapping forms. The reporting maze discourages smaller carriers from making fresh investments because they fear accusations of greenwashing if numbers don’t align. Until the industry agrees on one telecom-specific playbook, this bureaucratic drag will shave growth points off the telecom network sustainability market.
*Our forecasts treat driver/restraint impacts as directional, not additive. The impact forecasts reflect baseline growth, mix effects, and variable interactions.
Segment Analysis
By Component: Services Gain as Operators Outsource Complexity
Solutions comprised 68.45% of market share in 2025, driven by investments in energy-efficient radios, AI-powered network platforms, and renewable microgrids. Services, growing at 8.98% through 2031. Operators poured almost 70% of their 2025 budgets into hardware but quickly discovered that buying an efficient radio is the easy part. Calculating Scope 3 footprints across thousands of suppliers, containers, and disposal streams is tougher, so carriers now hire consulting arms at Accenture, Capgemini, and Ericsson to crunch that data. Services revenue inside the telecom network sustainability market therefore rises nearly 9% a year, faster than any boxed product, because regulators refresh disclosure rules annually, keeping advisory contracts alive. Energy-monitoring dashboards illustrate the appeal: Nokia’s NetGuard platform paid for itself in 18 months after highlighting over-provisioned cell sites that could safely cycle down at night.
Just as important, services let operators move sustainability spending from capex to opex. Instead of buying their own carbon-accounting tools, many carriers prefer paying a monthly fee that scales with network size, smoothing cash flow and aligning costs with usage. This shift attracts smaller mobile virtual network operators that could never justify a seven-figure software license. As more countries mandate audited Scope 3 data, the service slice of the telecom network sustainability market should harden into a subscription model that delivers predictable, high-margin revenue to vendors and consultants alike.


By Network Layer: Edge Facilities Surge on Hyperscale Commitments
The access network held 37.89% of the studied market in 2025, driven by the sheer volume of radio units deployed in 5G densification campaigns. Yet data center and edge facilities are growing at 9.12% through 2031, the fastest rate among network layers. RAN still commands the biggest dollar share because every 5G upgrade needs new radios, yet edge and data-center nodes are the real head-turners. Google Cloud matched 24/7 carbon-free energy for five regions in 2025, and Microsoft reserved USD 10 billion to hit the same goal by 2030. Those promises ripple outward when hyperscalers insist that a colocation hall run on green power, and the local telecom operator hosting multi-access edge compute must follow suit or lose the contract. That pressure fuels a 9% growth rate for edge facilities, easily outpacing core and transport upgrades inside the telecom network sustainability market.
Beyond raw power sourcing, edge nodes open new levers for heat reuse and demand-response revenue. Operators in Northern Europe now pipe waste heat from micro-data centers into district-heating grids, earning credits that shorten the payback period. In the United States, Verizon installs batteries at cell sites not only for backup but also to bid for frequency-regulation capacity in regional power markets, further monetizing sustainability installations. These tweaks elevate the edge layer from a cost center to a diversified earnings engine, strengthening its pull on future capex.
By Deployment Model: Cloud Platforms Amortize Monitoring Costs
Cloud and software-as-a-service configurations captured 56.31% of market share in 2025 and are accelerating at 9.87% through 2031, significantly outpacing on-premise deployments. A cloud dashboard that tracks energy for 50 carriers beats 50 individual on-premise servers every time. Ericsson’s SaaS-based Intelligent Automation Platform illustrates the math: operators pay per managed site, skipping upfront licenses and server racks. Multi-tenancy spreads development costs and accelerates feature releases, which is why cloud and SaaS account for more than half of the telecom network sustainability market revenue.
Regulatory firewalls do slow adoption in China and Russia, where data must stay on-shore. Even there, the compromise is hybrid: near-real-time control loops run on local servers, while historical trend analysis runs in a sovereign cloud cluster that still enjoys multi-tenant economics. Over time, as encryption and zero-trust architectures mature, the convenience of SaaS should prevail even in the most restrictive jurisdictions.
By Network Technology: Satellite LEO Leads on Off-Grid Appeal
Among network technologies, 4G and LTE retained a 23.01% share in 2025, reflecting the installed base of legacy macro cells that still carry the majority of voice and data traffic in emerging markets. However, satellite low-Earth-orbit constellations are surging at 10.08% through 2031, the highest growth rate in this segmentation, driven by their ability to eliminate diesel-generator dependency in remote and off-grid locations. Starlink’s solar-powered gateways wipe out that bill, making satellite backhaul both cheaper and cleaner than trucking fuel to a hilltop every week. OneWeb’s Africa and Latin America rollouts follow the same template, turning the constellation slice into the fastest-growing piece of the telecom network sustainability market.
Meanwhile, 5G vendors improve silicon so that an upgraded site draws less power than the 4G unit it replaces. Ericsson’s AIR 3268 uses gallium nitride amplifiers to cut energy use by 40%, proving that higher capacity no longer means higher consumption. Pair those radios with Open RAN software, and Vodafone’s 2025 pilot showed 30% savings over integrated macro cells. Continuous silicon and software progress keep terrestrial networks relevant even as satellites shine off-grid.

By Operator Type: Neutral Hosts Monetize Green Infrastructure
Mobile network operators accounted for 21.87% of market share in 2025, reflecting their role as the primary buyers of energy-efficient radios and AI-powered network management software. Yet neutral hosts and tower companies are expanding at 8.56% through 2031, driven by their ability to monetize green infrastructure across multiple tenant operators. Tower companies discovered that a solar panel earns money twice such as first by replacing diesel with their own assets, and second by letting every tenant claim lower Scope 2 numbers in investor reports. American Tower’s 3,000-site retrofit across emerging markets proved tenants will pay premium rent for steady green power and predictable opex. Crown Castle mirrored that logic with a USD 500 million U.S. build that targets 50% renewable penetration by 2028, cementing neutral hosts as the most dynamic buyers in the telecom network sustainability market.
Mobile network operators still hold the largest installed base, but many now offload remote energy headaches to tower firms so they can focus on spectrum and services. Fixed ISPs pivot toward passive optical networks that sip under 1 W per subscriber, while hyperscalers sign 20 GW of wind and solar PPAs and demand matching progress from every transit provider that touches their traffic. These intersecting pressures tilt future growth toward entities that can monetize sustainability across multiple revenue streams rather than treat it as a pure cost.
Geography Analysis
North America continues to spend the most per site because power purchase agreements with large wind farms remain the cheapest path to carbon cuts. Verizon and AT&T use those contracts to shield themselves from utility volatility and to show Wall Street credible net-zero roadmaps by 2035. State-level incentives, especially in Texas and the Mid-Atlantic, make large wind or solar blocks even more attractive, reinforcing the region’s 26.78% share of the telecom network sustainability market.
However, Asia-Pacific is expanding at 10.19% through 2031, the fastest regional growth rate, propelled by government mandates and the sheer scale of 5G deployments. India’s Department of Telecommunications mandated renewable-ready 5G base stations by 2027, prompting Reliance Jio and Bharti Airtel to line cell-site rooftops with solar film and battery packs. China Mobile, under Beijing’s 2030 carbon-peaking directive, wired 1.2 million radios with AI sleep controllers in 2025, saving a double-digit slice of total network power in a single budget cycle. Because APAC networks are still expanding, new sites ship with green kit baked in, so capex falls into growth budgets rather than retrofit buckets, a structural tailwind for the regional telecom network sustainability market.
In the European region, networks are mature, and swapping old gear is expensive, yet the European Green Deal still pressures carriers to move. Operators from Orange to Vodafone tap ESG-linked loans that shave interest rates if energy KPIs improve, creating financial carrots to balance the retrofit stick. Smaller markets, Nordics, Benelux, experiment with heat-reuse schemes, feeding waste warmth from edge servers into municipal district-heating pipes, an innovation that may spread once energy utilities verify long-term contracts. South America and the Middle East and Africa together account for a mid-teens share of spending, but their growth curves hinge on tower-company solar projects that replace diesel in off-grid towers. Financing models that bundle power services into long leases help overcome high sovereign borrowing costs and accelerate adoption in these regions.

Competitive Landscape
A handful of OEMs still command the headline numbers, but their grip is loosening. Ericsson, Nokia, Huawei, Samsung, and ZTE hold a significant share of solutions revenue, owing to gallium-nitride amplifiers and tightly coupled AI firmware that underpins energy savings in the telecom network sustainability market. They use vertical integration and custom silicon tied to software upgrades to lock in margins, yet even incumbents are opening interfaces because procurement teams now include sustainability clauses alongside price and performance.
Open RAN consortia chip away at that oligopoly. Vodafone’s 2025 field trial found that white-box radios from Mavenir and NEC cut power consumption by 30% relative to classic macros and enabled software to run on commodity servers. That result encourages operators in cash-tight markets to try multi-vendor blends, narrowing the performance gap between tier-one and challenger suppliers. Patent filings underscore the race. Nokia submitted 14 AI-energy patents to the European Patent Office in 2025, while Huawei filed 11 related to modular power amplifiers that extend hardware life. Intellectual property focused on energy, rather than sheer throughput, is now a primary differentiator.
Parallel to equipment makers, infrastructure landlords have become pivotal. American Tower and Crown Castle finance solar-battery add-ons, bundle energy-as-a-service, and pass savings to tenants, carving out a new profit line beyond rent. Hyperscalers, Amazon, Google, and Microsoft, exert soft power by refusing to colocate workloads unless facilities match 24/7 carbon-free targets, a stance that cascades down every fiber route touching their data. Consulting giants and audit firms capture rising service spend by translating raw energy logs into disclosures that satisfy regulators and investors, completing an ecosystem in which hardware, power, finance, and reporting interlock to propel the telecom network sustainability market forward.
Telecom Network Sustainability Industry Leaders
Telefonaktiebolaget LM Ericsson
Nokia Corporation
Huawei Technologies Co., Ltd.
ZTE Corporation
Samsung Electronics Co., Ltd.
- *Disclaimer: Major Players sorted in no particular order

Recent Industry Developments
- December 2025: EDOTCO Bangladesh and TSSL sign an MoU to open a battery repair and refurbishment center, extending lithium-ion life and cutting e-waste.
- October 2025: E.ON SE partners with Nokia to modernize German DSO communications, reducing energy use up to 50% with upgrade-ready 25G PON fiber.


Global Telecom Network Sustainability Market Report Scope
The Telecom Network Sustainability Market Report is Segmented by Component (Solutions and Services), Network Layer (Access Network, Transport/Backhaul, Core Network, Data Center and Edge Facilities), Deployment Model (On-Premise and Cloud/SaaS), Network Technology (5G, 4G/LTE, Fiber (FTTx), Edge Computing/MEC, Open RAN, Satellite (LEO)), Operator Type (Mobile Network Operators (MNOs), Fixed-line and ISPs, Hyperscale Cloud and Content Providers, Neutral Hosts and TowerCos, and Private-Network Enterprises), and Geography (North America, South America, Europe, Asia-Pacific, and Middle East and Africa). The Market Forecasts are Provided in Terms of Value (USD).
| Solutions |
| Services |
| Access Network |
| Transport/Backhaul |
| Core Network |
| Data Center and Edge Facilities |
| On-premise |
| Cloud/SaaS |
| 5G |
| 4G/LTE |
| Fiber (FTTx) |
| Edge Computing/MEC |
| Open RAN |
| Satellite (LEO) |
| Mobile Network Operators (MNOs) |
| Fixed-line and ISPs |
| Hyperscale Cloud and Content Providers |
| Neutral Hosts and TowerCos |
| Private-Network Enterprises |
| North America | United States | |
| Canada | ||
| Mexico | ||
| South America | Brazil | |
| Argentina | ||
| Rest of South America | ||
| Europe | Germany | |
| United Kingdom | ||
| France | ||
| Italy | ||
| Spain | ||
| Rest of Europe | ||
| Asia-Pacific | China | |
| Japan | ||
| India | ||
| South Korea | ||
| Rest of Asia-Pacific | ||
| Middle East and Africa | Middle East | GCC Countries |
| Turkey | ||
| Rest of Middle East | ||
| Africa | South Africa | |
| Nigeria | ||
| Rest of Africa | ||
| By Component | Solutions | ||
| Services | |||
| By Network Layer | Access Network | ||
| Transport/Backhaul | |||
| Core Network | |||
| Data Center and Edge Facilities | |||
| By Deployment Model | On-premise | ||
| Cloud/SaaS | |||
| By Network Technology | 5G | ||
| 4G/LTE | |||
| Fiber (FTTx) | |||
| Edge Computing/MEC | |||
| Open RAN | |||
| Satellite (LEO) | |||
| By Operator Type | Mobile Network Operators (MNOs) | ||
| Fixed-line and ISPs | |||
| Hyperscale Cloud and Content Providers | |||
| Neutral Hosts and TowerCos | |||
| Private-Network Enterprises | |||
| By Geography | North America | United States | |
| Canada | |||
| Mexico | |||
| South America | Brazil | ||
| Argentina | |||
| Rest of South America | |||
| Europe | Germany | ||
| United Kingdom | |||
| France | |||
| Italy | |||
| Spain | |||
| Rest of Europe | |||
| Asia-Pacific | China | ||
| Japan | |||
| India | |||
| South Korea | |||
| Rest of Asia-Pacific | |||
| Middle East and Africa | Middle East | GCC Countries | |
| Turkey | |||
| Rest of Middle East | |||
| Africa | South Africa | ||
| Nigeria | |||
| Rest of Africa | |||


Key Questions Answered in the Report
How fast is spending on sustainable telecom solutions growing?
The telecom network sustainability market posts an 8.21% CAGR from 2026-2031, lifting value from USD 5.79 billion in 2026 to USD 8.59 billion by 2031.
Which component segment will expand quickest?
Services, covering lifecycle assessments and circular-economy audits, rises at an 8.98% CAGR as operators outsource complex Scope 3 calculations.
Why is Asia-Pacific the fastest-growing region?
India’s renewable-ready 5G mandate and China Mobile’s AI energy-management rollout drive a 10.19% regional CAGR through 2031.
How do tower companies monetize sustainability?
Neutral hosts like American Tower retrofit sites with solar-battery systems, then charge premium rents while lowering tenants’ diesel costs.
What technology delivers the highest energy savings?
AI-driven RAN sleep-mode platforms cut network power use by up to 15% annually and enable 30% savings in Open RAN field trials.
Who leads in eco-designed radio hardware?
Ericsson’s AIR 3268 and Nokia’s ReefShark-based radios both use recycled materials and slash power draw 40-90% versus prior generations.
Page last updated on:


