Telecom Network Digital Twin Market Size and Share
Market Overview
| Study Period | 2020 - 2031 |
|---|---|
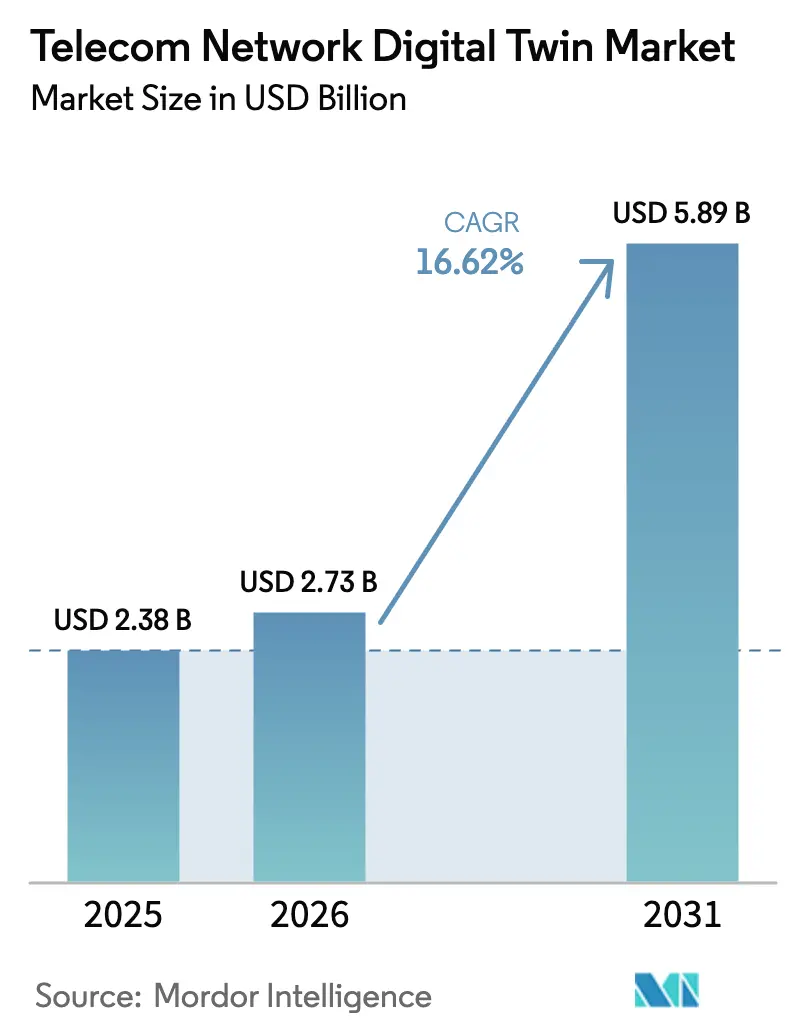
| Market Size (2026) | USD 2.73 Billion |
| Market Size (2031) | USD 5.89 Billion |
| Growth Rate (2026 - 2031) | 16.62% CAGR |
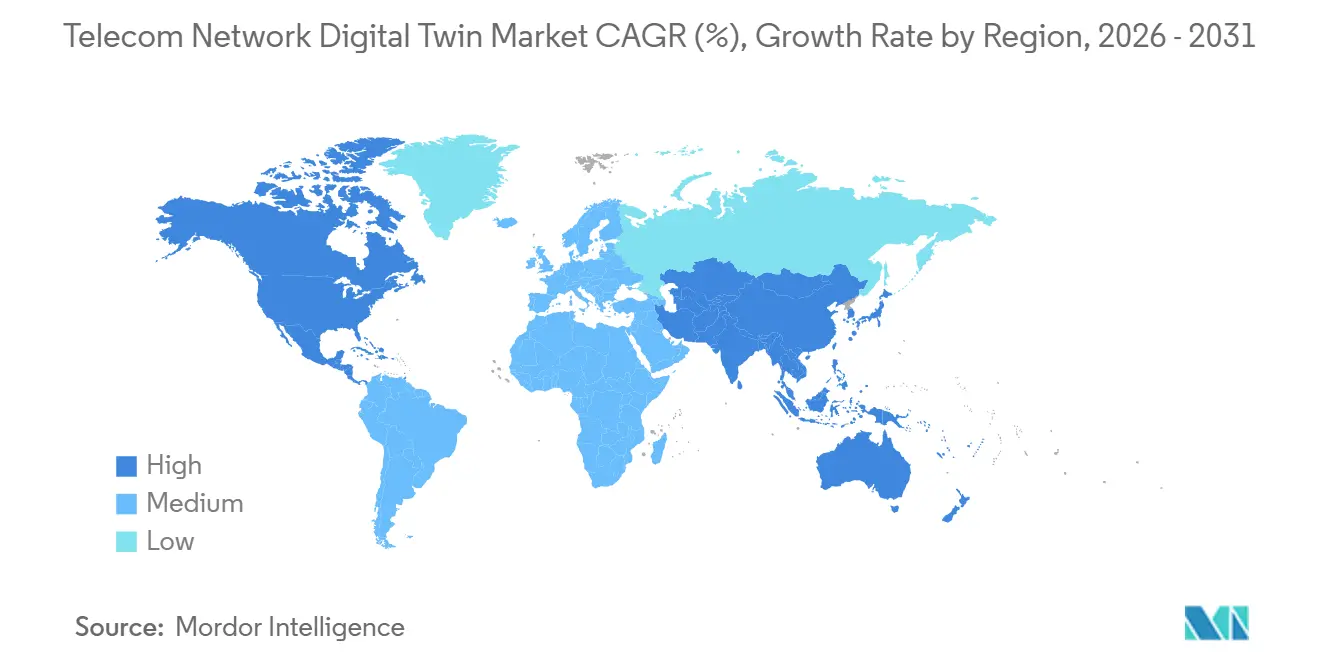
| Fastest Growing Market | Asia Pacific |
| Largest Market | North America |
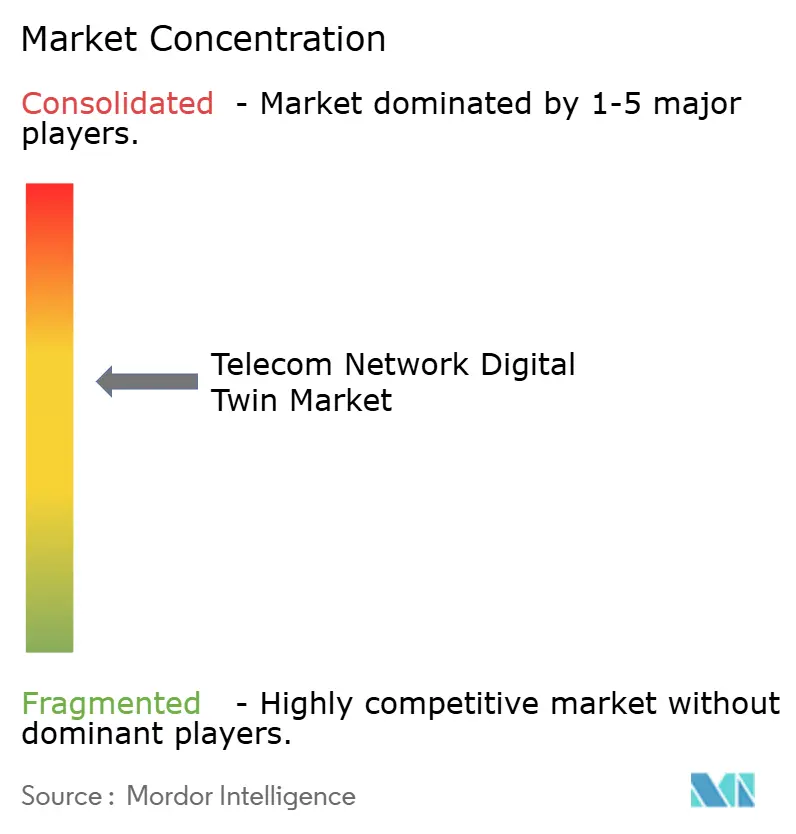
| Market Concentration | Medium |
Major Players *Disclaimer: Major Players sorted in no particular order Image © Mordor Intelligence. Reuse requires attribution under CC BY 4.0. | |
Telecom Network Digital Twin Market Analysis by Mordor Intelligence
The Telecom Network Digital Twin Market size was valued at USD 2.38 billion in 2025 and is estimated to grow from USD 2.73 billion in 2026 to reach USD 5.89 billion by 2031, at a CAGR of 16.62% during the forecast period (2026-2031). Accelerated growth reflects how communication service providers now simulate radio-access, core, and edge assets in software before making live changes, trimming truck rolls, and shortening upgrade cycles. Software vendors continue to improve ray-tracing accuracy and AI-driven optimization, while hyperscalers bundle telecom templates into horizontal platforms that eliminate lengthy code customization. Cloud adoption is climbing because consumption-based pricing shifts capital costs into operating budgets, an attractive lever as operators steer 5G and 6 GHz outlays toward revenue-generating apps. Rising energy prices and new carbon caps in Europe add urgency, pushing carriers to use twins for sleep-mode scheduling that cuts electricity bills without harming quality of service. At the same time, O-RAN’s open interfaces broaden the partner ecosystem, letting smaller analytics firms release purpose-built twin applications through operator marketplaces.
Key Report Takeaways
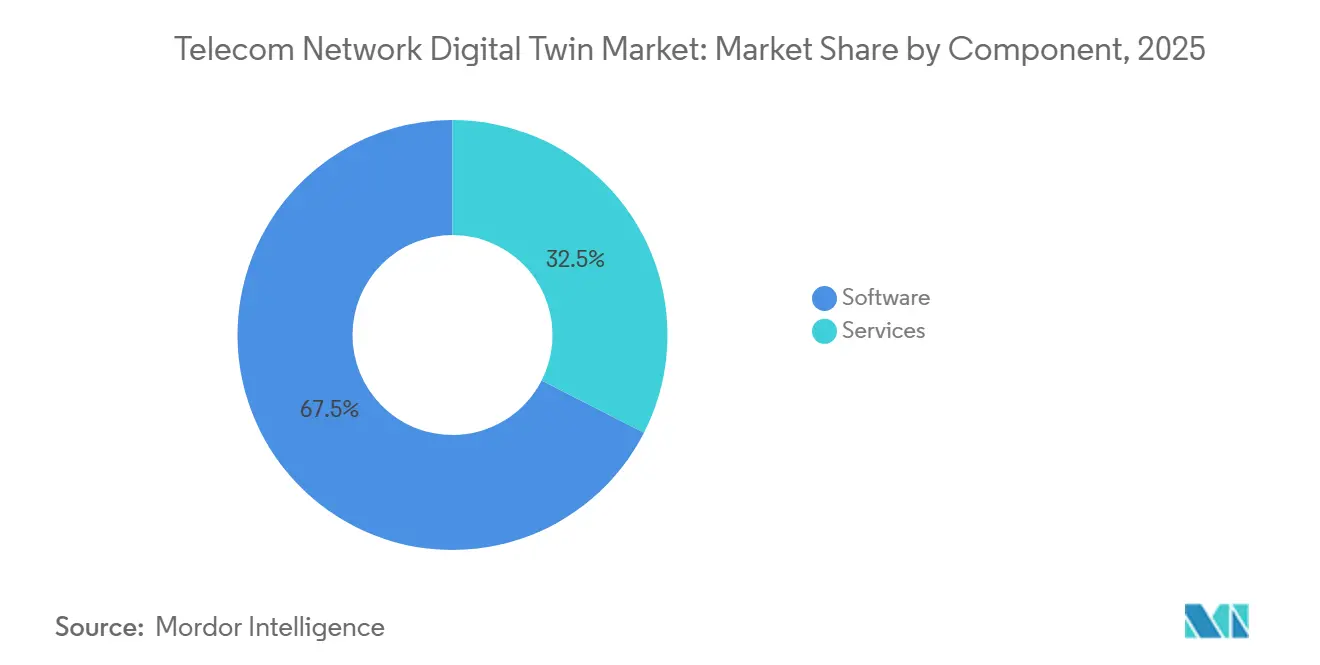
- By component, software captured 67.49% of the telecom network digital twin market share in 2025, while services are advancing at a 16.92% CAGR to 2031.
- By deployment mode, on-premise captured 45.32% of the telecom network digital twin market share in 2025, while cloud-based twins are on course to expand at an 18.78% CAGR through 2031.
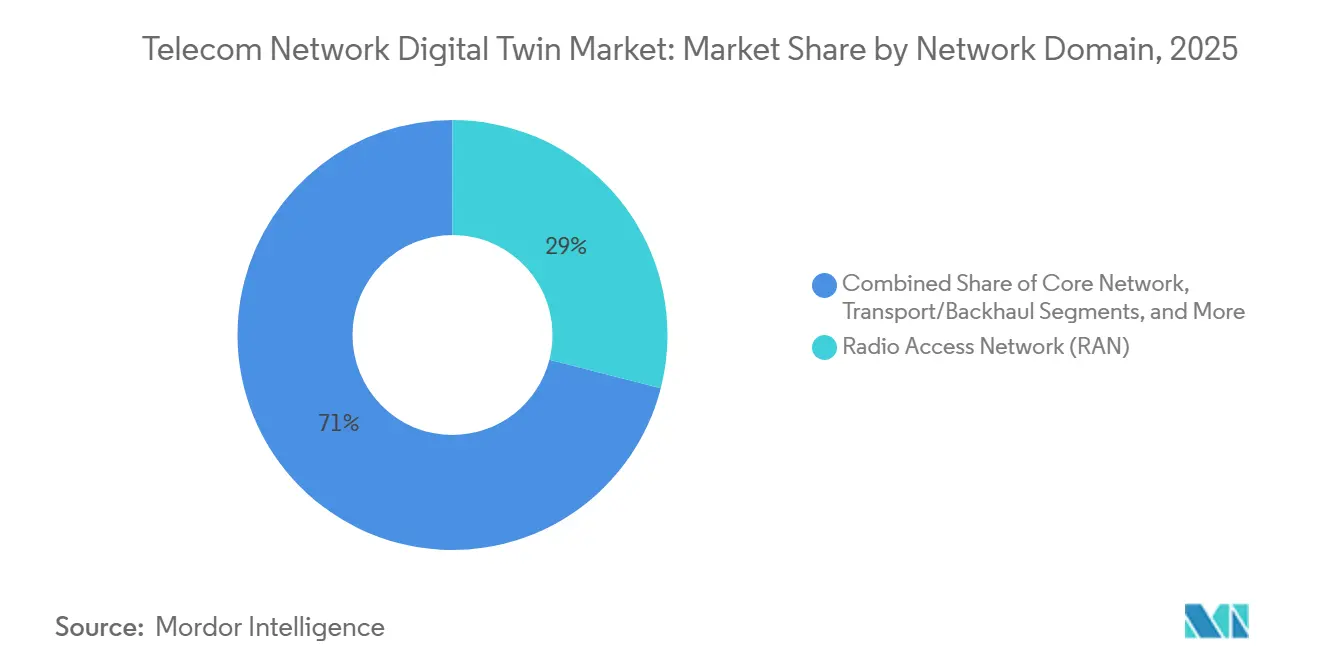
- By network domain, the radio access network (RAN) segment led with a 28.98% share in 2025; edge and MEC twins have the fastest trajectory, with a 17.43% CAGR to 2031.
- By end-user, communication service providers commanded 32.63% of 2025 spending, yet internet service providers are rising at a 17.02% CAGR to 2031.
- By geography, North America accounted for 29.87% of 2025 sales, while Asia-Pacific is pacing the global field with a 16.98% CAGR through 2031.
Note: Market size and forecast figures in this report are generated using Mordor Intelligence’s proprietary estimation framework, updated with the latest available data and insights as of January 2026.
Global Telecom Network Digital Twin Market Trends and Insights
Drivers Impact Analysis*
| Driver | (~) % Impact on CAGR Forecast | Geographic Relevance | Impact Timeline |
|---|---|---|---|
| 5G RAN Densification Mandates Real-Time Virtual Replicas for Interference-Aware Planning | +3.2% | North America, Europe, APAC urban hubs | Medium term (2-4 years) |
| CSP Shift to Cloud-Native Cores Requires Sandbox Twins for CI/CD Regression | +2.8% | North America, Europe, China, Japan, South Korea | Short term (≤2 years) |
| Energy-Cost Inflation Pushes Operators to Twin-Based RAN Sleep-Mode Optimization | +2.5% | Europe, North America, MEA importers | Medium term (2-4 years) |
| O-RAN’s Open Interfaces Accelerate Third-Party Twin Apps | +2.1% | North America, Europe, Japan, South Korea | Long term (≥4 years) |
| AI-Curated Synthetic Traffic Datasets Unlock Under-Served Rural Planning | +1.6% | India, ASEAN, Latin America, Africa | Long term (≥4 years) |
| Digital-Twin-Enabled Spectrum-Sharing Marketplaces Emerge Post-6 GHz Auctions | +1.4% | United States, Europe, select APAC | Medium term (2-4 years) |
| Source: Mordor Intelligence | |||
5G RAN Densification Mandates Real-Time Virtual Replicas for Interference-Aware Planning
Urban 5G rollouts add macro and small cells, which can cause 20%-30% throughput loss when planners rely solely on drive tests. Digital twins ingest terrain, clutter, and live signal data to rank pole locations that lower co-channel interference. Verizon trimmed site-acquisition costs by 18% in New York and Chicago, once its twin-flagged overlapping lobes and rain-fade pockets were removed.[1]Verizon Communications, “2025 Annual Report,” verizon.com AT&T uses Nokia’s AVA platform to pre-tune Dallas millimeter-wave backhaul paths, while Vodafone Germany applied Ericsson’s twin to boost cell-edge throughput 12% during Oktoberfest 2025. O-RAN’s 2026 reference architecture now ties virtual replicas to RAN Intelligent Controllers, enabling parameter proposals to close the loop in milliseconds.[2]O-RAN Alliance, “Digital Twin Reference Architecture,” o-ran.org
CSP Shift to Cloud-Native Cores Requires Sandbox Twins for CI/CD Regression
Containerized standalone cores bring weekly software drops, and a single misstep can cascade into national outages. Telefónica integrated Azure Digital Twins as an automated gate that replays synthetic peak traffic before every Helm-chart push, cutting incident counts by 34% in 2025. China Mobile reported similar gains in a 3GPP workshop, and Deutsche Telekom models slice isolation in Huawei’s ICNMaster twin before onboarding enterprise customers. The TM Forum’s 2026 autonomous-network guide positions twin-driven testing as table stakes for Level 3 self-optimizing operations.
Energy-Cost Inflation Pushes Operators to Twin-Based RAN Sleep-Mode Optimization
Electricity surpassed EUR 0.30 per kWh across Europe in 2024. Twins now forecast hourly load, then advise which sectors to mute during low-traffic windows without harming video start-times or handover rates. Orange France saved 9% in network energy, equal to EUR 22 million per year, after scaling Ericsson’s sleep-mode model to 15,000 sites. Vodafone UK and BT Group are replicating the approach, while the International Telecommunication Union estimates 10%-15% RAN power savings are attainable sector-wide.
O-RAN’s Open Interfaces Accelerate Third-Party Twin Apps
Disaggregated radios, distributed units, and centralized units connected through standardized E2 and A1 ports remove vendor lock-in for analytics. Rakuten Mobile opened a marketplace in 2025 that already lists twin apps for interference mitigation and slice assurance. Dish Network hosts similar micro-services on AWS, and SK Telecom provided a third-party congestion predictor that cut Seoul rush-hour drop rates by 8%. Open interfaces reduce barriers to entry for nimble software vendors, widening the addressable market for the telecom network digital twin.
Restraints Impact Analysis*
| Restraint | (~) % Impact on CAGR Forecast | Geographic Relevance | Impact Timeline |
|---|---|---|---|
| High-Fidelity RF Ray-Tracing Twins Demand GPU Clusters, CAPEX Barrier | -1.8% | Global, acute for Tier 2-3 operators | Short term (≤2 years) |
| Multi-Vendor Model-Schema Fragmentation Delays Interoperability | -1.5% | Europe, North America | Medium term (2-4 years) |
| Twin-to-Live Synchronisation Cyber-Risks Drive Regulatory Caution | -1.2% | Europe, North America, APAC | Medium term (2-4 years) |
| Scarcity of Domain-Trained ML Talent Lengthens Deployment Cycles | -1.0% | Latin America, MEA, Tier 2 APAC | Long term (≥4 years) |
| Source: Mordor Intelligence | |||
High-Fidelity RF Ray-Tracing Twins Demand GPU Clusters, CAPEX Barrier
Millimeter-wave accuracy needs billions of rays, and NVIDIA’s Sionna framework recommends at least eight H100 accelerators, pushing a single-city twin above USD 5 million.[3]NVIDIA Corporation, “Sionna Framework,” nvidia.com Tier 2 carriers hesitate, opting for lower-fidelity meshes that skip edge interference. AWS responded in 2026 with per-simulation pricing that rents shared GPU pools, yet operators worry about sovereignty and real-time latency. Keysight’s hybrid approach combines coarse planning with on-demand, high-detail bursts, reducing up-front spend by 40% for early adopters in Brazil and Saudi Arabia.
Multi-Vendor Model-Schema Fragmentation Delays Interoperability
Carriers that mix Nokia, Ericsson, and Huawei RAN gear often keep parallel twins because proprietary telemetry makes unified views difficult to achieve. A TM Forum 2025 survey found 62% of multi-vendor operators endured manual data reconciliation that stretched twin rollouts by as much as nine months. ETSI is drafting common schema guidance, yet uptake is voluntary and slow. Orange France pilots middleware to broker KPIs across vendor twins, but that sacrifices the granularity needed for root-cause analysis.
*Our forecasts treat driver/restraint impacts as directional, not additive. The impact forecasts reflect baseline growth, mix effects, and variable interactions.
Segment Analysis
By Component: Software Licensing Anchors Operator Control
Software accounted for 67.49% of the telecom network digital twin market in 2025, as carriers favored perpetual licenses that let internal teams tweak propagation models without renegotiating subscription terms. Services spanning integration, training, and managed analytics are pacing ahead at a 16.92% CAGR through 2031 because operators lack sufficient RF engineers with TensorFlow and Python fluency. Nokia bundles ready-made 3GPP connectors with AVA, yet most deployments still require 6 to 12 months of calibration support. Ericsson’s managed model goes further, with its analytics squad proposing weekly parameter adjustments based on twin output, an attractive option for Tier 2 carriers that run lean engineering benches.
Annual maintenance averages 18%-22% of license value, providing updates and new AI models that preserve model accuracy as frequency bands expand. The telecom network digital twin market size is tied to services, therefore rises steadily, even though software retains volume leadership. Upskilling programs continue as Vodafone disclosed that fewer than 15% of network staff have the coding knowledge needed to extend twin algorithms, reinforcing external-expert demand.


By Deployment Mode: Cloud Twins Accelerate on Consumption Economics
On-premise twins accounted for 45.32% of revenue in 2025 because low latency and data-sovereignty policies demand proximity to private data centers. The cloud sub-segment, however, grows at an 18.78% CAGR through 2031 as hyperscalers integrate telecom-specific modules into their generic platforms. Microsoft and Telefónica ran a hybrid scheme in which sensitive subscriber data remains within Spanish data centers while Azure hosts compute-intensive simulations. AWS launched a telecom-tuned TwinMaker in 2026 that can automatically load 3GPP cell configurations and generate coverage maps from satellite imagery, reducing deployment time to below 90 days for Dish Network and Rakuten Mobile.
Hybrid adoption shows the size of the telecom network digital twin market, balancing security with elastic compute. Europe leans on hybrid models to comply with GDPR, while China Mobile sticks to on-premises twins that sync every 50 milliseconds with 3 million base stations. Consumption pricing shifts capital peaks into predictable operating lines, and that accounting benefit is nudging CFOs toward cloud commitments.
By Network Domain: Edge Twins Rise With Latency-Sensitive Workloads
The radio access domain led 2025 value at 28.98% because dense small-cell grids and massive-MIMO beams require continuous tuning to maintain service quality. Edge and MEC twins, however, are sprinting at a 17.43% CAGR through 2031 as carriers place compute nodes near subscribers for gaming, autonomous transport, and industrial robotics. Verizon uses its Los Angeles edge twin to guarantee sub-10-millisecond response times across 200 MEC zones, a capability that helps win telemedicine contracts. SK Telecom simulates slice behavior inside its edge twin to reassure enterprise buyers that guaranteed-bitrate tiers remain intact at peak.
Core-network twins validate slice orchestration and failover, while transport twins check fiber and microwave paths that must sustain 25 Gbps fronthaul. OSS/BSS twins model how new tariff bundles ripple through billing stacks. Collectively, these domains drive broader adoption, yet edge remains the fastest-growing segment in the telecom network digital twin market.

By End-User: ISPs Accelerate for Fixed-Wireless Access
Communication service providers retained 32.63% spending share in 2025, reflecting broad domain coverage from RAN to BSS. Internet service providers, though, grow 17.02% CAGR as they scale fixed-wireless rollouts that require spectrum-sharing simulations. Verizon uses a twin to pre-qualify rooftop signal levels, reducing failed truck rolls by 23%. T-Mobile maps CBRS coexistence across macro and enterprise private networks to avoid harmful interference.
Tower companies and neutral-host firms pilot twins to test structural loads before adding radios, with American Tower using reduced-order models from Akselos to assess wind resistance on existing masts. Private network operators adopt lighter-weight twins for campus coverage studies, expanding the addressable buyer base for the telecom network digital twin market.
Geography Analysis
North America contributed 29.87% of revenue in 2025 as Verizon, AT&T, and T-Mobile invested in Open RAN digital twins to streamline automated frequency coordination in the 6 GHz band required by the Federal Communications Commission. Carriers gain budget relief when twins cut drive tests and avert deployment delays linked to urban zoning. Cloud adoption also continues to advance, with AWS and Microsoft data centers providing operators with short latency loops.
Asia-Pacific climbs at a 16.98% CAGR toward 2031, fueled by China Mobile’s platform that ingests 500 terabytes of telemetry daily to trim base-station downtime by 19%. NTT ties twins into its IOWN photonic program to model end-to-end latency before commercial launch, attracting Sony and Toyota for industrial cases. India’s Department of Telecommunications encourages twins for rural planning, accelerating upgrades by Bharti Airtel and Reliance Jio across underserved villages.
Europe hovered near a 25% share in 2025, yet commands innovation leadership on energy optimization. Orange, Vodafone, and Deutsche Telekom apply sleep-mode scheduling twins to align with European Green Deal carbon targets. ETSI issued draft synchronization security guidelines in early 2026, addressing cyber risks flagged by the EU Agency for Cybersecurity, and vendors with hardened credential management now carry a compliance edge. South America and the Middle East and Africa together held roughly one-fifth of 2025 sales. Brazil’s TIM and Saudi Arabia’s stc run pilots that use Ericsson and Huawei twins for 5G planning, showcasing momentum that could narrow the regional gap post-2027.

Competitive Landscape
The telecom network digital twin market is moderately fragmented. Infrastructure majors Nokia, Ericsson, and Huawei jointly hold a significant market share by bundling RF hardware, telemetry APIs, and twin analytics into turnkey suites. Hyperscalers Microsoft, AWS, and Google reach roughly a 25% share by embedding telecom templates in their horizontal platforms, offering elastic compute and fast onboarding. Specialists such as VIAVI Solutions, Spirent Communications, and Keysight Technologies capture 15%-20% through high-fidelity test-data synthesis that stresses twins under peak loads.
Strategy diverges along vertical versus horizontal lines. Equipment incumbents deepen integration, as illustrated by Nokia’s 2025 purchase of Ananki, which integrated reinforcement learning into AVA for closed-loop optimization, where the twin both simulates and executes parameter changes. Cloud players favor open ecosystems and rely on O-RAN’s E2 and A1 specs to enable independent software vendors to augment their stacks without hardware lock-in.
White-space opportunities persist around multi-vendor schema alignment and rural traffic modeling. Vendors that solve unified telemetry ingestion or produce AI-curated synthetic data for low-density geographies can claim premium pricing. Regulations also shape competition; ETSI’s forthcoming security norms will favor suppliers with mature cybersecurity portfolios, such as IBM and Siemens. Performance hinges on GPU efficiency; Ericsson and Samsung optimize for NVIDIA’s Sionna stack, yielding simulation runtimes that are 30% faster on H100 silicon, a differentiator when operators model entire metro footprints overnight.
Telecom Network Digital Twin Industry Leaders
Nokia Corporation
Telefonaktiebolaget LM Ericsson
Huawei Technologies Co., Ltd.
Microsoft Corporation
VIAVI Solutions Inc.
- *Disclaimer: Major Players sorted in no particular order

Recent Industry Developments
- November 2025: The telecom industry is advancing toward faster, smarter, and sustainable network deployment. Ericsson leads this shift with the Ericsson Site Digital Twin, revolutionizing how operators plan, design, build, and optimize networks. By integrating BIM, LiDAR, drone-based data capture, and AI-driven automation, it delivers a geospatially accurate 3D model, consolidating structural, electrical, and RF data into a single authoritative source throughout the network lifecycle.
- March 2025: Ericsson, Volvo Group, and Bharti Airtel have partnered to accelerate Industry 4.0 and 5.0 adoption in India by leveraging 5G, XR, Digital Twin Technologies, and AI to transform manufacturing operations, enhance training, and optimize processes in real time.


Global Telecom Network Digital Twin Market Report Scope
The Telecom Network Digital Twin Market Report is Segmented by Component (Software and Services), Deployment Mode (Cloud-Based, On-Premise, and Hybrid), Network Domain (Radio Access Network (RAN), Core Network, Transport/Backhaul, Edge/MEC, and Other Network Domains (OSS/BSS)), End-User (Communication Service Providers (CSPs), Mobile Network Operators (MNOs), Tower Companies, Internet Service Providers (ISPs), and Other End-users), and Geography (North America, South America, Europe, Asia-Pacific, and Middle East and Africa). The Market Forecasts are Provided in Terms of Value (USD).
| Software |
| Services |
| Cloud-Based |
| On-Premise |
| Hybrid |
| Radio Access Network (RAN) |
| Core Network |
| Transport/Backhaul |
| Edge/MEC |
| Other Network Domains (OSS/BSS) |
| Communication Service Providers (CSPs) |
| Mobile Network Operators (MNOs) |
| Tower Companies |
| Internet Service Providers (ISPs) |
| Other End-users |
| North America | United States |
| Canada | |
| Mexico | |
| South America | Brazil |
| Argentina | |
| Rest of South America | |
| Europe | Germany |
| United Kingdom | |
| France | |
| Italy | |
| Spain | |
| Russia | |
| Rest of Europe | |
| Asia-Pacific | China |
| Japan | |
| South Korea | |
| India | |
| ASEAN | |
| Rest of Asia-Pacific | |
| Middle East and Africa | GCC |
| South Africa | |
| Nigeria | |
| Rest of Middle East and Africa |
| By Component | Software | |
| Services | ||
| By Deployment Mode | Cloud-Based | |
| On-Premise | ||
| Hybrid | ||
| By Network Domain | Radio Access Network (RAN) | |
| Core Network | ||
| Transport/Backhaul | ||
| Edge/MEC | ||
| Other Network Domains (OSS/BSS) | ||
| By End-User | Communication Service Providers (CSPs) | |
| Mobile Network Operators (MNOs) | ||
| Tower Companies | ||
| Internet Service Providers (ISPs) | ||
| Other End-users | ||
| By Geography | North America | United States |
| Canada | ||
| Mexico | ||
| South America | Brazil | |
| Argentina | ||
| Rest of South America | ||
| Europe | Germany | |
| United Kingdom | ||
| France | ||
| Italy | ||
| Spain | ||
| Russia | ||
| Rest of Europe | ||
| Asia-Pacific | China | |
| Japan | ||
| South Korea | ||
| India | ||
| ASEAN | ||
| Rest of Asia-Pacific | ||
| Middle East and Africa | GCC | |
| South Africa | ||
| Nigeria | ||
| Rest of Middle East and Africa | ||


Key Questions Answered in the Report
How fast is the telecom network digital twin market expected to grow through 2031?
Revenue is projected to rise from USD 2.73 billion in 2026 to USD 5.89 billion by 2031, equating to a 16.62% CAGR.
Which component leads spending today?
Software dominates with 67.49% share, though integration and managed-analytics services are advancing at a 16.92% CAGR.
Why are cloud-based twins gaining momentum?
Consumption pricing and hyperscaler templates cut rollout time below 90 days and shift heavy GPU costs from capital budgets to operating bills.
What is the main restraint limiting smaller operators?
High-fidelity ray-tracing twins need expensive GPU clusters that can top USD 5 million per metro, pressuring Tier 2-3 carriers.
Which geography shows the fastest growth?
Asia-Pacific is advancing at a 16.98% CAGR as China, Japan, and India scale nationwide twin deployments.
How do digital twins help reduce network energy use?
Twins predict low-traffic windows and recommend cell sleep schedules, enabling operators like Orange France to cut RAN electricity consumption 9% without hurting service quality.
Page last updated on:


