Telecom Network Densification Market Size and Share
Market Overview
| Study Period | 2020 - 2031 |
|---|---|
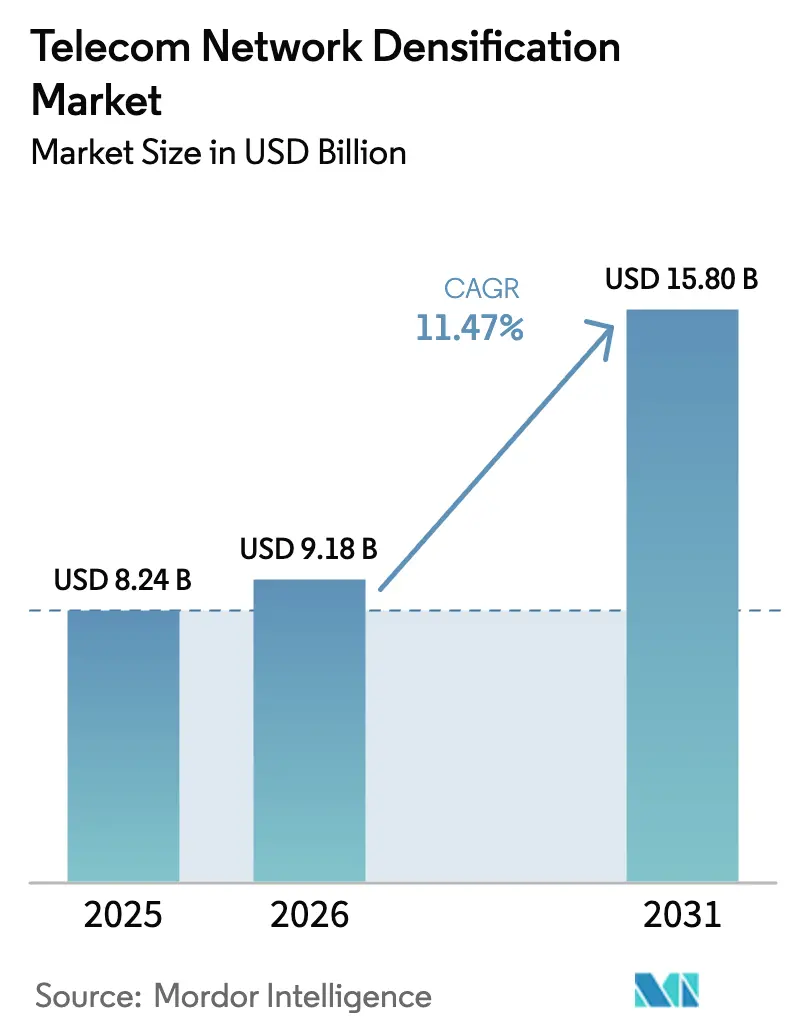
| Market Size (2026) | USD 9.18 Billion |
| Market Size (2031) | USD 15.80 Billion |
| Growth Rate (2026 - 2031) | 11.47% CAGR |
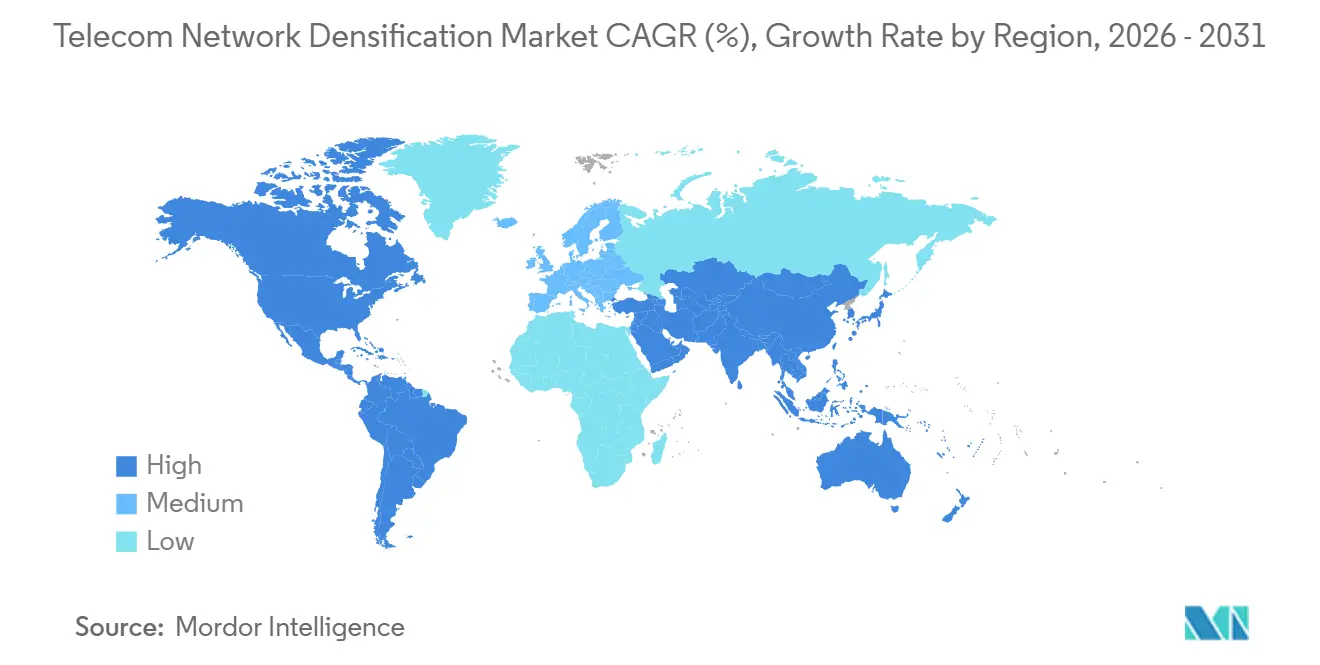
| Fastest Growing Market | Asia Pacific |
| Largest Market | North America |
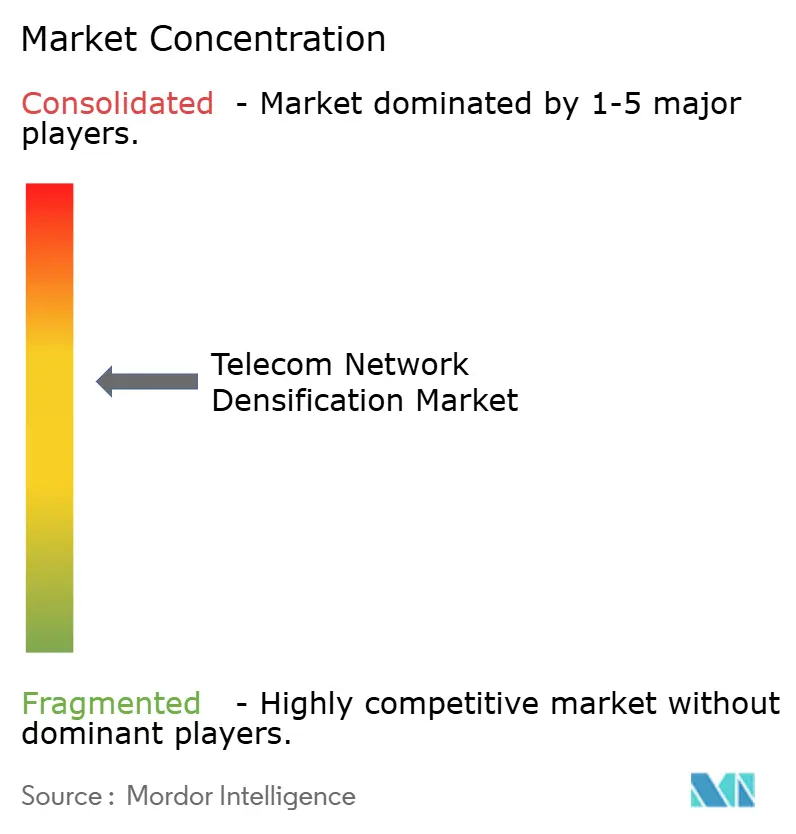
| Market Concentration | Medium |
Major Players *Disclaimer: Major Players sorted in no particular order Image © Mordor Intelligence. Reuse requires attribution under CC BY 4.0. | |
Telecom Network Densification Market Analysis by Mordor Intelligence
The Telecom Network Densification Market size is expected to grow from USD 8.24 billion in 2025 to USD 9.18 billion in 2026 and is forecast to reach USD 15.80 billion by 2031 at 11.47% CAGR over 2026-2031. Operators are accelerating deployments of small cells, distributed antenna systems, and millimeter-wave nodes because monthly mobile data traffic jumped 25% year-on-year through 2025, while macro-cell capacity in dense districts plateaued. Indoor systems dominate because stadiums, airports, and enterprise campuses demand guaranteed coverage, yet streamlined street-level permitting is unlocking a second growth wave for outdoor nodes. Hybrid sub-6 GHz plus mmWave architectures are gaining traction as carriers blend wide-area reach with multi-gigabit hotspots, and neutral-host business models are expanding as building owners monetize shared infrastructure. Government 5G stimulus programs further reduce risk, but backhaul fiber scarcity and fragmented municipal rules continue to temper rollout velocity.
Key Report Takeaways
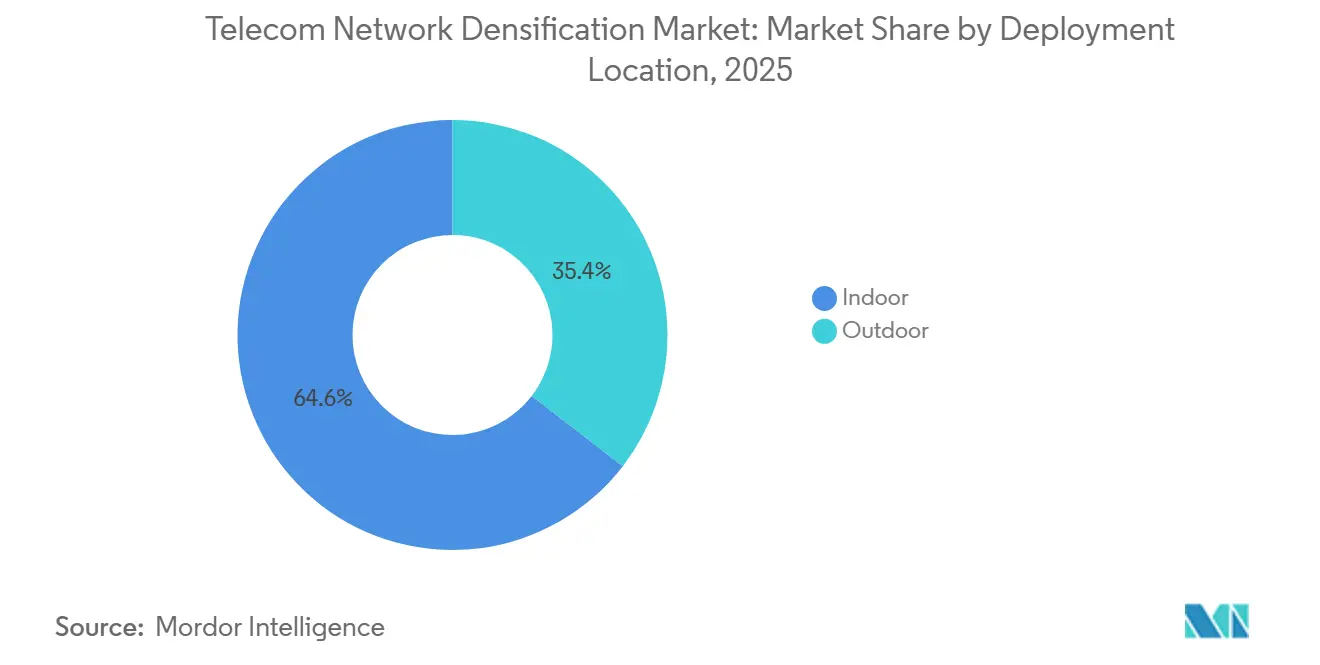
- By deployment location, indoor deployments commanded 64.56% of the Telecom network densification market share in 2025, while outdoor small-cell installations are projected to post the fastest growth at a 12.41% CAGR through 2031.
- By spectrum band, sub-6 GHz commanded 43.91% of the Telecom network densification market share in 2025, while hybrid sub-6 + mmWave are projected to post the fastest growth at a 12.98% CAGR through 2031.
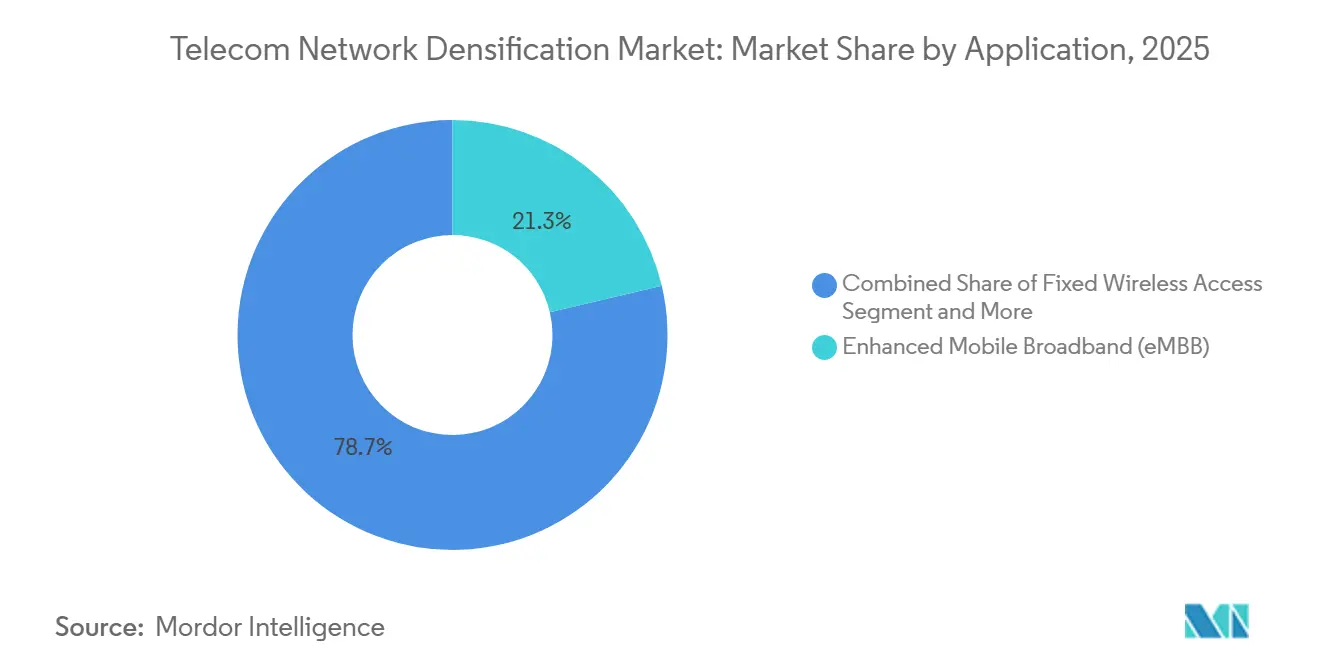
- By application, enhanced mobile broadband remained the top spending category at 21.33% of 2025 revenue, yet mission-critical and public-safety applications will record the quickest advance at an 11.98% CAGR through 2031.
- By end user, telecom operators accounted for 24.32% of revenue in 2025, but neutral-host providers are on track for the sharpest climb, with a 12.13% CAGR, reflecting growing reliance on shared assets.
- By geography, North America held the largest regional position at 24.56% in 2025, whereas Asia-Pacific is expected to register the most robust expansion at a 13.04% CAGR through 2031.
Note: Market size and forecast figures in this report are generated using Mordor Intelligence’s proprietary estimation framework, updated with the latest available data and insights as of January 2026.
Global Telecom Network Densification Market Trends and Insights
Drivers Impact Analysis*
| Driver | (~) % Impact on CAGR Forecast | Geographic Relevance | Impact Timeline |
|---|---|---|---|
| Surging Mobile Data Traffic and 5G Subscription Growth | +2.8% | Global, peak impact in APAC and North America | Short term (≤ 2 years) |
| Urban Capacity Crunch Spurring Small-Cell and mmWave Rollout | +2.3% | North America, Europe, APAC tier-1 cities | Medium term (2-4 years) |
| Government and Operator 5G Infrastructure Investments | +1.9% | North America, Europe, GCC, India, China | Medium term (2-4 years) |
| Enterprise/Private-5G Demand for Ultra-Low-Latency Links | +1.6% | Global, concentrated in manufacturing hubs (Germany, Japan, U.S.) | Long term (≥ 4 years) |
| AI-Optimized Smart Repeaters Lowering Deployment CAPEX | +1.2% | Global, early adoption in cost-sensitive markets (India, Southeast Asia) | Long term (≥ 4 years) |
| Integrated Access and Backhaul (IAB) Enabling Fiber-Lean Roll-Outs | +1.1% | APAC, MEA, rural North America | Long term (≥ 4 years) |
| Source: Mordor Intelligence | |||
Surging Mobile Data Traffic and 5G Subscription Growth
Global mobile data consumption reached 140 exabytes per month in 2025, a 25% increase from 2024, and 5G subscriptions are on track to reach 5.6 billion by 2029. Macro-cell throughput in high-density corridors now levels off at around 10 Gbps, even with advanced carrier aggregation, compelling operators to increase site counts. Video streaming and cloud gaming already account for 70% of traffic, and forthcoming extended-reality services will further intensify uplink demand. Early movers that densify networks secure premium subscribers seeking stable gigabit performance, whereas laggards risk churn toward rivals with consistent quality of experience. Equipment vendors benefit as operators bundle densification with edge compute, raising average selling prices. Consequently, the Telecom network densification market continues to post double-digit gains despite macroeconomic uncertainty.
Urban Capacity Crunch Spurring Small-Cell and mmWave Rollout
Cell-edge throughput in inner-city hot spots often dips below 50 Mbps during evening peaks, even under full 5G macro coverage, mainly due to interference and high user density. [1]Small Cell Forum, “Small-Cell Deployment,” Smallcellforum.org Carriers therefore affix small cells to lamp posts, utility poles, and façades to shrink the radio footprint and lift per-user bandwidth. EE, for instance, activated more than 1,500 urban small cells across London by mid-2025, relieving traffic on congested macro layers. [2]EE, “Network Expansion,” Ee.co.uk However, mmWave radios experience 20-30 dB higher path loss than sub-6 GHz radios, requiring 5-10 times as many sites to blanket the same geography. Municipalities that streamline single-touch permitting, such as San Jose’s “dig-once” policy, attract greater operator capital, whereas fragmented approval chains can delay node activation by over a year.
Government and Operator 5G Infrastructure Investments
The U.S. Broadband Equity, Access, and Deployment program earmarked USD 42.45 billion through 2026, including USD 1.5 billion for Open RAN pilots, to accelerate rural densification. [3]NTIA, “Broadband Equity, Access, and Deployment Program,” Ntia.gov China’s Ministry of Industry and Information Technology targets 3.6 million 5G base stations by end-2025, with provincial subsidies covering small-cell rollouts in industrial parks. Europe’s Connecting Europe Facility allocates EUR 2 billion for cross-border 5G corridors that rely on dense roadside nodes. These injections lower operator risk profiles, prompt earlier orders for radio-access gear, and widen addressable revenue for neutral-host suppliers. Yet diverging interface preferences, Open RAN in the United States, 5G-ACIA in the EU, and 5G-A in China, force vendors to budget parallel development paths, diluting economies of scale.
Enterprise/Private-5G Demand for Ultra-Low-Latency Links
By late 2025, more than 400 private 5G networks will be live worldwide, predominantly inside factories, ports, and logistics hubs where deterministic sub-100-millisecond latency is mandatory. Manufacturers deploy in-building small cells to ensure automated guided vehicles and robotic arms maintain uninterrupted connectivity. Germany’s Bosch now runs dedicated 5G systems in 10 plants, cutting predictive-maintenance cycle times by 25%. Private deployments accelerate sales of plug-and-play small cells supporting enterprise spectrum such as 3.7-3.8 GHz in Germany and CBRS in the United States. Consequently, the Telecom network densification market witnesses incremental demand that is largely decoupled from public mobile CAPEX cycles, smoothing revenue volatility.
Restraints Impact Analysis*
| Restraint | (~) % Impact on CAGR Forecast | Geographic Relevance | Impact Timeline |
|---|---|---|---|
| Complex Site Acquisition and Permitting in Dense Cities | -1.4% | North America, Europe, Asia-Pacific tier-1 cities | Short term (≤ 2 years) |
| Backhaul-Fiber Availability and Cost Constraints | -1.2% | Rural North America, emerging Asia-Pacific, MEA, South America | Medium term (2-4 years) |
| DL/UL Power Imbalance at mmWave Bands | -0.7% | Global, acute in mmWave-heavy deployments (U.S., Japan, South Korea) | Long term (≥ 4 years) |
| Energy-Use Escalation Vs. Sustainability Targets | -0.9% | Europe, North America, select Asia-Pacific markets with carbon mandates | Long term (≥ 4 years) |
| Source: Mordor Intelligence | |||
Complex Site Acquisition and Permitting in Dense Cities
Municipal codes drafted for macro towers seldom accommodate devices the size of a backpack bolted to streetlights. New York City historically required up to 24 months for approvals, whereas Los Angeles cut timelines to 90 days via a master license on all city-owned poles. The federal caps of USD 270 per node annually, imposed by the FCC in 2018, are facing ongoing legal challenges, creating uncertainty for CAPEX planning. Carriers deploying thousands of nodes must negotiate with transportation, public works, and heritage bodies, each with its own workflows. Neutral-host aggregators reduce red tape but often capture 30-40% margins, increasing the total cost of ownership. Hence, slow permitting remains the most immediate drag on the expansion of the Telecom network densification market in capital-intensive urban cores.
Backhaul-Fiber Availability and Cost Constraints
Fiber lays claim to being the gold-standard backhaul medium, yet trenching in dense downtowns can cost more than USD 150,000 per kilometer, while rural builds often double that figure. Operators confront a build-versus-lease dilemma: constructing fiber strands balance sheets for 12-18 months, while leasing strands from incumbents can run USD 1,000-2,000 per site per month and lock carriers into decade-long contracts. Wireless backhaul, microwave, or IAB, deploys quickly but reduces spectral efficiency and raises latency by 5-10 milliseconds per hop. Verizon leverages IAB in fiber-scarce U.S. counties to cut build times from six months to six weeks. In the absence of open-access mandates, the backhaul bottleneck could shave up to 1.2 percentage points off the forecast CAGR.
*Our forecasts treat driver/restraint impacts as directional, not additive. The impact forecasts reflect baseline growth, mix effects, and variable interactions.
Segment Analysis
By Deployment Location: Enterprises Drive Indoor Dominance
Indoor sites accounted for 64.56% of 2025 revenue, the largest Telecom network densification market share for any single segment. Airports, arenas, and corporate campuses deliver concurrent user densities above 50,000 per square kilometer, far exceeding outdoor macro limits. Indoor small cells and distributed-antenna systems thus enable 10-to-100-fold capacity gains per square meter. Municipalities rarely govern in-building installations, allowing property owners to contract with neutral hosts directly and minimizing permitting delays.
Outdoor nodes will grow at a 12.41% CAGR, powered by lamp-post and utility-pole deployments along transit and retail corridors. FCC preemption of excessive municipal fees trimmed average approval timelines from 18 months to under 90 days in compliant jurisdictions. Cities adopting master-license frameworks consolidate power supply, pole access, and fiber attachment requests, reducing operator friction. Balanced build plans, indoor for guaranteed quality and outdoor for mobility, help carriers achieve uniform gigabit service and maximize Telecom network densification market size returns.


By Spectrum Band: Hybrid Architectures Gain Traction
Sub-6 GHz coverage preserved 43.91% of 2025 spending because a 500–1,000-meter radius keeps site counts and CAPEX manageable. However, hybrid sub-6 GHz + mmWave approaches will post a 12.98% CAGR through 2031 as operators layer wide-area coverage with multi-gigabit hotspots. The United States’ USD 81 billion C-band auction set the pace, while Japan’s NTT Docomo achieved 4 Gbps downlink in Tokyo’s Shibuya district using 28 GHz mmWave within 100 meters of base stations.
Pure mmWave remains specialized for stadiums, airports, and dense downtown blocks, due to 20-30 dB higher path loss than sub-6 GHz. Release-17 dual-connectivity enables devices to connect to both bands simultaneously, optimizing spectral efficiency and user experience. Operators mastering interference mitigation and load balancing across heterogeneous bands protect spectrum ROI and expand the Telecom network densification market.
By Application: Mission-Critical Use Cases Accelerate
Enhanced mobile broadband occupied 21.33% of 2025 turnover, driven by streaming, gaming, and social media consumption. Mission-critical and public-safety projects, however, will register the briskest 11.98% CAGR as agencies require 99.999% availability and sub-100-millisecond latency. FirstNet’s dedicated LTE grid in the United States is migrating to 5G for drone video feeds and situational analytics. Fixed-wireless access surpassed 5.6 million subscribers at T-Mobile by the end of 2025, demonstrating that densified 5G can rival fiber for suburban households.
Industrial IoT and Industry 4.0 drive private-network rollouts in factories where deterministic latency underpins robotics and machine vision. Barcelona’s 1,200 smart-city sensors exemplify municipal uptake, funneling environmental and traffic data over rooftop small cells. V2X pilots backed by USD 1.1 billion in U.S. Department of Transportation grants highlight the breadth of densification demand beyond consumer broadband.

By End User: Neutral Hosts Reshape Economics
Telecom carriers delivered 24.32% of 2025 spend, yet neutral-host specialists and infrastructure funds now underwrite multi-operator nodes, drawing a projected 12.13% CAGR through 2031. Crown Castle already manages 115,000 U.S. small-cell nodes and captures 35-40% gross-margin leasing capacity for multiple carriers. Enterprises wield dedicated spectrum to run closed 5G LANs in hospitals, logistics hubs, and factories; Bosch’s deployments across 10 German plants showcase the trend.
Public-safety agencies and defense bodies also deploy isolated small-cell grids for resilience, including USD 600 million in U.S. Department of Defense contracts favoring Open RAN for vendor diversity. Residential femtocells bolster indoor voice coverage, but their revenue share remains modest. The structural pivot toward shared assets and enterprise self-provisioning widens the Telecom network densification industry serviceable market and spreads risk across a broader customer base.
Geography Analysis
North America retained 24.56% of 2025 turnover, underpinned by C-band deployments and the activation of 50,000 new small cells during the year. Canada’s nationwide 3.5 GHz rollout extends coverage to rural communities, while Mexico’s infrastructure-sharing mandate unlocks lower-CAPEX expansions. Robust neutral-host ecosystems and clear permitting rules keep investment momentum high, though heritage zones remain deployment bottlenecks.
Asia-Pacific is set to outpace every region, with a 13.04% CAGR through 2031, and will soon command the largest Telecom network densification market share. China Mobile alone operates 2.3 million 5G base stations, while India’s Jio and Airtel plan to deploy 1 million small cells by 2027. Japan and South Korea lead mmWave adoption, while ASEAN nations accelerate auctions to fuel digital-economy goals. Governmental subsidies and industrial-park incentives minimize risk and concentrate early densification in high-GDP corridors.
Europe maintains a mid-teens share, and the EU’s 5G Action Plan mandates coverage along all transport corridors by 2030, which translates into dense roadside node deployments. GCC nations leverage smart-city visions, the Dubai Expo, and Saudi Vision 2030 to densify networks swiftly, generating high per-user revenue. Africa and South America lag but exhibit high percentage growth from low bases, with Nigeria’s and Brazil’s recent spectrum awards jump-starting pilot rollouts. Diverse regulatory rhythms mean global vendors must tailor their go-to-market strategies by region to capture their share of the growth in the Telecom network densification market.

Competitive Landscape
The top five equipment suppliers, Ericsson, Nokia, Huawei, Samsung, and ZTE, hold a significant share of global radio-access revenue, yet over 20 smaller firms address small-cell, Open RAN, and neutral-host niches. Mavenir and Parallel Wireless scored U.S. Open RAN wins, notably Dish Network’s greenfield estate, while JMA Wireless specializes in stadium upgrades. Airspan and Baicells focus on private LTE/5G for manufacturing and rural fixed-wireless access, respectively.
Technology leadership hinges on AI-native orchestration and energy efficiency. Ericsson’s RAN Intelligent Controller trimmed dropped-call rates 30% across 10,000 urban nodes via reinforcement learning. Nokia’s ReefShark chipset slashed small-cell power draw by 40%, helping operators meet sustainability targets.
Qualcomm’s integrated SoCs lower the bill of materials, seeding a broader vendor base. Still, only 15% of Open RAN sites achieved true multi-vendor interoperability by 2025, highlighting standards that are maturing but still unfinished. Regulatory levers vary sharply as the FCC now ties subsidies to Open RAN, whereas China bars foreign gear from critical cores, sustaining a geographically fragmented supplier landscape that both challenges and benefits Telecom network densification market participants.
Telecom Network Densification Industry Leaders
Huawei Technologies Co., Ltd.
Telefonaktiebolaget LM Ericsson (Ericsson)
Nokia Corporation
Samsung Electronics Co., Ltd.
ZTE Corporation
- *Disclaimer: Major Players sorted in no particular order

Recent Industry Developments
- March 2026: Nokia and Deutsche Telekom have expanded their collaboration to advance cloud-based, disaggregated, and AI-native RAN technologies. The enhanced 'Innovation Cooperation Program' focuses on Cloud RAN, open interfaces, and AI-driven RAN solutions for high-performance, multi-vendor mobile networks.
- March 2026: Beeline Uzbekistan, VEON Ltd.’s digital operator, and Rakuten Symphony, a Rakuten Group subsidiary, signed an MoU to advance Uzbekistan’s digital economy through Open RAN, AI-driven network intelligence, and next-gen digital platforms.
- February 2026: Huawei launched its MetaAAU small-cell platform in China, integrating 64-element massive MIMO antennas with AI-driven beamforming to achieve 5 Gbps peak throughput in dense urban areas. Samsung’s vRAN and Open RAN solutions, integrated in prior projects, enhanced the operator’s live network QoS and end-user experience, matching or surpassing traditional RAN performance and efficiency.


Global Telecom Network Densification Market Report Scope
The Telecom Network Densification Market Report is Segmented by Deployment Location (Indoor, Outdoor), Spectrum Band (Sub-6 GHz, Mmwave (24-71 GHz), and Hybrid Sub-6 + MmWave), Application (Enhanced Mobile Broadband (eMBB), Fixed Wireless Access (FWA), Industrial IoT/Industry 4.0, Smart Cities and Public Venues, Mission-Critical and Public Safety, Connected and Autonomous Mobility (V2X)), End User (Telecom Operators, Enterprises and Private-Network Hosts, Neutral-Host Providers, Government and Public Safety, Residential/Consumers), and Geography (North America, South America, Europe, Asia-Pacific, Middle East and Africa). The Market Forecasts are in Value (USD).
| Indoor |
| Outdoor |
| Sub-6 GHz |
| mmWave (24–71 GHz) |
| Hybrid Sub-6 + mmWave |
| Enhanced Mobile Broadband (eMBB) |
| Fixed Wireless Access (FWA) |
| Industrial IoT/Industry 4.0 |
| Smart Cities and Public Venues |
| Mission-Critical and Public Safety |
| Connected and Autonomous Mobility (V2X) |
| Telecom Operators |
| Enterprises and Private-Network Hosts |
| Neutral-Host Providers |
| Government and Public Safety |
| Residential/Consumers |
| North America | United States |
| Canada | |
| Mexico | |
| South America | Brazil |
| Argentina | |
| Rest of South America | |
| Europe | Germany |
| United Kingdom | |
| France | |
| Italy | |
| Spain | |
| Russia | |
| Rest of Europe | |
| Asia-Pacific | China |
| Japan | |
| South Korea | |
| India | |
| ASEAN | |
| Rest of Asia-Pacific | |
| Middle East and Africa | GCC |
| South Africa | |
| Nigeria | |
| Rest of Middle East and Africa |
| By Deployment Location | Indoor | |
| Outdoor | ||
| By Spectrum Band | Sub-6 GHz | |
| mmWave (24–71 GHz) | ||
| Hybrid Sub-6 + mmWave | ||
| By Application | Enhanced Mobile Broadband (eMBB) | |
| Fixed Wireless Access (FWA) | ||
| Industrial IoT/Industry 4.0 | ||
| Smart Cities and Public Venues | ||
| Mission-Critical and Public Safety | ||
| Connected and Autonomous Mobility (V2X) | ||
| By End User | Telecom Operators | |
| Enterprises and Private-Network Hosts | ||
| Neutral-Host Providers | ||
| Government and Public Safety | ||
| Residential/Consumers | ||
| By Geography | North America | United States |
| Canada | ||
| Mexico | ||
| South America | Brazil | |
| Argentina | ||
| Rest of South America | ||
| Europe | Germany | |
| United Kingdom | ||
| France | ||
| Italy | ||
| Spain | ||
| Russia | ||
| Rest of Europe | ||
| Asia-Pacific | China | |
| Japan | ||
| South Korea | ||
| India | ||
| ASEAN | ||
| Rest of Asia-Pacific | ||
| Middle East and Africa | GCC | |
| South Africa | ||
| Nigeria | ||
| Rest of Middle East and Africa | ||


Key Questions Answered in the Report
How large will spending on densification be by 2031?
The Telecom network densification market size is forecast to reach USD 15.8 billion by 2031 on an 11.47% CAGR.
Which deployment location is most lucrative for vendors?
Indoor sites commanded 64.56% of 2025 revenue, reflecting the strongest Telecom network densification market share today.
Why are hybrid sub-6 GHz + mmWave networks gaining momentum?
Operators blend the wide-area reach of sub-6 GHz with multi-gigabit mmWave hotspots, resulting in the fastest 12.98% CAGR among band strategies.
What limits densification rollouts in big cities?
Complex multi-agency permitting and scarce affordable backhaul fiber remain the two most significant bottlenecks.
Who benefits from neutral-host business models?
Building owners, infrastructure funds, and carriers all profit as neutral hosts cut site-acquisition risk and speed deployments.
Which region will expand fastest through 2031?
Asia-Pacific, led by China and India, is projected to grow at 13.04% CAGR, outstripping all other regions.
Page last updated on:


