Telecom Data Monetization Market Size and Share
Market Overview
| Study Period | 2020 - 2031 |
|---|---|
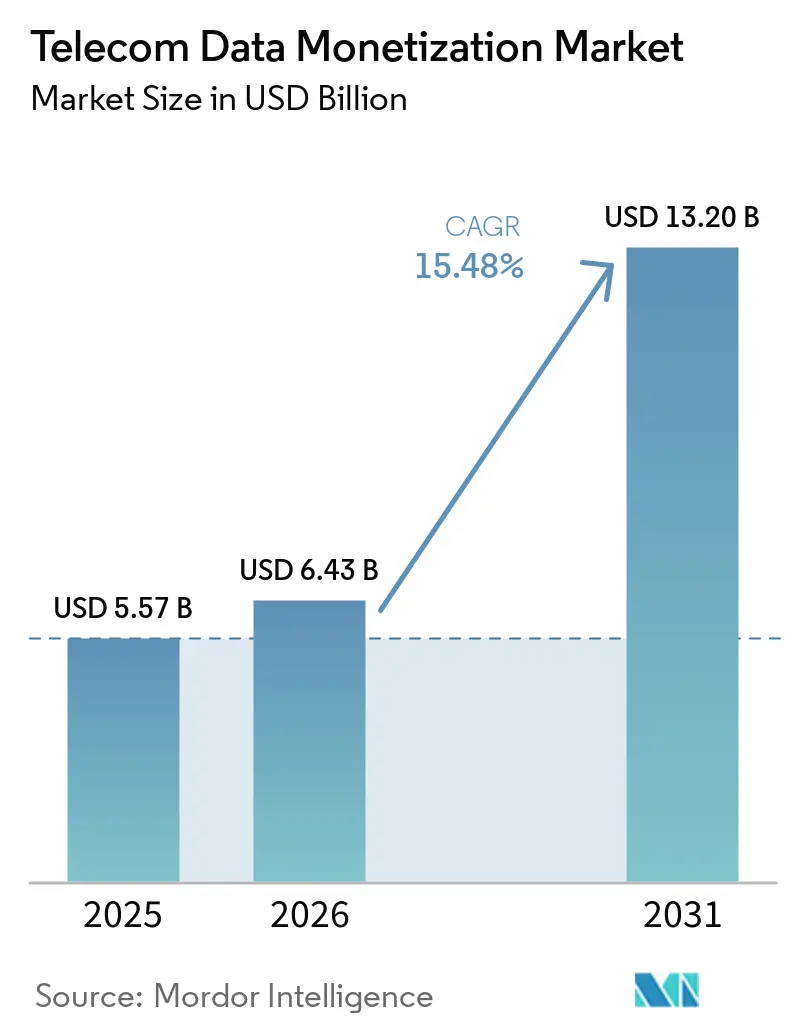
| Market Size (2026) | USD 6.43 Billion |
| Market Size (2031) | USD 13.20 Billion |
| Growth Rate (2026 - 2031) | 15.48% CAGR |
| Fastest Growing Market | Asia-Pacific |
| Largest Market | North America |
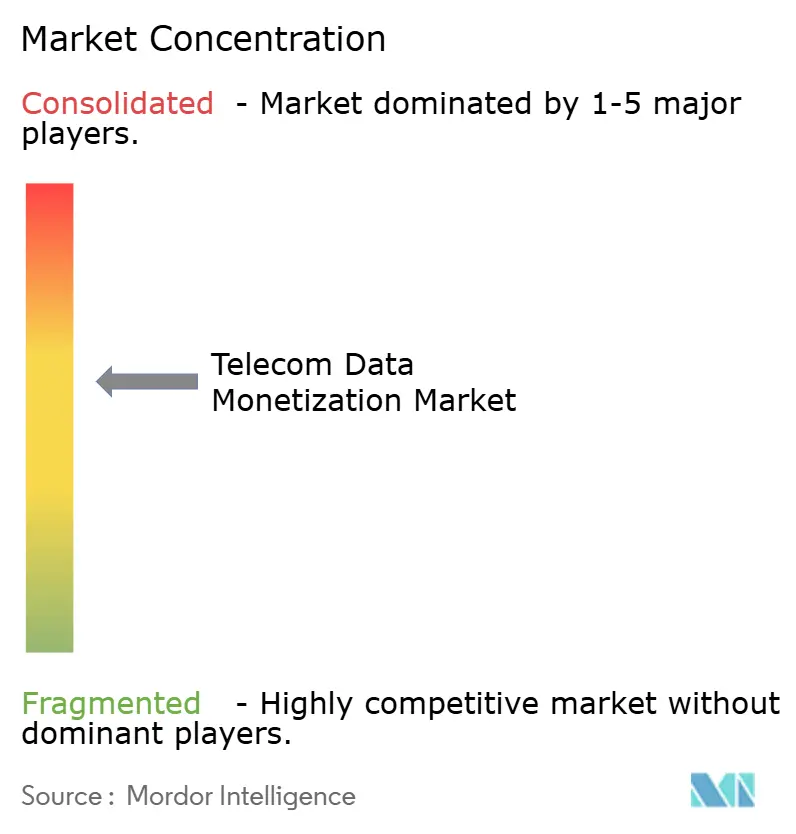
| Market Concentration | Medium |
Major Players *Disclaimer: Major Players sorted in no particular order Image © Mordor Intelligence. Reuse requires attribution under CC BY 4.0. | |
Telecom Data Monetization Market Analysis by Mordor Intelligence
The Telecom Data Monetization Market size is projected to be USD 5.57 billion in 2025, USD 6.43 billion in 2026, and reach USD 13.20 billion by 2031, growing at a CAGR of 15.48% from 2026 to 2031. Telcos are pivoting from volume-based connectivity toward insight-driven services that package network telemetry, real-time location intelligence, and behavioral analytics for enterprise consumption.[1]Amdocs Ltd., “Amdocs–Salesforce Partnership Announcement,” amdocs.com Platform solutions remain the backbone of these initiatives, yet fast-growing service lines are proving pivotal as operators outsource advanced data-science workloads and navigate tightening privacy rules. Containerized BSS stacks on public clouds shorten launch cycles for revenue-share models, while 5G-enabled edge nodes allow sub-10-millisecond response times demanded by autonomous vehicles and industrial IoT. Regulatory fragmentation, tariff volatility on networking hardware, and data-science talent scarcity temper near-term upside but have not derailed capital allocation as operators view data monetization as the key hedge against flattening mobile ARPU.
Key Report Takeaways
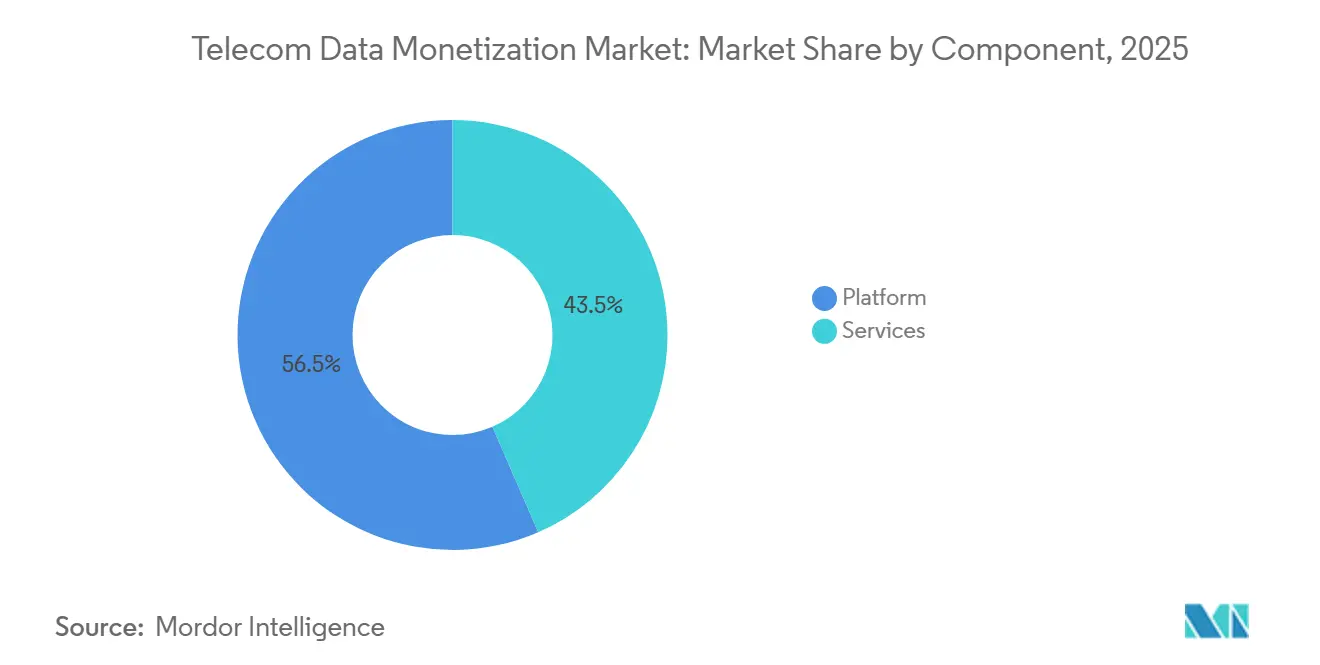
- By component, platform offerings led with 56.53% of Telecom data monetization market share in 2025, and Services are projected to expand at a 17.02% CAGR through 2031, the fastest among all components.
- By deployment mode, on-premises held 58.73% of the Telecom data monetization market in 2025, whereas cloud deployments will grow at a 17.66% CAGR through 2031.
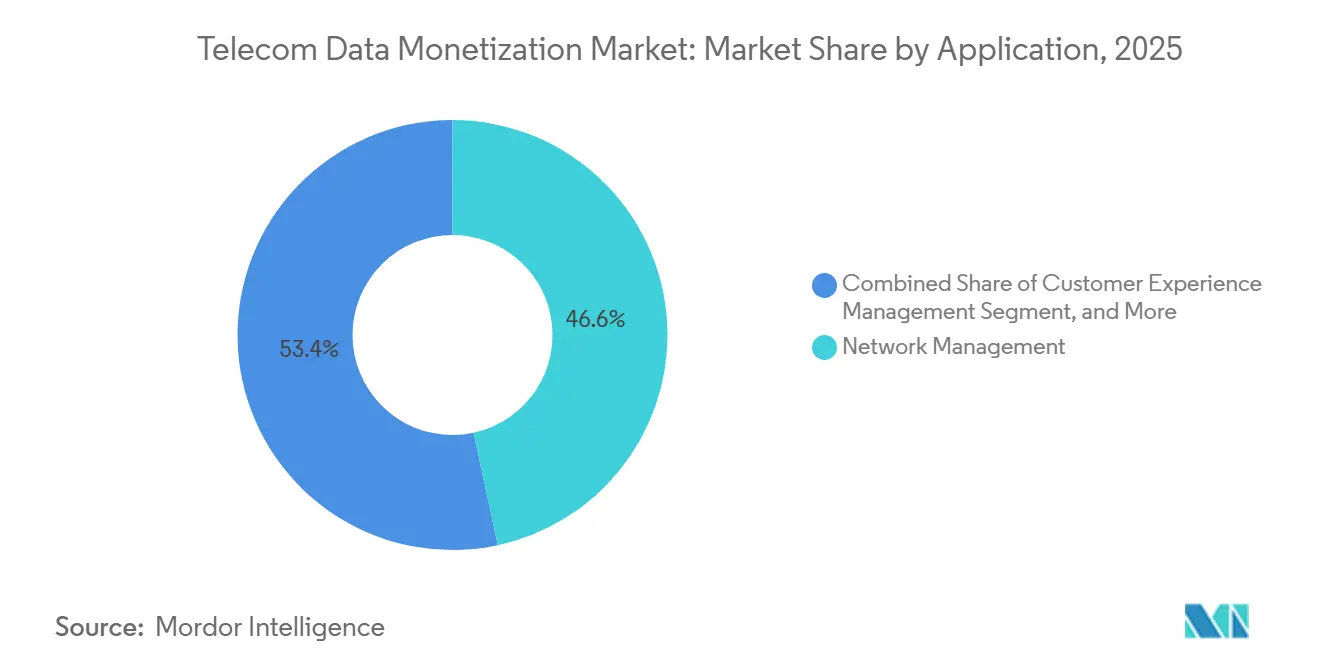
- By application, network management commanded 46.62% of the Telecom data monetization market share in 2025; customer experience management is advancing at an 18.48% CAGR through 2031.
- By end user, telecom operators accounted for 62.12% of the 2025 revenue of the Telecom data monetization market, yet enterprise demand is rising at an 18.31% CAGR as data-as-a-service gains traction.
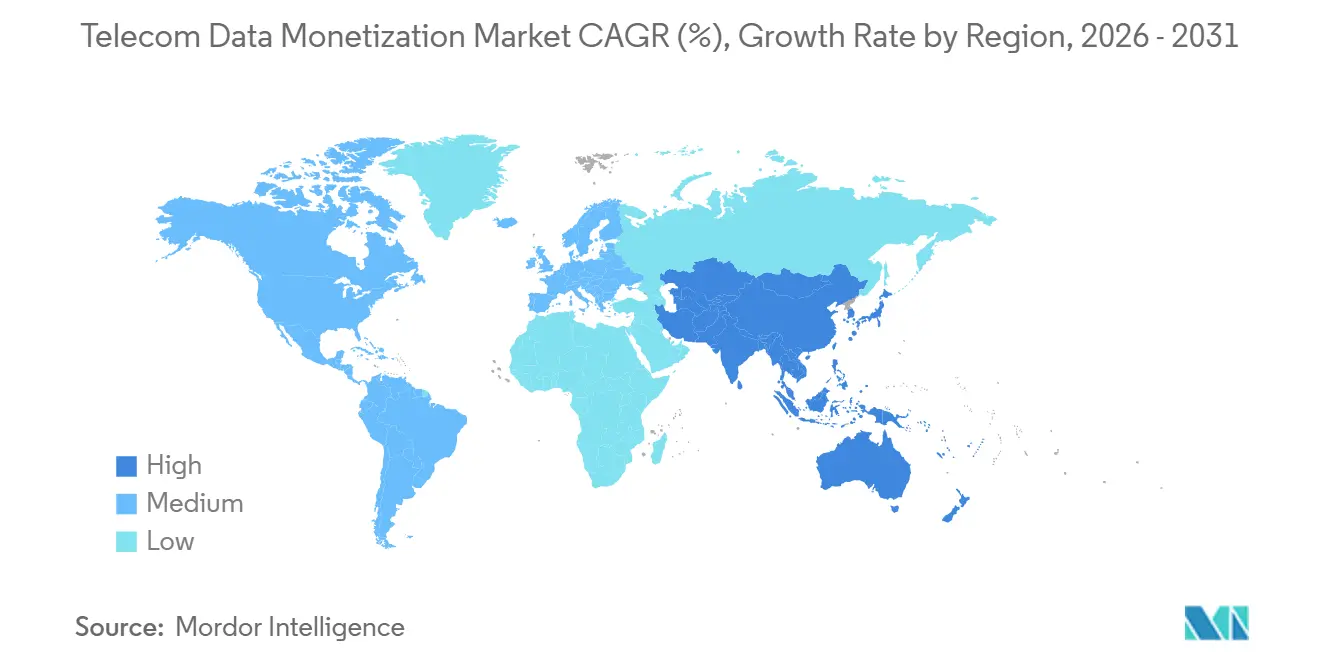
- By geography, North America contributed 38.91% of the global revenue of the Telecom data monetization market in 2025, while the Asia-Pacific is forecast to post the fastest regional CAGR of 19.03% through 2031.
Note: Market size and forecast figures in this report are generated using Mordor Intelligence’s proprietary estimation framework, updated with the latest available data and insights as of January 2026.
Global Telecom Data Monetization Market Trends and Insights
Drivers Impact Analysis*
| Driver | ( ~ ) % Impact on CAGR Forecast | Geographic Relevance | Impact Timeline |
|---|---|---|---|
| Rapid Surge in Data Volume from 5G Networks | +3.2% | Global, with early leadership in North America, China, South Korea, and GCC markets | Medium term (2-4 years) |
| Growing Adoption of Cloud-Native Monetization Platforms | +2.8% | North America and Europe core, expanding into Asia Pacific and Latin America | Short term (≤ 2 years) |
| Rising Demand for Personalized Customer Experiences | +2.5% | Global, particularly strong in mature markets with high smartphone penetration | Medium term (2-4 years) |
| Expansion of IoT and Edge Analytics Use-Cases | +2.3% | Asia Pacific leadership, followed by North America and Europe industrial corridors | Long term (≥ 4 years) |
| Emergence of Telco-Led Federated Data Marketplaces | +1.9% | Europe and Asia Pacific early adopters, gradual uptake in North America | Long term (≥ 4 years) |
| Proliferation of Privacy-Enhancing Computation Enabling Cross-Carrier Insight Trading | +1.6% | Europe regulatory-driven adoption, followed by North America and select Asia Pacific markets | Long term (≥ 4 years) |
| Source: Mordor Intelligence | |||
Rapid Surge in Data Volume from 5G Networks
5G subscribers now generate 10-100× more traffic than 4G counterparts, offering an unprecedented substrate for real-time analytics. Verizon disclosed that its 5G users averaged 47 GB of monthly consumption in 2025, more than double that of 4G cohorts. AT&T’s Aduna API platform capitalized on this traffic by producing USD 180 million of incremental revenue during its first year of operation.[2]AT&T Inc., “AT&T Launches Aduna Network API Platform,” att.com China Mobile processed 3.2 exabytes per month at edge nodes fitted to 5G base stations, unlocking low-latency industrial IoT contracts. Analyst estimates indicate that edge-enabled revenue streams could underpin 40% of enterprise 5G monetization by 2028.
Growing Adoption of Cloud-Native Monetization Platforms
Cloud-native stacks decouple monetization logic from legacy billing, cutting release cycles from quarters to weeks. Proximus migrated its entire BSS to Nokia’s AVA cloud platform in 2025, trimming operational costs by 22% and slashing product-launch lead times to 14 days. LotusFlare’s platform delivered similar agility for SoftBank and Taiwan Mobile, compressing launch timelines to under two weeks. Salesforce and Amdocs unified their CRM and AI monetization engines, enabling real-time journey orchestration that increased net promoter scores by 23% within 6 months.
Rising Demand for Personalized Customer Experiences
Transformer-based models enable telcos to forecast churn 90 days ahead with 87% accuracy, letting operators trigger proactive retention offers that reduce monthly churn by up to 1.8 percentage points. Deutsche Telekom’s AI chatbot, introduced in March 2025, now resolves 68% of inquiries without escalation. Such hyper-personalization not only curbs churn but also creates sellable propensity scores that brands embed into marketing campaigns.
Expansion of IoT and Edge Analytics Use-Cases
Cellular IoT connections surpassed 2.8 billion in 2025. Ericsson’s Intelligent Automation Platform, deployed at Telefónica Spain, predicts grid failures 72 hours in advance, enabling utilities to avoid penalties. Orange processes in-vehicle video at the edge to reroute fleets in real-time, monetizing the service through per-vehicle fees. China Telecom’s industrial IoT revenue grew 34% YoY in 2025, validating the effectiveness of outcome-based pricing models.
Restraints Impact Analysis*
| Restraint | ( ~ ) % Impact on CAGR Forecast | Geographic Relevance | Impact Timeline |
|---|---|---|---|
| Stringent Data Privacy and Sovereignty Regulations | -2.1% | Europe leadership in enforcement, followed by North America and select Asia Pacific markets | Short term (≤ 2 years) |
| Legacy IT and OSS/BSS Integration Complexity | -1.8% | Global, particularly acute in North America and Europe with decades-old infrastructure | Medium term (2-4 years) |
| Escalating Tariff-Driven Hardware Cost Volatility | -1.3% | Global supply-chain impact, most severe in emerging markets with limited local manufacturing | Short term (≤ 2 years) |
| Shortage of Telecom-Specific Data Science Talent | -1.1% | Global, with highest intensity in North America, Europe, and developed Asia Pacific markets | Long term (≥ 4 years) |
| Source: Mordor Intelligence | |||
Stringent Data Privacy and Sovereignty Regulations
GDPR fines have almost doubled since 2024, with Meta’s EUR 1.2 billion (USD 1.4 billion) verdict spotlighting cross-border risk. TikTok’s EUR 345 million (USD 404 million) penalty over children’s data triggered sector-wide audits.[3]TikTok Inc., “GDPR Penalty Statement,” newsroom.tiktok.com Vodafone spent GBP 120 million (USD 162 million) on GDPR compliance in 2025. Privacy-enhancing computation mitigates exposure but inflates compute bills and stretches project timelines.
Legacy IT and OSS/BSS Integration Complexity
Incumbent operators juggle 200-plus legacy systems. Amdocs estimates that full modernization costs USD 50–200 million and can delay monetization rollouts by 18 months. Ericsson’s platform faced a six-month holdup at a European tier-1 carrier because batch-based billing lacked real-time feeds. Even with TM Forum Open APIs, fewer than 30% of telcos have refactored core stacks, extending payback periods.
*Our forecasts treat driver/restraint impacts as directional, not additive. The impact forecasts reflect baseline growth, mix effects, and variable interactions.
Segment Analysis
By Component: Services Catalyze Outsourced Innovation
The Telecom data monetization market, attributed to platform solutions, reached 56.53% of the total market value. Services, although smaller, will accelerate at a 17.02% CAGR, as telcos concede that recruiting scarce data-science talent is more costly than revenue-sharing deals with specialist vendors. Accenture and IBM now guarantee minimum uplift clauses, absorbing financial risk while keeping operators’ capital budgets in check. The shift underscores how the Telecom data monetization industry is evolving toward outcome-based engagements.
Managed analytics contracts are lengthening from 3 to 7 years, reflecting ongoing algorithm refresh requirements. Amdocs’ FY 2025 report showed managed-services bookings rising 28% YoY, driven by multi-year monetization deals. Operators view this as a hedge against internal skills gaps; fewer than 8,000 professionals globally combine BSS fluency with advanced ML expertise. Vendors, in turn, bundle intellectual property rights to trained models, creating switching costs while also accelerating innovation cycles.


By Deployment Mode: Cloud Gains Sustainable Ground
On-premises architectures captured 58.73% of 2025 spending because sovereignty mandates in banking, defense, and healthcare discourage off-site processing. Yet the cloud slice of the Telecom data monetization market is projected to grow at 17.66% CAGR, driven by containerized microservices that scale elastically during traffic peaks. Proximus trimmed launch cycles from 90 days to 14 days post-migration, proof that cloud reduces technical debt.
Regulation is gradually tilting the field. The EU Data Act compels providers to support seamless workload porting, curbing vendor lock-in. Hybrid models keep raw subscriber identifiers in national data centers while shipping anonymized aggregates to hyperscale clouds for heavy processing. Such dual-zone architectures allow telcos to meet compliance requirements while enjoying hyperscaler cost curves, accelerating adoption beyond IT-savvy tier-1s into mid-tier carriers.
By Application: Customer Experience Management Rises
Network management held 46.62% of the Telecom data monetization market share in 2025. However, customer experience management is forecast to grow at an 18.48% CAGR as operators pivot from cost containment to revenue maximization. Tools like Amdocs amAIz draw on real-time interaction streams to personalize offers, raising ARPU by 8-12%.
Marketing and advertising modules are enjoying a renaissance because the death of third-party cookies has pushed brands toward deterministic carrier data. AT&T and Verizon now operate data clean-rooms where matched audiences can be activated without sharing PII, preserving compliance and unlocking new B2B revenue. Risk-and-compliance analytics, spearheaded by Subex, flags suspicious events within 100 milliseconds, giving telcos an opportunity to upsell to finance and fintech clients who value near real-time fraud interdiction.

By End User: Enterprises Fuel Data-as-a-Service Uptake
Telecom operators still account for 62.12% of direct spending, using internal platforms to cut churn, optimize capex, and spin off B2B products. Yet enterprise contracts are projected to rise at 18.31% CAGR. Logistics firms buy traffic APIs to reroute fleets; retailers license foot-traffic heat maps for store placement. Airtel IQ exemplifies this shift, achieving quarterly revenue of USD 12 million within months of launch.
Governments are emerging customers for smart-city analytics stemming from anonymized mobility data. Academia and NGOs appear under “Others,” often receiving data fee-free in exchange for public-domain insights that burnish a carrier’s ESG credentials. Across segments, the Telecom data monetization market is shifting from infrastructure-centric to ecosystem-oriented, embedding telcos more deeply into multiple industry value chains.
Geography Analysis
North America contributed 38.91% of 2025 revenue and remains the epicenter of API-first monetization. AT&T’s Aduna generated USD 180 million in year-one fees, while Verizon’s 6G Innovation Forum produced latency-guaranteed proofs of concept for autonomous vehicles. Canada’s Rogers grew data-services revenue 19% YoY, due to smart-city contracts. Regulatory stability under the FCC and CCPA provides clarity on compliance, accelerating time-to-market.
Asia-Pacific will register the highest CAGR of 19.03% through 2031. China Mobile processed 3.2 exabytes monthly at the edge, yielding CNY 28 billion (USD 3.9 billion) in industrial IoT revenue. Bharti Airtel’s federated marketplace democratizes location intelligence for the Indian e-commerce and finance sectors, while Japan’s SoftBank compressed product launches to two weeks via LotusFlare. Korea’s SK Telecom and KT jointly invested USD 120 million in an edge consortium, targeting smart factories.
Europe grapples with soaring GDPR compliance costs of EUR 1.3 billion (USD 1.53 billion) in 2025 but counters with a five-operator federated Edge Continuum that preserves differential privacy while enabling pan-EU analytics. Middle East incumbents, fueled by 5G-Advanced rollouts, aim to achieve beyond-connectivity revenue equal to 25% of total service income by 2028. African carriers prioritize fintech monetization, leveraging ubiquitous mobile payment rails to offset lower ARPU.

Competitive Landscape
The top five suppliers account for roughly 42% of global sales, signaling a moderately concentrated market. Amdocs and Ericsson dominate platform deployments, each leveraging telecom-grade AI to deliver sub-second personalization. Nokia and Huawei wedge analytics into the RAN and core, cutting data-lake latency. Accenture and IBM lead managed-service engagements, often bundling transformation roadmaps that exceed USD 100 million.
Strategic moves tilt toward ecosystem fill-ins. Ericsson’s 2022 acquisition of Vonage married CPaaS assets with network analytics, giving enterprises turnkey API monetization. Amdocs’ 2025 Salesforce tie-up unified customer-journey orchestration under a single pane. Oracle’s Cerner deal hinted at cross-sector revenue metering in regulated verticals. Vendors compliant with TM Forum Open APIs are seeing accelerated RFP conversions as operators demand plug-and-play interoperability.
Smaller specialists retain niche defensibility. Subex’s fraud-detection engine processed 18 billion events in Q3 2025 with a sub-0.8% false-positive rate.[4]Subex Ltd., “Q3 2025 Fraud Detection Report,” subex.com Allot embeds behavioral DPI directly in network elements to deliver immediate threat intelligence, bypassing separate data pipelines. Comviva continues to dominate mobile financial services across emerging markets through wallet APIs and credit-scoring engines linked to telco usage.
Telecom Data Monetization Industry Leaders
Accenture plc
IBM Corporation
Amdocs Limited
Telefonaktiebolaget LM Ericsson
Nokia Corporation
- *Disclaimer: Major Players sorted in no particular order

Recent Industry Developments
- February 2026: Deutsche Telekom, Orange, Telefónica, TIM, and Vodafone unveiled a federated Edge Continuum that provides cross-border analytics under GDPR-compliant differential privacy guarantees.
- January 2026: Ericsson invested USD 250 million to infuse generative AI into its Intelligent Automation Platform, enabling natural-language analytics queries for business analysts.
- November 2025: Verizon convened its 6G Innovation Forum with 40 partners to prototype edge-computing use cases that will underpin next-gen monetization.
- September 2025: Telefónica and Ericsson deployed Intelligent Automation across Spain, cutting maintenance costs by 14% annually.


Global Telecom Data Monetization Market Report Scope
Telecom data monetization refers to the set of technologies, platforms, and services that enable telecom operators and related organizations to extract business value from network, customer, and operational data. Through advanced analytics, artificial intelligence, and secure data‑sharing frameworks, telecom data monetization solutions help stakeholders enhance the customer experience, optimize network operations, improve marketing effectiveness, and support digital transformation across industries. These solutions allow organizations to convert raw data into actionable insights, new revenue streams, and improved operational efficiency.
The global telecom data monetization market is segmented by component (platform and services), deployment mode (cloud and on‑premises), application (customer experience management, network management, marketing and advertising, and risk and compliance management), end user (telecom operators, enterprises, government agencies, and others), and geography (North America, South America, Europe, Asia-Pacific, and Middle East and Africa, with detailed coverage of multiple countries within each region). The market sizes and forecasts are provided in terms of value (USD) for all the above segments.
| Platform |
| Services |
| Cloud |
| On-Premises |
| Customer Experience Management |
| Network Management |
| Marketing and Advertising |
| Risk and Compliance Management |
| Telecom Operators |
| Enterprises |
| Government |
| Other End Users |
| North America | United States | |
| Canada | ||
| Mexico | ||
| South America | Brazil | |
| Argentina | ||
| Rest of South America | ||
| Europe | Germany | |
| United Kingdom | ||
| France | ||
| Italy | ||
| Spain | ||
| Russia | ||
| Rest of Europe | ||
| Asia-Pacific | China | |
| Japan | ||
| India | ||
| South Korea | ||
| Australia | ||
| Rest of Asia-Pacific | ||
| Middle East and Africa | Middle East | United Arab Emirates |
| Saudi Arabia | ||
| Turkey | ||
| Rest of Middle East | ||
| Africa | South Africa | |
| Egypt | ||
| Nigeria | ||
| Rest of Africa | ||
| By Component | Platform | ||
| Services | |||
| By Deployment Mode | Cloud | ||
| On-Premises | |||
| By Application | Customer Experience Management | ||
| Network Management | |||
| Marketing and Advertising | |||
| Risk and Compliance Management | |||
| By End User | Telecom Operators | ||
| Enterprises | |||
| Government | |||
| Other End Users | |||
| By Geography | North America | United States | |
| Canada | |||
| Mexico | |||
| South America | Brazil | ||
| Argentina | |||
| Rest of South America | |||
| Europe | Germany | ||
| United Kingdom | |||
| France | |||
| Italy | |||
| Spain | |||
| Russia | |||
| Rest of Europe | |||
| Asia-Pacific | China | ||
| Japan | |||
| India | |||
| South Korea | |||
| Australia | |||
| Rest of Asia-Pacific | |||
| Middle East and Africa | Middle East | United Arab Emirates | |
| Saudi Arabia | |||
| Turkey | |||
| Rest of Middle East | |||
| Africa | South Africa | ||
| Egypt | |||
| Nigeria | |||
| Rest of Africa | |||


Key Questions Answered in the Report
How fast is global spending on telecom data monetization expected to grow?
Between 2026 and 2031 spending is forecast to rise at a 15.48% CAGR, reaching USD 13.20 billion by the end of the period.
Which component will expand the quickest?
Services, covering consulting, integration, and managed analytics, are projected to grow at 17.02% CAGR as operators outsource sophisticated data-science workloads.
Why are enterprises buying telecom data?
Logistics, retail, and smart-city operators license anonymized mobility and network insights to optimize routing, store placement, and urban planning, driving an 18.31% CAGR in enterprise spend.
What role do 5G networks play in monetization?
5G drives a 10-100× traffic surge and supports sub-10-millisecond latency, enabling premium APIs for edge analytics, autonomous vehicles, and industrial IoT.
How are privacy regulations shaping monetization strategies?
GDPR and similar laws push carriers toward privacy-enhancing computation and federated data marketplaces that exchange insights, not raw data, ensuring compliance while generating revenue.
What main barrier restrains smaller operators from adopting autonomous networks?
High upfront investment for AI platforms and supporting compute infrastructure remains the most significant hurdle.
Page last updated on:


