Telco Mobile Money Market Size and Share
Market Overview
| Study Period | 2020 - 2031 |
|---|---|
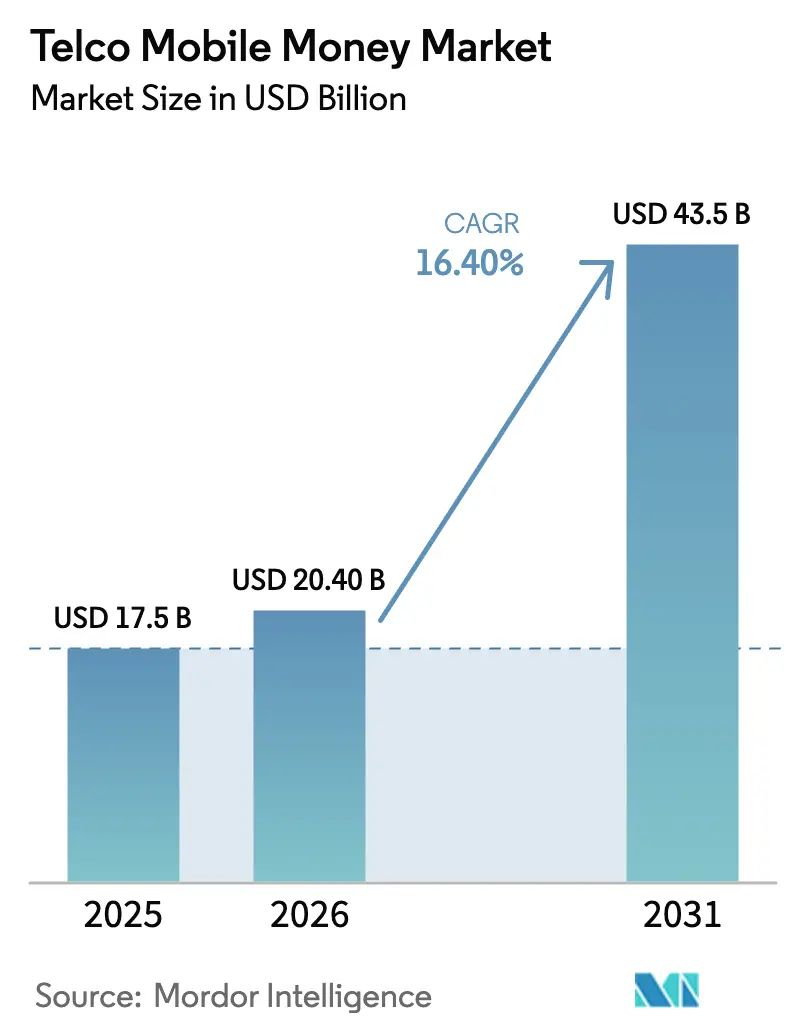
| Market Size (2026) | USD 20.40 Billion |
| Market Size (2031) | USD 43.5 Billion |
| Growth Rate (2026 - 2031) | 16.40% CAGR |
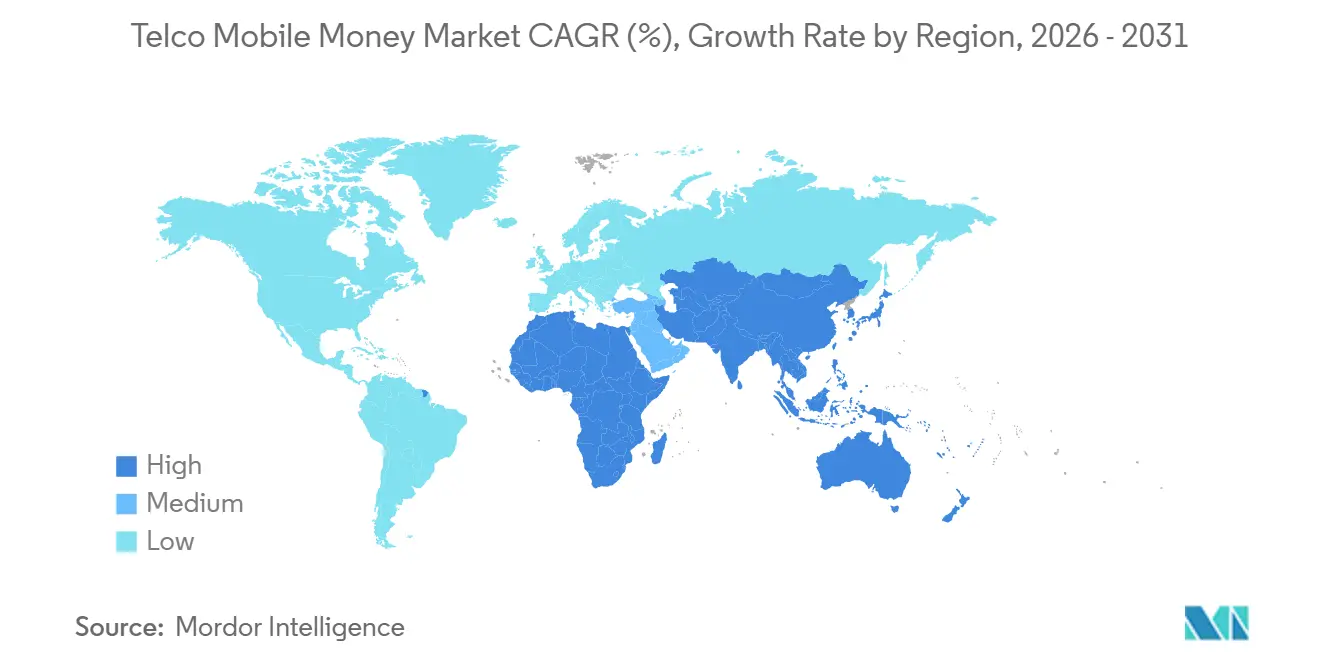
| Fastest Growing Market | South Asia |
| Largest Market | Africa |
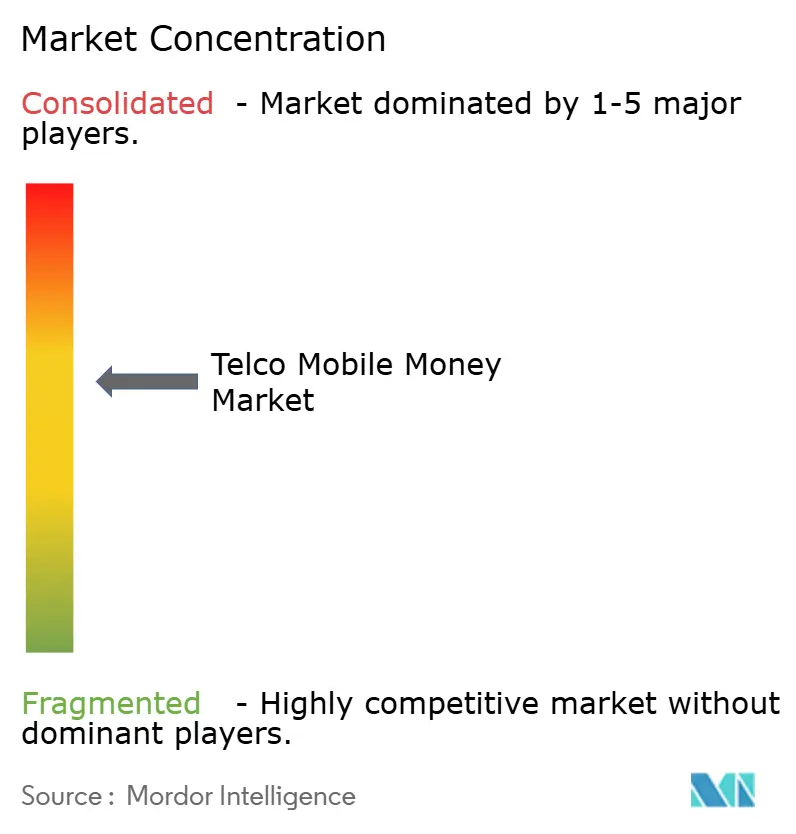
| Market Concentration | Medium |
Major Players *Disclaimer: Major Players sorted in no particular order Image © Mordor Intelligence. Reuse requires attribution under CC BY 4.0. | |
Telco Mobile Money Market Analysis by Mordor Intelligence
The Telco Mobile Money Market size is projected to be USD 17.5 billion in 2025, USD 20.40 billion in 2026, and reach USD 43.5 billion by 2031, growing at a CAGR of 16.40% from 2026 to 2031. Momentum reflects the shift from voice-centric telecom economics toward data-anchored financial services, with mobile network operators now operating as quasi-banks in underserved economies. Sub-Saharan Africa generated 58.6% of global revenue in 2025, yet South Asia is projected to record the fastest expansion as regulatory reforms in India and Pakistan lower entry barriers for non-bank issuers and urban smartphone penetration tops 60%. Merchant payments, a comparatively smaller use case in 2025, are accelerating as fast-moving consumer goods suppliers and utilities embed QR code acceptance, while cross-border wallet corridors capture remittance flows that once relied on informal networks. Competitive intensity is rising because BigTech super-apps and standalone fintech unicorns are squeezing take rates, which is pushing incumbent telcos to monetize application-programming interfaces, issue nano-loans, and bundle insurance.
Key Report Takeaways
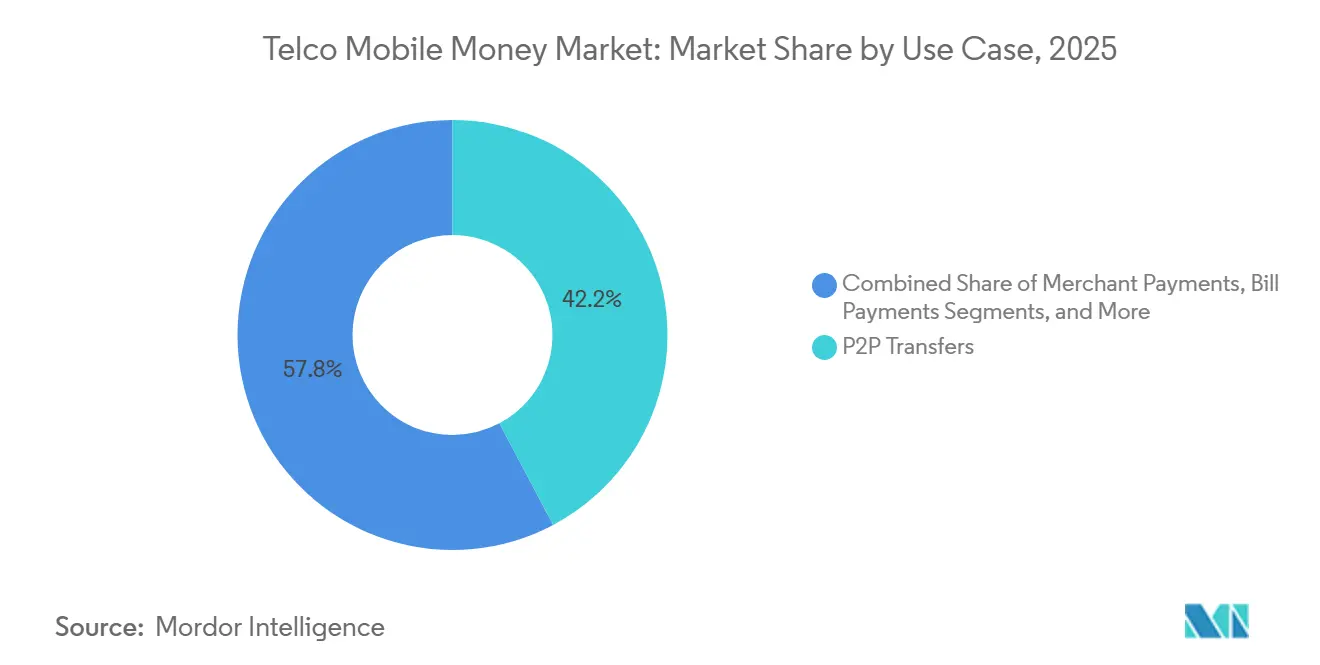
- By use case, merchant payments advanced at a 19.4% CAGR through 2031, whereas P2P transfers held 42.24% of the telco mobile money market share in 2025.
- By transaction corridor, cross-border advanced at a 20.30% CAGR through 2031, whereas domestic held 91.80% of the telco mobile money market share in 2025.
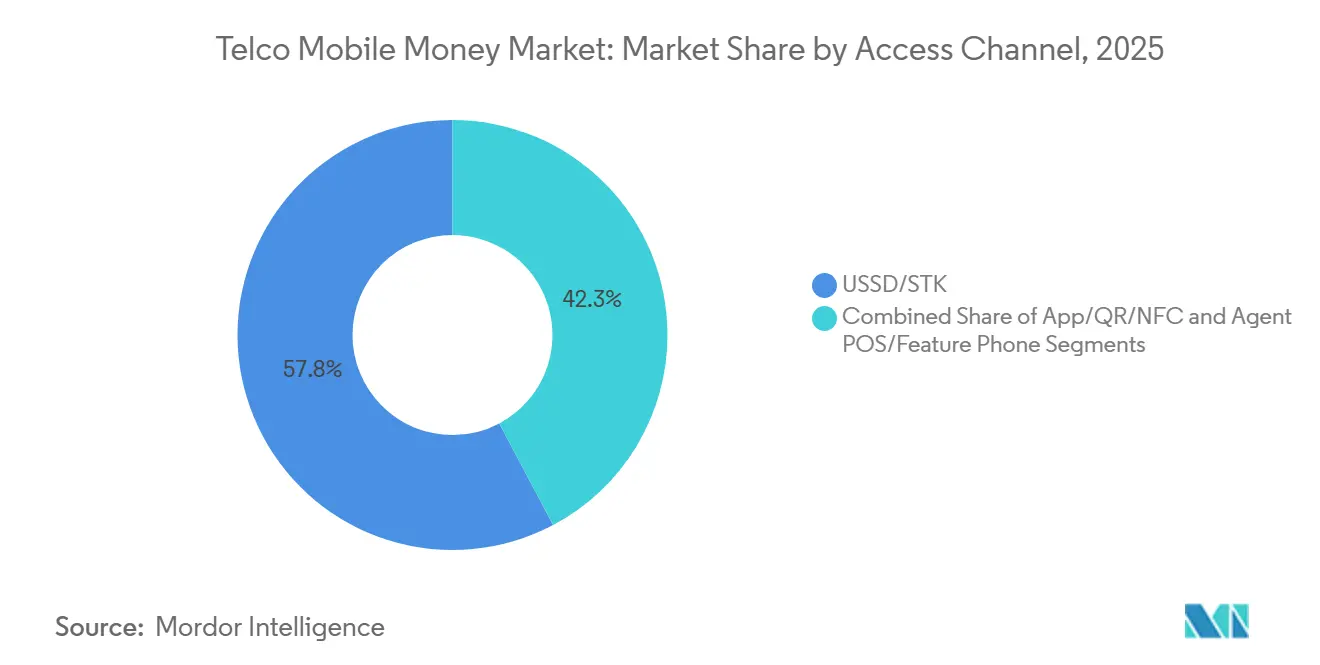
- By access channel, app/QR/NFC-based transactions are projected to grow at 18.5% annually through 2031, whereas USSD/STK held 57.75% of the telco mobile money market share in 2025.
- By geography, Africa commanded 58.6% of the telco mobile money market share in 2025, while South Asia is projected to expand at 19.10% through 2031.
Note: Market size and forecast figures in this report are generated using Mordor Intelligence’s proprietary estimation framework, updated with the latest available data and insights as of January 2026.
Global Telco Mobile Money Market Trends and Insights
Drivers Impact Analysis*
| Driver | (~) % Impact on CAGR Forecast | Geographic Relevance | Impact Timeline |
|---|---|---|---|
| Smartphone Penetration and QR Rails Expanding Acceptance | +4.2% | Sub-Saharan Africa, South Asia, Southeast Asia | Medium term (2-4 years) |
| Regulatory Enablement of E-money and Agent Banking | +3.8% | Global, early adoption in Sub-Saharan Africa and South Asia | Short term (≤ 2 years) |
| Merchant Payment Digitization by FMCG and Utilities | +3.5% | Sub-Saharan Africa, South Asia, the Middle East | Medium term (2-4 years) |
| Cross-border Corridors Integrating with Mobile Money | +2.1% | Sub-Saharan Africa, the Middle East, and South Asia remittance corridors | Long term (≥ 4 years) |
| API Monetization with Fintech and Platform Partners | +1.6% | Global, concentrated in mature markets | Medium term (2-4 years) |
| Government Disbursements and Wage Digitization | +1.2% | Sub-Saharan Africa, South Asia | Short term (≤ 2 years) |
| Source: Mordor Intelligence | |||
Smartphone Penetration And QR Rails Expanding Acceptance
Smartphone adoption surpassed 50% in many frontier economies during 2025, catalyzing a wave of QR-enabled merchant acceptance that sidesteps traditional point-of-sale hardware. Kenya expanded from 320,000 QR merchants in January 2025 to 510,000 by year-end, with average ticket sizes 18% higher than USSD payments due to reduced friction. Nigeria mandated QR interoperability in October 2024, and transaction volumes doubled to 420 million during 2025. [1]Central Bank of Nigeria, “QR Code Interoperability and Payment Systems,” cbn.gov.ng Low-cost Android handsets, 62% of which retailed for less than USD 80 in Africa, lowered the entry barrier to digital wallets. Richer metadata from app and QR channels is enabling telcos to roll out dynamic discounting and targeted advertising, contributing an estimated 9% of mobile-money gross profit in Kenya and Tanzania during 2025.
Regulatory Enablement Of E-Money And Agent Banking
Progressive rules are legitimizing non-bank issuance of stored value and the use of third-party agents. Pakistan revised its branchless banking directives in March 2024, allowing telcos to register agents directly; the network reached 580,000 outlets by 2025, up 38% year-on-year. Ethiopia licensed Ethio Telecom’s Telebirr in May 2024, and the wallet attracted 35 million subscribers and processed USD 4.2 billion by December 2025. India allowed payment aggregators to extend wallet-based credit in September 2024, prompting JioMoney to disburse USD 620 million in nano-loans during 2025. Such frameworks convert telcos from remittance rails into full-fledged financial services distributors, enabling them to enter into revenue-sharing deals with legacy banks for deposits and lending.
Merchant Payment Digitization By FMCG And Utilities
Large consumer goods suppliers and utility companies are embracing mobile money to reduce cash-handling costs. Unilever reported that wallet payments accounted for 22% of East African trade transactions in 2025, helping trim cash-in-transit losses by USD 14 million. [2]Unilever, “Digital Payments in Emerging Markets,” unilever.com Kenya Power received 78% of prepaid electricity token payments via mobile money in 2025, up from 54% in 2023. In Nigeria, MTN MoMo is linked with Dangote Group across 18,000 outlets, cutting cash float requirements by 31%. Instant settlement and automated reconciliation give merchant payments a structural growth edge over person-to-person flows.
Cross-Border Corridors Integrating With Mobile Money
Direct-to-wallet remittances are chipping away at informal channels. Vodacom and Western Union launched a Mozambique-Tanzania service in January 2025, logging 2.8 million transfers within 11 months. Airtel Money partnered with Wise in June 2025, offering mid-market rates that undercut incumbents by over 2 percentage points. [3]Wise, “Cross-Border Mobile Money Integration,” wise.com The World Bank estimated that mobile wallets captured 19% of Sub-Saharan Africa’s remittance inflows in 2025, up from 11% in 2023. However, patchy regulatory harmonization means the East African regional payment system processed only 1.2% of intra-bloc wallet flows in 2025.
Restraints Impact Analysis*
| Restraint | (~) % Impact on CAGR Forecast | Geographic Relevance | Impact Timeline |
|---|---|---|---|
| Interchange Caps and E-levies Compress Unit Economics | -2.8% | Sub-Saharan Africa, spillover to South Asia | Short term (≤ 2 years) |
| De-risking and Correspondent Bank Friction on Cross-border | -1.9% | Sub-Saharan Africa, Middle East fragile-state corridors | Medium term (2-4 years) |
| SIM and USSD Security Exploits and Fraud Losses | -1.4% | Global, concentrated where identity frameworks are weak | Short term (≤ 2 years) |
| Cash-out Dependency Limiting Float Velocity | -1.1% | Sub-Saharan Africa, South Asia | Long term (≥ 4 years) |
| Source: Mordor Intelligence | |||
Interchange Caps And E-Levies Compress Unit Economics
Fiscal pressures have prompted several governments to tax wallet transactions. Uganda’s 0.5% withdrawal levy, introduced in July 2024, drove an 8.2% decline in monthly volumes during the first quarter of 2025. [4]Bank of Uganda, “Mobile Money Statistics and Taxation Impact,” bou.or.ug Zimbabwe’s 2% transfer tax dragged down the 2025 transaction value by 14% compared with 2024. Ghana’s 1% levy cut market growth to 6% in 2025 from a pre-tax trend of 22%. These charges dent low-value usage, forcing operators to lobby for exemptions and to subsidize merchant payments.
De-Risking And Correspondent Bank Friction On Cross-Border
Correspondent banks wary of money-laundering risk have curtailed settlement lines. Following a 2024 FATF review, three European banks lengthened Kenyan wallet settlement cycles to 72 hours and widened FX spreads by 40 basis points. In Somalia, the absence of banking partners forced USD 1.4 billion in 2025 remittances to move via informal channels. Operators are relocating treasury hubs to stronger compliance jurisdictions, adding up to 18 basis points to each cross-border transaction.
*Our forecasts treat driver/restraint impacts as directional, not additive. The impact forecasts reflect baseline growth, mix effects, and variable interactions.
Segment Analysis
By Use Case: Merchant Payments Outpace Peer Transfers
P2P transfers retained 42.24% of the telco mobile money market share in 2025, underscoring the channel’s role in remittance flows. Merchant payments, however, are projected to grow at 19.4% annually, driven by the adoption of QR codes and real-time settlement incentives. Bill payments grew 14.8% as governments pushed digital fee collection. Cash-in and cash-out transactions remain pivotal to liquidity but now face lower fees following the April 2025 Kenyan cap, prompting operators to nudge users toward wallet-to-wallet flows.
International remittances via wallets reached USD 3.7 billion in 2025, up 20.3% year over year. Savings products attracted USD 1.2 billion in deposits despite the ambiguity around deposit insurance. Credit and nano-loans totaled USD 4.8 billion with default rates near 3.2%. Insurance enrollment reached 18 million users, centered on health and crop coverages, yet opaque claims reporting limits transparency.


By Transaction Corridor: Cross-Border Gains Momentum
Domestic transfers accounted for 91.8% of the 2025 value, but cross-border wallet flows are forecast to rise 20.3% annually through 2031. East Africa’s Kenya-Tanzania corridor processed USD 680 million in 2025 after full M-PESA wallet integration. Nigeria-Ghana volumes remained modest at USD 210 million due to exchange-control frictions.
United Kingdom to Kenya lanes moved USD 1.4 billion in 2025, with wallets capturing a 42% share of the market from legacy operators. Gulf Cooperation Council to Pakistan routes hit USD 920 million under Pakistan’s 24-hour settlement rule. Intra-African corridors, notably South Africa-Zimbabwe, still lean on informal carriers for 60% of flows despite mature wallet ecosystems.
By Access Channel: App Migration Accelerates
USSD and SIM Toolkit paths accounted for 57.75% of 2025 volumes, thanks to the ubiquity of feature phones. Yet app/QR code/NFC-based usage is set to climb to 18.5% annually, backed by 54% smartphone penetration in Sub-Saharan Africa and 68% in South Asia. Safaricom’s relaunched M-PESA app accounted for 38% of Kenyan wallet value by December 2025. MTN Ghana’s MoMo app, boosted by buy-now-pay-later, posted 89% annual growth to 140 million transactions.
QR merchant footprints doubled to 2.1 million acceptance points in 2025 across Nigeria, Kenya, and Pakistan. Agent POS devices remain essential for rural liquidity, while Ethiopia’s Telebirr demonstrates that expansive agent networks can offset low smartphone uptake. Near-field communication remains niche because NFC-ready terminals are largely confined to urban malls in South Africa, Kenya, and the UAE.
Geography Analysis
Africa accounted for a 58.6% share of the telco mobile money market in 2025, anchored by Kenya, Nigeria, Ghana, Tanzania, and Uganda, where wallet penetration among adults exceeds 70%. Kenya processed USD 98 billion, 87% of GDP, with M-PESA holding 68% of the telco mobile money market share. Nigeria recorded USD 42 billion in exports, up 28% amid a cashless push and ISO-20022 instant transfers. Ethiopia’s Telebirr scaled to 35 million users and USD 4.2 billion in value within 18 months, the fastest adoption globally. Fiscal headwinds include Uganda’s withdrawal levy and Ghana’s electronic transfer tax, both of which are dampening transaction frequency.
South Asia is projected to grow at 19.1% annually through 2031, driven by deregulation and rapid smartphone adoption. Pakistan’s JazzCash and Easypaisa moved PKR 38 trillion (USD 136 billion) in 2025 under agent-licensing reforms. India’s 420 million wallet users face moderated growth because the Unified Payments Interface dominates 131 billion transactions, dwarfing wallet volumes. Bangladesh’s bKash and Nagad processed BDT 78 trillion (USD 710 billion) in 2025 after an October 2024 interoperability mandate.
Southeast Asia and the Middle East add strategic reach. Globe Telecom’s GCash hit 92 million users and USD 28 billion in value in 2025, morphing into a super-app. TrueMoney moved USD 14 billion across Thailand, Cambodia, Myanmar, and Vietnam. Gulf operators such as Saudi Arabia’s stc pay (6.2 million active users) benefit from instant rails, whereas UAE wallets struggle against near-universal banking. Regulatory fragmentation, exemplified by Qatar’s Ooredoo Mobile Money and Iraq’s Zain Cash, still complicates regional scale.

Competitive Landscape
Global competition is moderately concentrated, with the five largest players accounting for 48% of the 2025 transaction value, providing a balanced structure rather than outright dominance. Vodacom and Safaricom, leveraging the M-PESA brand across seven markets, accounted for 12.3% of the Vodacom group's service revenue in fiscal 2025. MTN’s 60 million fintech users generated USD 1.8 billion in revenue, up 34% from 2024. Airtel Africa’s plan to list its wallet arm at a USD 4.5 billion valuation illustrates a pivot to pure-play fintech multiples.
Strategic focus has shifted from subscriber acquisition to monetizing data and embedded finance. MTN’s Open API generated USD 120 million from 340 partners, while Safaricom and Vodacom are rapidly integrating remittance rails with Western Union to tap diaspora flows. White space remains in merchant acquiring, where cash still commands 78% of Nigerian retail spend and 64% in Kenya. Emerging disruptors include Ethio Telecom’s Telebirr and Pakistan’s SadaPay, which leverage cloud-native stacks to sidestep telco legacy.
Compliance costs are scaling. FATF guidelines on transaction monitoring and PCI-DSS requirements for QR acceptance add 8-12 basis points per transaction, favoring scaled incumbents. At the same time, BigTech super-apps are pressuring take rates below 1%, compelling telcos to bundle credit and insurance to defend yield.
Telco Mobile Money Industry Leaders
Vodacom Group Limited
MTN Group Limited
Orange S.A.
Bharti Airtel Limited
Millicom International Cellular S.A.
- *Disclaimer: Major Players sorted in no particular order

Recent Industry Developments
- January 2026: Vodacom and Western Union expanded direct-to-wallet remittances to the Democratic Republic of Congo and Lesotho, building on 2.8 million transactions in 2025.
- December 2025: MTN Group acquired a 20% stake in Mastercard’s Community Pass digital-identity platform for USD 180 million to embed biometrics in MoMo wallets.
- November 2025: Safaricom activated a Kenya-Ethiopia M-Pesa-Telebirr remittance link that handled USD 42 million in its first month.


Global Telco Mobile Money Market Report Scope
The Telco Mobile Money Market Report is Segmented by Use Case (P2P Transfers, Merchant Payments, Bill Payments, Cash-In/Cash-Out, Bulk Disbursements, International Remittances, Savings/Wallets Interest, Credit/Nano-Loans, and Insurance/Micro-Insure), Transaction Corridor (Domestic and Cross-Border), Access Channel (USSD/STK, App/QR/NFC, and Agent POS/Feature Phone), and Geography (South Asia, Southeast Asia, Middle East, and Africa). The Market Forecasts are Provided in Terms of Value (USD).
| P2P Transfers |
| Merchant Payments |
| Bill Payments |
| Cash‑In/Cash‑Out |
| Bulk Disbursements |
| International Remittances |
| Savings/Wallets Interest |
| Credit/Nano‑Loans |
| Insurance/Micro‑Insure |
| Domestic |
| Cross‑Border |
| USSD/STK |
| App/QR/NFC |
| Agent POS/Feature phone |
| South Asia |
| Southeast Asia |
| Middle East |
| Africa |
| By Use Case | P2P Transfers |
| Merchant Payments | |
| Bill Payments | |
| Cash‑In/Cash‑Out | |
| Bulk Disbursements | |
| International Remittances | |
| Savings/Wallets Interest | |
| Credit/Nano‑Loans | |
| Insurance/Micro‑Insure | |
| By Transaction Corridor | Domestic |
| Cross‑Border | |
| By Access Channel | USSD/STK |
| App/QR/NFC | |
| Agent POS/Feature phone | |
| By Geography | South Asia |
| Southeast Asia | |
| Middle East | |
| Africa |


Key Questions Answered in the Report
How big is the Telco mobile money market expected to be by 2031?
It is forecast to reach USD 43.59 billion in 2031, growing at a 16.40% CAGR over 2026-2031.
Which region is projected to grow fastest through 2031?
South Asia is anticipated to post the highest growth, with a 19.10% CAGR, helped by smartphone penetration above 60% in major cities and regulations that let non-banks issue e-money.
What is driving the rapid rise of merchant payments?
Mandatory QR interoperability, FMCG and utility digitization, and loyalty incentives are pushing merchant payments to expand at a 19.40% CAGR, outpacing peer-to-peer transfers.
How do government e-levies influence usage?
Levies such as Uganda’s 0.5% withdrawal tax and Ghana’s 1% transfer fee have cut monthly transaction growth by up to 8%, especially among low-value users.
Why are app and QR channels gaining share over USSD?
Rising smartphone ownership, richer data capture, and lower per-transaction costs are steering traffic toward apps and QR rails, which are projected to grow at an 18.50% CAGR through 2031.
What role do credit and nano-loans play in overall revenue?
Embedded lending products like Fuliza and Qwikloan disbursed USD 4.8 billion in 2025, boosting average revenue per wallet and cushioning operators against transfer-fee compression.
Page last updated on:


