Taiwan Data Center Market Size and Share
Market Overview
| Study Period | 2020 - 2031 |
|---|---|
| Forecast Data Period | 2026 - 2031 |
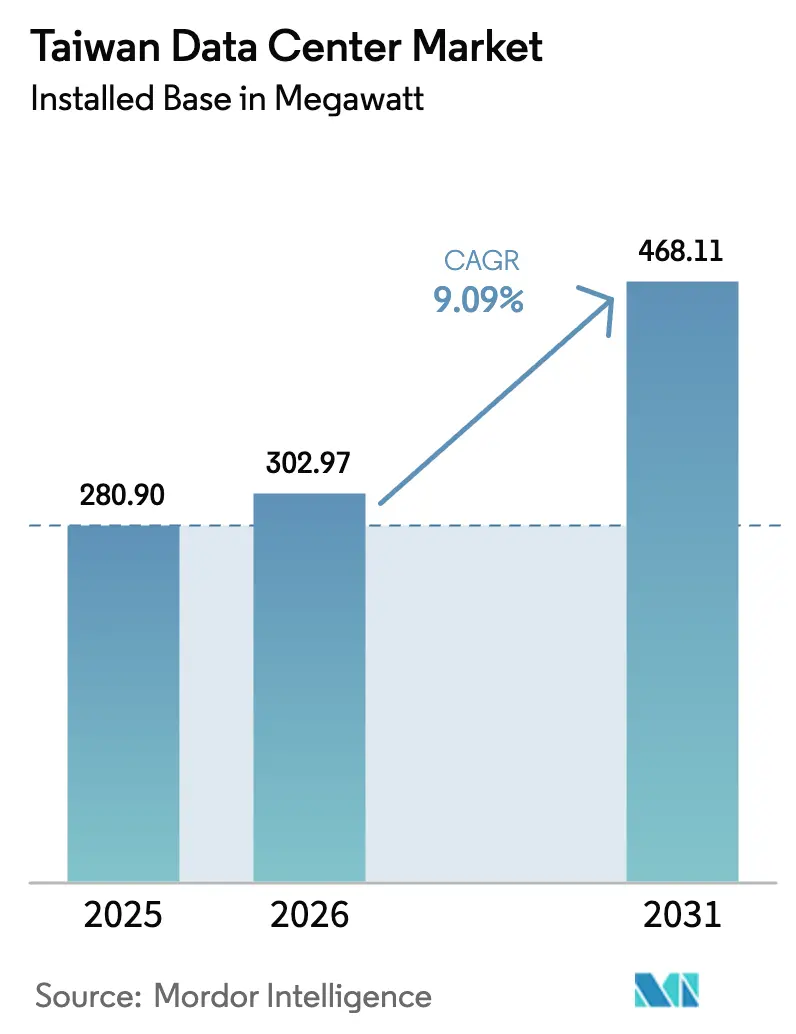
| Base Year Market Size (2025) | 280.90 megawatt |
| Market Volume (2026) | 302.97 megawatt |
| Market Volume (2031) | 468.11 megawatt |
| Growth Rate (2026 - 2031) | 9.09% CAGR |
| Market Concentration | Medium |
Major Players
*Disclaimer: Major Players sorted in no particular order Image © Mordor Intelligence. Reuse requires attribution under CC BY 4.0. |
|
Taiwan Data Center Market Analysis by Mordor Intelligence
The Taiwan data center market size in terms of installed base was valued at 280.90 megawatt in 2025 and is estimated to grow from 302.97 megawatt in 2026 to reach 468.11 megawatt by 2031, at a CAGR of 9.09% during the forecast period (2026-2031). An expanding pipeline of hyperscale self-build projects, tightening energy-efficiency rules, and a semiconductor-driven surge in high-performance computing workloads are reshaping supply and demand. U.S. cloud majors are front-loading capital to secure land and power, while domestic telcos are pivoting toward liquid-cooled, AI-optimized facilities to preserve market share. Government subsidies for renewable energy certificates, tiered power tariffs, and fast-evolving 5 G edge requirements are accelerating design innovation and compressing time-to-market. Simultaneously, seismic-proof construction, bilingual talent shortages, and grid-connection delays are adding cost and complexity but have not slowed investment appetite.
Key Report Takeaways
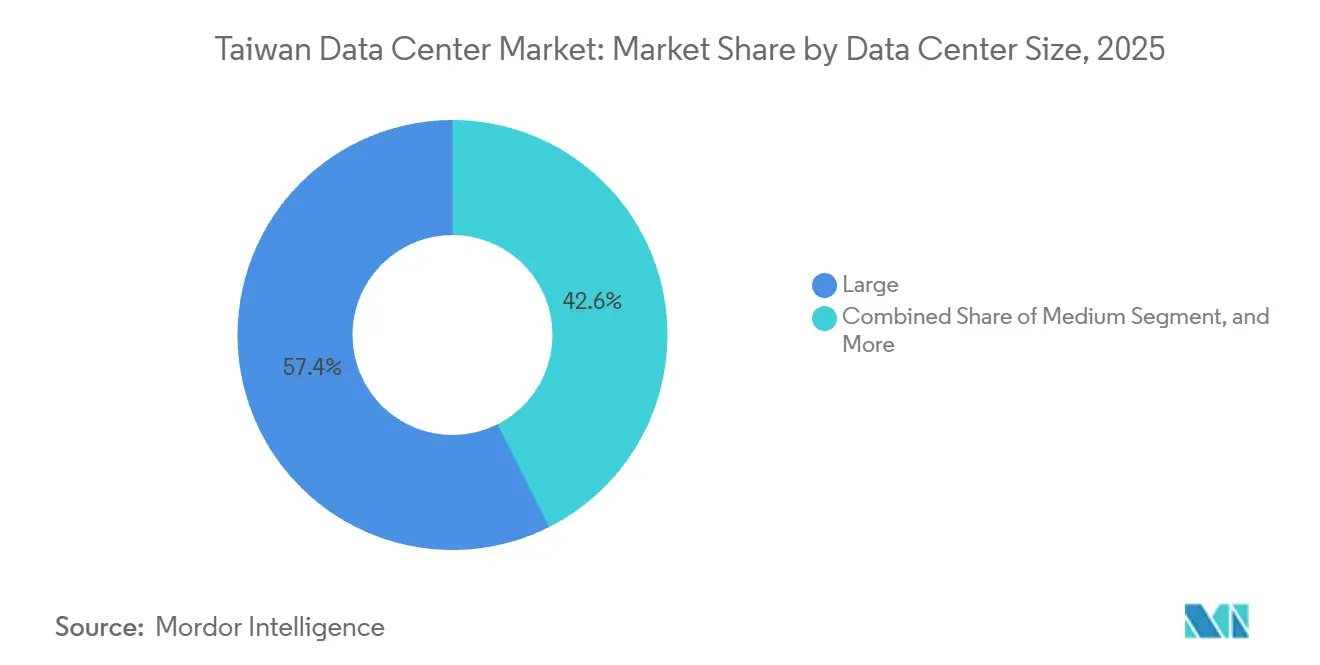
- By data center size, large facilities led with 57.42% capacity share in 2025; medium facilities are projected to expand at a 10.12% CAGR through 2031.
- By tier, tier 3 facilities held 56.52% of the Taiwan data center market share in 2025, while tier 4 deployments are advancing at a 10.32% CAGR to 2031.
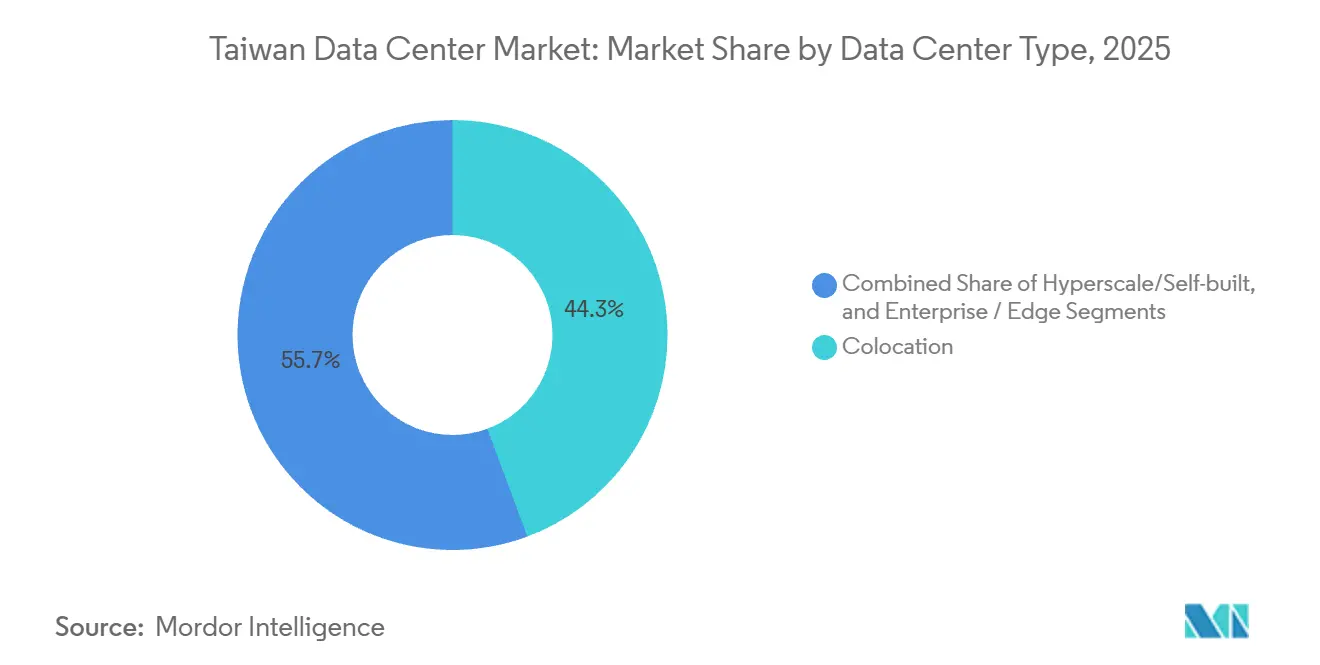
- By facility type, colocation accounted for 44.35% of the Taiwan data center market size in 2025, and hyperscale self-build projects are growing at a 10.63% CAGR over 2026-2031.
- By end user, IT and ITES accounted for 47.61% of the Taiwan data center market in 2025, whereas BFSI workloads are rising at a 11.51% CAGR through 2031.
- By hotspot, Taipei captured 60.92% of capacity in 2025, and Taoyuan is the fastest-growing zone with a 10.78% CAGR through 2031.
Note: Market size and forecast figures in this report are generated using Mordor Intelligence’s proprietary estimation framework, updated with the latest available data and insights as of January 2026.
Taiwan Data Center Market Trends and Insights
Drivers Impact Analysis
| Driver | (~) % Impact on CAGR Forecast | Geographic Relevance | Impact Timeline |
|---|---|---|---|
| Surging Hyperscale Self-Build Projects by U.S. Cloud Majors | +2.8% | Taipei, Taoyuan | Medium term (2-4 years) |
| Government Green-Energy Subsidy Program for Data Center PUE Optimization | +1.5% | National (early gains in Taipei and Taoyuan) | Short term (≤ 2 years) |
| Rapid 5 G Rollout Driving Edge Micro-Site Demand | +1.2% | Urban Taipei, Taoyuan, Kaohsiung | Medium term (2-4 years) |
| Semiconductor-Industry Big-Data Workloads with EUV Lithography Analytics | +1.9% | Tainan, Hsinchu, Taichung | Long term (≥ 4 years) |
| Rising Submarine-Cable Landings Elevating Taiwan’s Regional Inter-Connectivity | +0.9% | Coastal landing stations | Long term (≥ 4 years) |
| Colocation Demand from AI Model-Training Start-Ups | +1.6% | Taipei, Taoyuan | Short term (≤ 2 years) |
| Source: Mordor Intelligence | |||
Surging Hyperscale Self-Build Projects by U.S. Cloud Majors
AWS, Microsoft, and Google are bypassing colocation intermediaries by buying land and power blocks directly from Taipower, which enables proprietary liquid-cooling systems and renewable-energy procurement.[1]Amazon Web Services, “AWS Announces General Availability of the AWS Asia Pacific (Taipei) Region,” press.aboutamazon.comAWS opened its three-zone Taipei region in January 2025 after investing more than USD 5 billion, the largest cloud deployment ever in Taiwan. Self-build campuses now anchor latency grids that link Taipei with Tokyo, Hong Kong, and Singapore in under 35 milliseconds. However, transformer shortages and seven-year lead times may delay second-phase expansions beyond 2027.
Government Green-Energy Subsidy Program for Data Center PUE Optimization
The Ministry of Economic Affairs began enforcing a PUE ceiling of 1.3 for hyperscale sites in November 2025 and rolled out tiered electricity tariffs in January 2026 that charge surcharges of up to 20% for inefficient facilities.[2]Taiwan Ministry of Economic Affairs, “Data Center Energy Efficiency Regulations,” moea.gov.twOperators meeting the targets gain fast-track permits and power-rate discounts, prompting early adoption of liquid cooling, rooftop solar, and renewable certificate purchases. Chunghwa Telecom cut its fleet PUE to 1.61 in 2024 and targets 100% renewable sourcing by 2030. The incentive scheme is adding 1.5 percentage points to forecast CAGR.
Rapid 5 G Rollout Driving Edge Micro-Site Demand
Taiwan counted 8.94 million 5 G subscribers, or 37% mobile penetration, by December 2024 after more than 20,000 base stations went live. Operators are co-locating 100-500 kW edge sites at cell towers to support ultra-low-latency gaming, industrial IoT, and smart-factory workloads. Far EasTone budgeted NTD 3 billion (USD 100 million) for 5 G edge centers through 2026, while Taiwan Mobile plans 30 MEC nodes by end-2025. Distributed edge capacity eases grid congestion in Taipei and adds 1.2 percentage points of incremental growth.
Semiconductor-Industry Big-Data Workloads with EUV Lithography Analytics
Each EUV scanner at TSMC outputs up to 5 terabytes of data daily, requiring on-site analytics clusters with sub-10-millisecond latency. Fab 18 in Tainan already houses Tier 4 nodes, and Foxconn with NVIDIA is building a 10,000-GPU AI factory supercomputer to aid advanced process R&D. The semiconductor sector’s demand concentrates capacity in Hsinchu, Taichung, and Tainan and contributes 1.9 percentage points to market growth.
Restraints Impact Analysis
| Restraint | (~) % Impact on CAGR Forecast | Geographic Relevance | Impact Timeline |
|---|---|---|---|
| High Seismic Risk Elevating Construction Cost and Insurance Premia | -1.4% | Taipei, Hsinchu, Taichung | Long term (≥ 4 years) |
| Delayed Grid-Connection Approvals in Northern Hotspots | -1.1% | Taipei, New Taipei City, northern Taoyuan | Short term (≤ 2 years) |
| Scarcity of Experienced Bilingual Data Center Operations and Maintenance Workforce | -0.7% | National (most acute in Taipei and Hsinchu) | Medium term (2-4 years) |
| Intensifying Power-Rationing Risk Amid Aggressive Chip-Fab Expansion | -1.3% | Tainan, Hsinchu, Taichung | Medium term (2-4 years) |
| Source: Mordor Intelligence | |||
High Seismic Risk Elevating Construction Cost and Insurance Premia
Taiwan’s location on the Pacific Ring of Fire requires data centers to install base-isolation platforms and dual-feed substations, raising Tier 4 build costs by up to 40%. The April 3, 2024, quake cost TSMC USD 92.44 million, while catastrophe models project a modern Chi-Chi event could trigger USD 12 billion in insured losses.[3]AIR Worldwide, “Taiwan Earthquake Catastrophe Model,” air-worldwide.comAnnual insurance premiums exceed 2% of insured value in high-risk zones, trimming 1.4 percentage points from forecast CAGR.
Delayed Grid-Connection Approvals in Northern Hotspots
Taipower’s transformer shortages and a 2025 moratorium on new 5 MW-plus connections north of Taoyuan extend commissioning schedules by six to twelve months. Chunghwa Telecom and Vantage redirected builds to Taoyuan, while four new 161 kV substations, due 2025-2027, aim to ease congestion. Stop-gap diesel generation raises CAPEX and knocks 1.1 percentage points off short-term growth.
Segment Analysis
By Data Center Size: Medium Facilities Anchor Emerging Edge Architectures
Medium facilities captured rising interest as semiconductor fabs and banks require 5-15 MW edge nodes near production lines and trading engines. The Taiwan data center market size for medium facilities is projected to climb at a 10.12% CAGR, surpassing the overall trajectory as firms favor faster build cycles and lower capital intensity. Large campuses still held 57.42% share in 2025, reflecting AWS Taipei and Google Changhua footprints, but grid caps in Taipei channel new megawatts toward modular 10 MW blocks in Taoyuan and southern parks.
Medium-sized sites also benefit from Taiwan FSC rules that mandate disaster recovery centers more than 50 km from primary locations, stimulating dual-site strategies among banks. In contrast, hyperscale self-builds, though fewer in count, drive the largest absolute capacity additions and lock in power at contract pricing. Small sites under 2 MW focus on content delivery network caches and telecom edge functions, but face margin compression as wholesale rates fall.
Note: Segment shares of all individual segments available upon report purchase
By Tier Type: Regulatory Mandates Propel Tier 4 Uptake
Tier 4 deployments are forecast to outpace the Taiwan data center market at a 10.32% CAGR, underpinned by BFSI recovery-time mandates and seismic resilience requirements. Tier 3 retains the majority position at 56.52% of 2025 capacity yet grows more slowly as hyperscalers mix custom redundancy with proprietary cooling.
Tier 1 and Tier 2 sites are being retrofitted or retired because they cannot meet the Ministry’s 1.4 PUE ceiling without major overhauls. Construction cost premiums of 30-40% for Tier 4 are offset by avoided regulatory penalties and reputational risk. Investors increasingly view Tier 4 certification as a differentiator that improves asset liquidity, allowing early-stage projects in Taipei and Taoyuan to pre-lease more than 80% of capacity before groundbreaking.
By Data Center Type: Hyperscale Self-Build Redefines Supply Interfaces
Colocation held a 44.35% capacity share in 2025, while hyperscale self-build additions grew at a 10.63% CAGR, recalibrating how power and land are procured. The Taiwan data center market share commanded by colocation is expected to shrink as AWS, Microsoft, and Google anchor their own campuses adjacent to submarine cable landing sites.
Wholesale pre-lease models dominate remaining third-party builds, with Vantage’s 16 MW TPE11 and Keppel’s 80 MW campus fully reserved prior to ground-breaking. Retail colocation remains relevant for SMEs that need quarter-rack flexibility but must differentiate with GPU-ready, liquid-cooled cabinets. Operators that can bundle renewable-energy certificates and managed AI services into these pre-lease contracts are seeing higher utilization rates and the ability to command premium pricing.
Note: Segment shares of all individual segments available upon report purchase
By End User: BFSI Leads Growth Amid Digital-First Mandates
IT and ITES workflows continued to hold 47.61% share in 2025, yet BFSI workloads will register the fastest 11.51% CAGR as banks modernize core systems and embrace real-time fraud analytics. Cathay Financial’s NTD 20 billion (USD 670 million) digital infrastructure budget and CTBC’s cloud-native migration underline the pivot.
Manufacturing demand, largely semiconductor fabs, fuels high-density clusters co-located on campuses in Hsinchu and Tainan. Government, media, and telecom segments expand steadily but at lower relative pace, constrained by budget cycles and reliance on public-sector funding. A growing cohort of research institutions is also leasing GPU capacity on monthly terms, further diversifying the tenant mix across colocation halls.
Geography Analysis
In 2025, Taipei seized 60.92% of the capacity, while Taoyuan emerged as the fastest-growing zone, boasting a 10.78% CAGR projected through 2031. Taipei’s dominant footprint continues to leverage the densest mesh of submarine cable landing stations and proximity to financial exchanges. The city’s colocation vacancy tightened to 16% in H2 2024, pushing wholesale rates upward even as grid approvals slowed. Operators already holding landbank positions, such as Chief Telecom and Chunghwa Telecom, accelerate retrofit programs to achieve sub-1.5 PUE targets and maintain competitiveness.
Taoyuan emerges as the primary overflow valve, bolstered by the Aerotropolis initiative and Smart City Special District incentives that slash permitting cycles by up to 30%. Vantage’s phase-two 16 MW build, Keppel’s 80 MW joint venture, and a planned Foxconn-NVIDIA GPU hub collectively transform the airport corridor into Taiwan’s fastest-scaling hyperscale zone.
Southern and central regions, led by Tainan and Kaohsiung, ride the semiconductor manufacturing boom and AI-factory initiatives. The National Cloud Computing Center in Tainan and Foxconn’s AI factory elevate power needs but diversify seismic and rationing risk away from the north. Changhua, home to Google’s 1.12 PUE site, remains a renewable-energy showcase with potential for future expansion if inter-region latency hurdles can be mitigated.
Competitive Landscape
Incumbent telcos once commanded more than 70% of local colocation megawatts, yet the arrival of international platforms is fragmenting share. Chunghwa Telecom earmarked NTD32.36 billion (USD 1.08 billion) for AI-ready expansions and submarine-cable upgrades, including an all-photonics network demonstration with NTT to lower inter-campus latency. Chief Telecom’s plug-and-play liquid-cooled site reached 70% occupancy within three months, underscoring pent-up demand for GPU-dense racks.
Vantage, Keppel, Empyrion Digital, Epoch Digital, and BDx differentiate through wholesale pre-lease contracts, DGX-Ready certifications, and PUE targets below 1.33. Technology focus is shifting toward direct liquid cooling and renewable energy procurement to comply with the Ministry’s 10% renewable mandate. Smaller domestic operators may seek partnerships or exit as wholesale pricing softens once 2026-2027 capacity comes online.
Incumbents and newcomers are forming tight alliances to secure talent, renewable power, and GPU supply. Chunghwa Telecom’s April 2026 pact with NVIDIA opens a liquid-cooling demo lab to help shrink Taiwan’s 40,000-person skills gap, while Vantage and Keppel now co-source high-efficiency switchgear to shave 7-10% off build costs. Chief Telecom, BDx, and Epoch Digital joined a 2026 renewable-procurement consortium targeting 1 TWh of clean energy by 2030, signaling that scale, sustainability, and certified AI readiness will decide market winners.
Taiwan Data Center Industry Leaders
-
Microsoft Corporation
-
Chief Telecom Inc.
-
Chunghwa Telecom Co., Ltd.
-
Google LLC
-
Amazon Web Services, Inc.
- *Disclaimer: Major Players sorted in no particular order
Recent Industry Developments
- January 2026: Taipower implemented tiered electricity tariffs that reward PUE < 1.3 and penalize inefficient operators with surcharges above 20%.
- December 2025: Taiwan inaugurated its first 15 MW national cloud computing center in Tainan to bolster digital sovereignty.
- July 2025: Chief Telecom launched Taiwan’s first plug-and-play liquid-cooled data center, achieving PUE below 1.5.
- May 2025: Vantage announced a 16 MW phase-two expansion of TPE11 in Taoyuan, fully pre-leased for 2026.
Taiwan Data Center Market Report Scope
The data center market encompasses the infrastructure, services, and technologies that support the storage, management, and processing of data. This market includes various data center sizes, tier classifications, types, end-user industries, and hotspots, reflecting the diverse needs of businesses and organizations operating in the country.
The Taiwan Data Center Market Report is Segmented by Data Center Size (Small, Medium, Large, and Hyperscale), Tier Type (Tier 1 and 2, Tier 3, and Tier 4), Data Center Type (Hyperscale/Self-Built, Enterprise/Edge, and Colocation), End User (BFSI, IT and ITES, E-Commerce, Government, Manufacturing, Media and Entertainment, Telecom, and Other End Users), and Hotspot (Taipei, Taoyuan, and Rest of Taiwan). The Market Forecasts are Provided in Terms of IT Load Capacity (Megawatt).
| Small |
| Medium |
| Large |
| Hyperscale |
| Tier 1 and 2 |
| Tier 3 |
| Tier 4 |
| Hyperscale / Self-Built | ||
| Enterprise / Edge | ||
| Colocation | Non-Utilized | |
| Utilized | Retail Colocation | |
| Wholesale Colocation | ||
| BFSI |
| IT and ITES |
| E-Commerce |
| Government |
| Manufacturing |
| Media and Entertainment |
| Telecom |
| Other End Users |
| Taipei |
| Taoyuan |
| Rest of Taiwan |
| By Data Center Size | Small | ||
| Medium | |||
| Large | |||
| Hyperscale | |||
| By Tier Type | Tier 1 and 2 | ||
| Tier 3 | |||
| Tier 4 | |||
| By Data Center Type | Hyperscale / Self-Built | ||
| Enterprise / Edge | |||
| Colocation | Non-Utilized | ||
| Utilized | Retail Colocation | ||
| Wholesale Colocation | |||
| By End User | BFSI | ||
| IT and ITES | |||
| E-Commerce | |||
| Government | |||
| Manufacturing | |||
| Media and Entertainment | |||
| Telecom | |||
| Other End Users | |||
| By Hotspot | Taipei | ||
| Taoyuan | |||
| Rest of Taiwan | |||
Market Definition
- IT LOAD CAPACITY - The IT load capacity or installed capacity, refers to the amount of energy consumed by servers and network equipments placed in a rack installed. It is measured in megawatt (MW).
- ABSORPTION RATE - It denotes the extend to which the data center capacity has been leased out. For instance, a 100 MW DC has leased out 75 MW, then absorption rate would be 75%. It is also referred as utilization rate and leased-out capacity.
- RAISED FLOOR SPACE - It is an elevated space build over the floor. This gap between the original floor and the elevated floor is used to accommodate wiring, cooling, and other data center equipment. This arrangement assist in having proper wiring and cooling infrastructure. It is measured in square feet (ft^2).
- DATA CENTER SIZE - Data Center Size is segmented based on the raised floor space allocated to the data center facilities. Mega DC - # of Racks must be more than 9000 or RFS (raised floor space) must be more than 225001 Sq. ft; Massive DC - # of Racks must be in between 9000 and 3001 or RFS must be in between 225000 Sq. ft and 75001 Sq. ft; Large DC - # of Racks must be in between 3000 and 801 or RFS must be in between 75000 Sq. ft and 20001 Sq. ft; Medium DC # of Racks must be in between 800 and 201 or RFS must be in between 20000 Sq. ft and 5001 Sq. ft; Small DC - # of Racks must be less than 200 or RFS must be less than 5000 Sq. ft.
- TIER TYPE - According to Uptime Institute the data centers are classified into four tiers based on the proficiencies of redundant equipment of the data center infrastructure. In this segment the data center are segmented as Tier 1,Tier 2, Tier 3 and Tier 4.
- COLOCATION TYPE - The segment is segregated into 3 categories namely Retail, Wholesale and Hyperscale Colocation service. The categorization is done based on the amount of IT load leased out to potential customers. Retail colocation service has leased capacity less than 250 kW; Wholesale colocation services has leased capacity between 251 kW and 4 MW and Hyperscale colocation services has leased capacity more than 4 MW.
- END CONSUMERS - The Data Center Market operates on a B2B basis. BFSI, Government, Cloud Operators, Media and Entertainment, E-Commerce, Telecom and Manufacturing are the major end-consumers in the market studied. The scope only includes colocation service operators catering to the increasing digitalization of the end-user industries.
| Keyword | Definition |
|---|---|
| Rack Unit | Generally referred as U or RU, it is the unit of measurement for the server unit housed in the racks in the data center. 1U is equal to 1.75 inches. |
| Rack Density | It defines the amount of power consumed by the equipment and server housed in a rack. It is measured in kilowatt (kW). This factor plays a critical role in data center design and, cooling and power planning. |
| IT Load Capacity | The IT load capacity or installed capacity, refers to the amount of energy consumed by servers and network equipment placed in a rack installed. It is measured in megawatt (MW). |
| Absorption Rate | It denotes how much of the data center capacity has been leased out. For instance, if a 100 MW DC has leased out 75 MW, then the absorption rate would be 75%. It is also referred to as utilization rate and leased-out capacity. |
| Raised Floor Space | It is an elevated space built over the floor. This gap between the original floor and the elevated floor is used to accommodate wiring, cooling, and other data center equipment. This arrangement assists in having proper wiring and cooling infrastructure. It is measured in square feet/meter. |
| Computer Room Air Conditioner (CRAC) | It is a device used to monitor and maintain the temperature, air circulation, and humidity inside the server room in the data center. |
| Aisle | It is the open space between the rows of racks. This open space is critical for maintaining the optimal temperature (20-25 °C) in the server room. There are primarily two aisles inside the server room, a hot aisle and a cold aisle. |
| Cold Aisle | It is the aisle wherein the front of the rack faces the aisle. Here, chilled air is directed into the aisle so that it can enter the front of the racks and maintain the temperature. |
| Hot Aisle | It is the aisle where the back of the racks faces the aisle. Here, the heat dissipated from the equipment’s in the rack is directed to the outlet vent of the CRAC. |
| Critical Load | It includes the servers and other computer equipment whose uptime is critical for data center operation. |
| Power Usage Effectiveness (PUE) | It is a metric which defines the efficiency of a data center. It is calculated by: (𝑇𝑜𝑡𝑎𝑙 𝐷𝑎𝑡𝑎 𝐶𝑒𝑛𝑡𝑒𝑟 𝐸𝑛𝑒𝑟𝑔𝑦 𝐶𝑜𝑛𝑠𝑢𝑚𝑝𝑡𝑖𝑜𝑛)/(𝑇𝑜𝑡𝑎𝑙 𝐼𝑇 𝐸𝑞𝑢𝑖𝑝𝑚𝑒𝑛𝑡 𝐸𝑛𝑒𝑟𝑔𝑦 𝐶𝑜𝑛𝑠𝑢𝑚𝑝𝑡𝑖𝑜𝑛). Further, a data center with a PUE of 1.2-1.5 is considered highly efficient, whereas, a data center with a PUE >2 is considered highly inefficient. |
| Redundancy | It is defined as a system design wherein additional component (UPS, generators, CRAC) is added so that in case of power outage, equipment failure, the IT equipment should not be affected. |
| Uninterruptible Power Supply (UPS) | It is a device that is connected in series with the utility power supply, storing energy in batteries such that the supply from UPS is continuous to IT equipment even during utility power is snapped. The UPS primarily supports the IT equipment only. |
| Generators | Just like UPS, generators are placed in the data center to ensure an uninterrupted power supply, avoiding downtime. Data center facilities have diesel generators and commonly, 48-hour diesel is stored in the facility to prevent disruption. |
| N | It denotes the tools and equipment required for a data center to function at full load. Only "N" indicates that there is no backup to the equipment in the event of any failure. |
| N+1 | Referred to as 'Need plus one', it denotes the additional equipment setup available to avoid downtime in case of failure. A data center is considered N+1 when there is one additional unit for every 4 components. For instance, if a data center has 4 UPS systems, then for to achieve N+1, an additional UPS system would be required. |
| 2N | It refers to fully redundant design wherein two independent power distribution system is deployed. Therefore, in the event of a complete failure of one distribution system, the other system will still supply power to the data center. |
| In-Row Cooling | It is the cooling design system installed between racks in a row where it draws warm air from the hot aisle and supplies cool air to the cold aisle, thereby maintaining the temperature. |
| Tier 1 | Tier classification determines the preparedness of a data center facility to sustain data center operation. A data center is classified as Tier 1 data center when it has a non-redundant (N) power component (UPS, generators), cooling components, and power distribution system (from utility power grids). The Tier 1 data center has an uptime of 99.67% and an annual downtime of <28.8 hours. |
| Tier 2 | A data center is classified as Tier 2 data center when it has a redundant power and cooling components (N+1) and a single non-redundant distribution system. Redundant components include extra generators, UPS, chillers, heat rejection equipment, and fuel tanks. The Tier 2 data center has an uptime of 99.74% and an annual downtime of <22 hours. |
| Tier 3 | A data center having redundant power and cooling components and multiple power distribution systems is referred to as a Tier 3 data center. The facility is resistant to planned (facility maintenance) and unplanned (power outage, cooling failure) disruption. The Tier 3 data center has an uptime of 99.98% and an annual downtime of <1.6 hours. |
| Tier 4 | It is the most tolerant type of data center. A Tier 4 data center has multiple, independent redundant power and cooling components and multiple power distribution paths. All IT equipment are dual powered, making them fault tolerant in case of any disruption, thereby ensuring interrupted operation. The Tier 4 data center has an uptime of 99.74% and an annual downtime of <26.3 minutes. |
| Small Data Center | Data center that has floor space area of ≤ 5,000 Sq. ft or the number of racks that can be installed is ≤ 200 is classified as a small data center. |
| Medium Data Center | Data center which has floor space area between 5,001-20,000 Sq. ft, or the number of racks that can be installed is between 201-800, is classified as a medium data center. |
| Large Data Center | Data center which has floor space area between 20,001-75,000 Sq. ft, or the number of racks that can be installed is between 801-3,000, is classified as a large data center. |
| Massive Data Center | Data center which has floor space area between 75,001-225,000 Sq. ft, or the number of racks that can be installed is between 3001-9,000, is classified as a massive data center. |
| Mega Data Center | Data center that has a floor space area of ≥ 225,001 Sq. ft or the number of racks that can be installed is ≥ 9001 is classified as a mega data center. |
| Retail Colocation | It refers to those customers who have a capacity requirement of 250 kW or less. These services are majorly opted by small and medium enterprises (SMEs). |
| Wholesale Colocation | It refers to those customers who have a capacity requirement between 250 kW to 4 MW. These services are majorly opted by medium to large enterprises. |
| Hyperscale Colocation | It refers to those customers who have a capacity requirement greater than 4 MW. The hyperscale demand primarily originates from large-scale cloud players, IT companies, BFSI, and OTT players (like Netflix, Hulu, and HBO+). |
| Mobile Data Speed | It is the mobile internet speed a user experiences via their smartphones. This speed is primarily dependent on the carrier technology being used in the smartphone. The carrier technologies available in the market are 2G, 3G, 4G, and 5G, where 2G provides the slowest speed while 5G is the fastest. |
| Fiber Connectivity Network | It is a network of optical fiber cables deployed across the country, connecting rural and urban regions with high-speed internet connection. It is measured in kilometer (km). |
| Data Traffic per Smartphone | It is a measure of average data consumption by a smartphone user in a month. It is measured in gigabyte (GB). |
| Broadband Data Speed | It is the internet speed that is supplied over the fixed cable connection. Commonly, copper cable and optic fiber cable are used in both residential and commercial use. Here, optic cable fiber provides faster internet speed than copper cable. |
| Submarine Cable | A submarine cable is a fiber optic cable laid down at two or more landing points. Through this cable, communication and internet connectivity between countries across the globe is established. These cables can transmit 100-200 terabits per second (Tbps) from one point to another. |
| Carbon Footprint | It is the measure of carbon dioxide generated during the regular operation of a data center. Since, coal, and oil & gas are the primary source of power generation, consumption of this power contributes to carbon emissions. Data center operators are incorporating renewable energy sources to curb the carbon footprint emerging in their facilities. |
Research Methodology
Mordor Intelligence follows a four-step methodology in all our reports.
- Step-1: Identify Key Variables: In order to build a robust forecasting methodology, the variables and factors identified in Step-1 are tested against available historical market numbers. Through an iterative process, the variables required for market forecast are set and the model is built on the basis of these variables.
- Step-2: Build a Market Model: Market-size estimations for the forecast years are in nominal terms. Inflation is not a part of the pricing, and the average selling price (ASP) is kept constant throughout the forecast period for each country.
- Step-3: Validate and Finalize: In this important step, all market numbers, variables and analyst calls are validated through an extensive network of primary research experts from the market studied. The respondents are selected across levels and functions to generate a holistic picture of the market studied.
- Step-4: Research Outputs: Syndicated Reports, Custom Consulting Assignments, Databases & Subscription Platforms


