
Synthetic Leather Market Size and Share
Market Overview
| Study Period | 2021 - 2031 |
|---|---|
| Market Size (2026) | USD 48.84 Billion |
| Market Size (2031) | USD 71.86 Billion |
| Growth Rate (2026 - 2031) | 8.03 % |
| Fastest Growing Market | Asia-Pacific |
| Largest Market | Asia-Pacific |
| Market Concentration | Low |
Major Players *Disclaimer: Major Players sorted in no particular order Image © Mordor Intelligence. Reuse requires attribution under CC BY 4.0. | |
Synthetic Leather Market Analysis by Mordor Intelligence
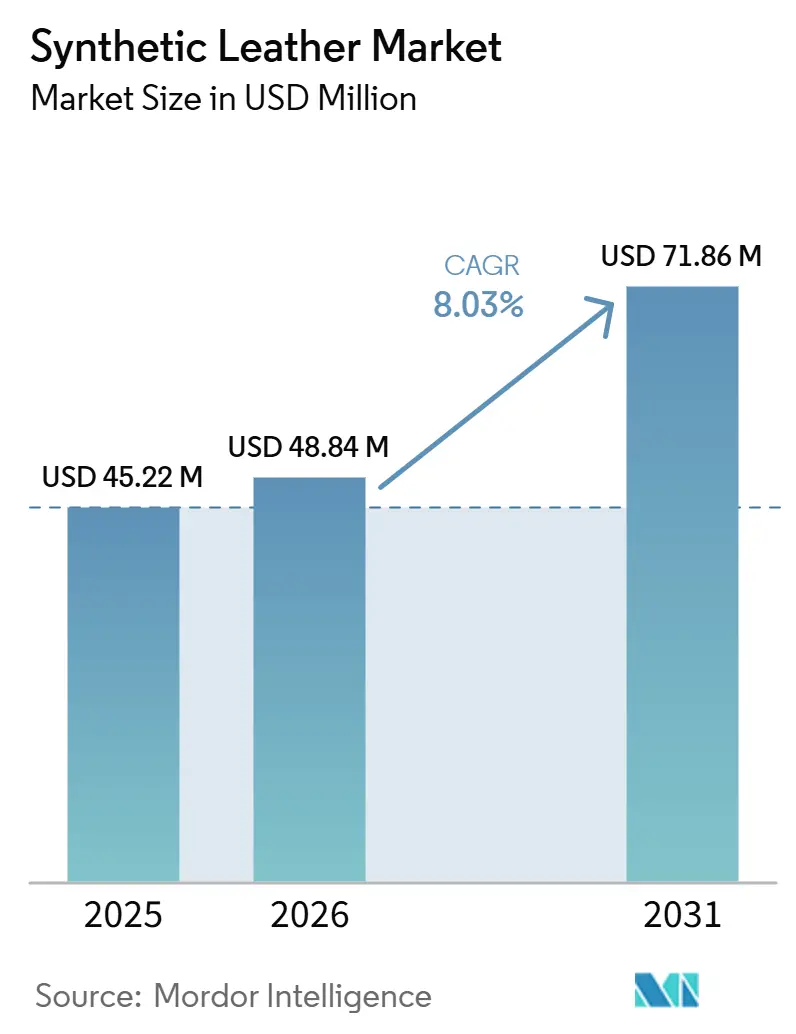
The Synthetic Leather Market size is projected to expand from USD 45.22 billion in 2025 and USD 48.84 billion in 2026 to USD 71.86 billion by 2031, registering a CAGR of 8.03% between 2026 to 2031. The synthetic leather market is evolving beyond its earlier role as a lower-cost substitute for animal hide. Buyers now expect better aesthetics, lower emissions, and cleaner material profiles in footwear, furnishings, and vehicle interiors. The shift from polyvinyl chloride (PVC) to polyurethane (PU) is driving demand, as regulatory scrutiny of solvents and persistent chemicals is pushing converters and buyers to favor formulations with lower compliance risk and better surface performance. Demand is also rising as vegan materials are incorporated into formal product specifications in fashion and automotive programs, giving the synthetic leather market a stronger foothold in premium applications rather than entry-level ones. Electric vehicle cabin design is expanding the role of coated and engineered surfaces, while solvent-free and waterborne technologies are enabling suppliers to meet stricter interior quality standards and smart-surface requirements. Growth in the synthetic leather market is moderated by hydrolysis limits in humid conditions and by the challenge of scaling bio-based grades at predictable commercial volumes. However, these issues are slowing adoption rather than reversing the longer-term shift away from PVC and animal hides.
Key Report Takeaways
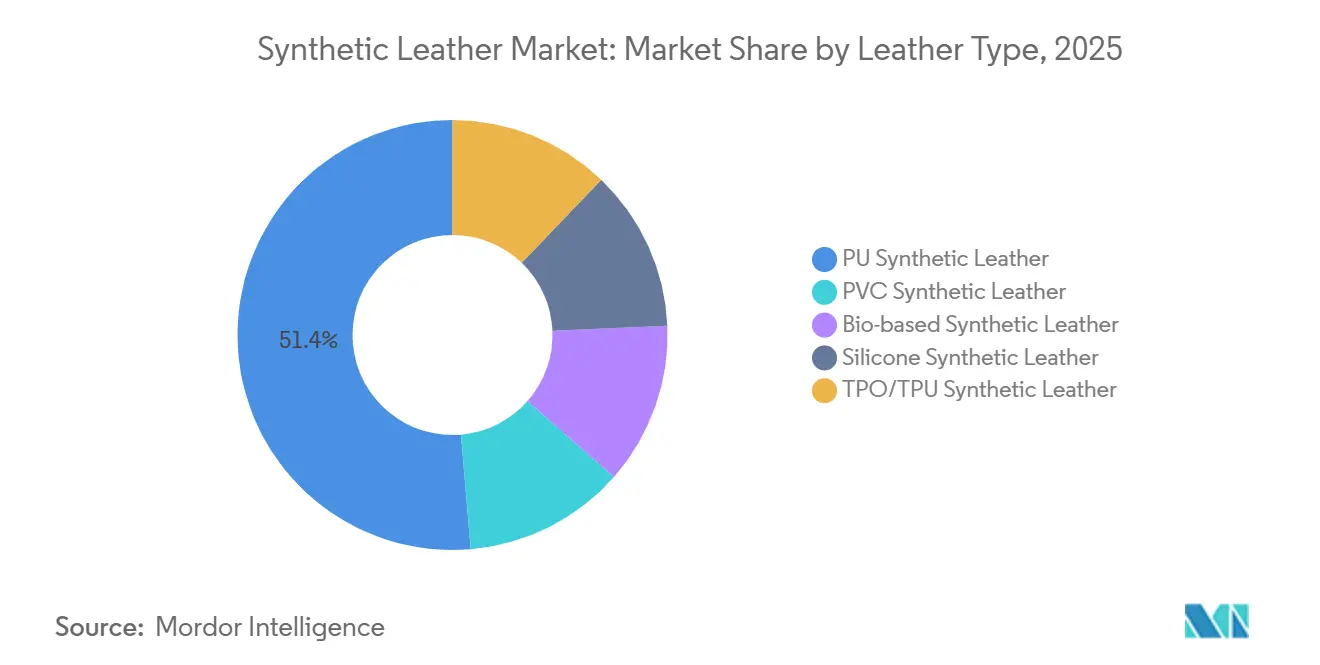
- By leather type, PU held 51.36% of the synthetic leather market share in 2025, while bio-based synthetic leather is projected to expand at 9.80% CAGR through 2031.
- By manufacturing technology, solvent-based coagulation and coating accounted for 56.40% of the synthetic leather market size in 2025, while solvent-free PU is projected to grow at 9.33% CAGR through 2031.
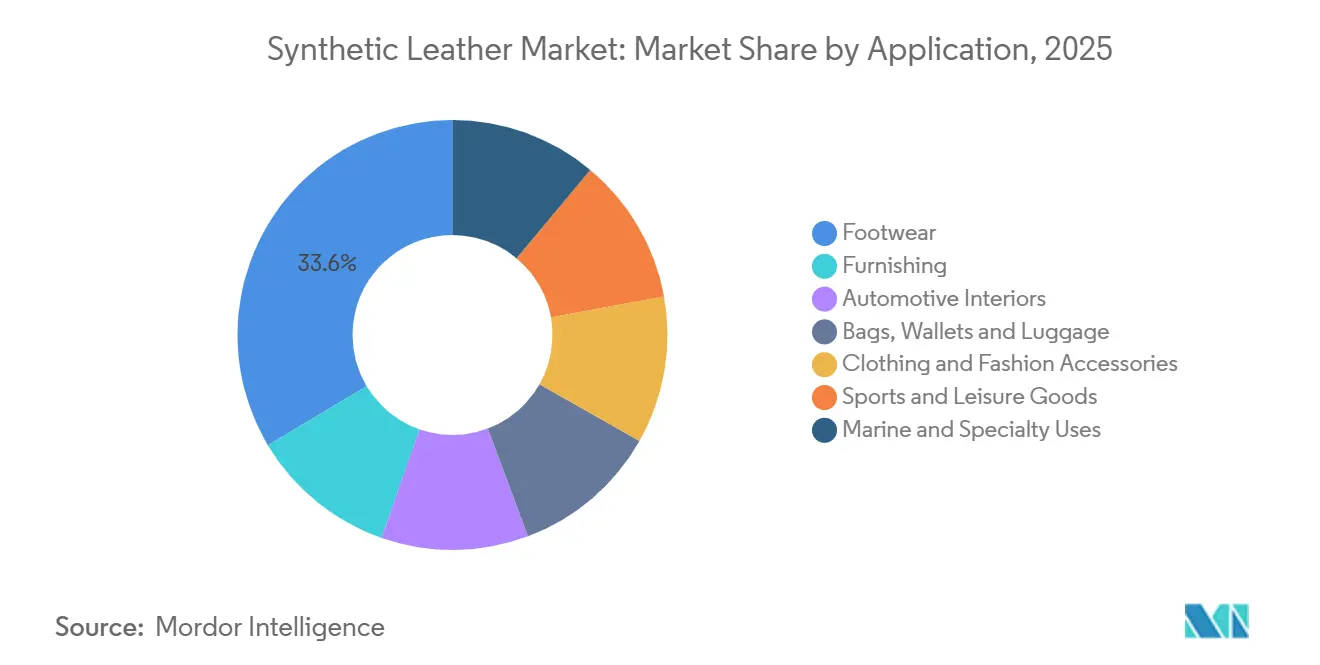
- By application, footwear represented 33.56% of the synthetic leather market size in 2025, while automotive interiors are forecast to advance at 8.42% CAGR through 2031.
- By geography, Asia Pacific held 45.71% of the synthetic leather market share in 2025 and is also projected to record the fastest regional CAGR at 8.81% through 2031
Note: Market size and forecast figures in this report are generated using Mordor Intelligence’s proprietary estimation framework, updated with the latest available data and insights as of January 2026.
Market Trends and Insights
Drivers Impact Analysis of Synthetic Leather Market*
| Drivers | (~) % Impact on CAGR Forecast | Geographic Relevance | Impact Timeline |
|---|---|---|---|
| PU Replacing PVC and Other Conventional Materials | +2.2% | Global, concentrated in China, South Asia, and Southeast Asia | Short term (≤ 2 years) |
| Vegan Material Demand Across Fashion and Automotive | +1.5% | North America, Europe and East Asia | Medium term (2-4 years) |
| Automotive Cabin Premiumization and EV Interior Demand | +1.8% | Asia Pacific, Europe, North America | Medium term (2-4 years) |
| Waterborne and Solvent-Free Technology Enablement | +1.2% | Global, early gains in China and EU-regulated markets | Short term (≤ 2 years) |
| Hidden Human-Machine Interface (HMI) and Transparent Smart Surface Integration | +0.8% | Europe, North America, Japan, South Korea | Long term (≥ 4 years) |
| Source: Mordor Intelligence | |||
PU Replacing PVC: Formulation Economics Shift the Base Material
The synthetic leather market is seeing a steady shift toward PU, as it offers a more favorable balance of compliance readiness, visual quality, and suitability for premium applications than PVC. Residual dimethylformamide limits in finished articles increase the operating burden on conventional solvent-heavy lines, as multiple hot-water washes may be required to meet stricter thresholds, raising both process costs and energy use[1]. This pressure is most significant in high-volume supply chains where buyers want lower solvent exposure without sacrificing grain finish, softness, or consistency. Larger converters with upgraded coating capacity are better positioned in the synthetic leather market, as they can absorb retrofit costs and respond more quickly to buyer qualification requirements. The result is a faster transition in the base material mix, with PU strengthening its position in categories where appearance, compliance, and durability are evaluated together.
Vegan-Material Demand: OEM Commitments are Hardening into Procurement Specs
The synthetic leather market is gaining support from a broader shift toward animal-free materials in both fashion and vehicle interiors. Mercedes-Benz introduced a vegan-certified electric vehicle interior featuring ARTICO synthetic leather across major touchpoints, demonstrating that animal-free content is now part of product specification rather than marketing language. Hyundai CRADLE also partnered with UNCAGED Innovations in August 2025 to develop grain-based leather alternatives for vehicles, indicating that automakers are investing upstream in material development rather than waiting for standard commercial supply[2]. These changes raise quality requirements in the synthetic leather market, as producers now need to offer traceable, technically stable variants that can meet stricter procurement requirements. This also widens the path for premium pricing where brands want lower environmental impact without compromising tactile quality or visual consistency.
Automotive Cabin Premiumization: EV Architecture Redefines the Substrate
The synthetic leather market is benefiting from the shift in interior design priorities driven by electric vehicles. Flat floors, quieter cabins, and cleaner dashboard layouts make surface feel and surface function more prominent to both automakers and passengers, so the amount of engineered trim per vehicle can rise even when total cabin complexity falls. This shift supports higher-value applications for coated materials, as seats, door trims, and interactive panels are now expected to combine comfort, design, and interface utility in the same layer. The SASS research project, supported by imec and VLAIO, demonstrated new ways to embed printed electronics between layers of flexible synthetic leather, strengthening the case for smart-surface use in future cabin systems. Vulcaflex S.p.A. reinforced this opportunity in June 2026 by committing almost USD 70 million to a first North American manufacturing facility in Auburn, Alabama, intended for the production of automotive synthetic leather for the United States, Canada, and Mexico.
Waterborne and Solvent-Free Technology: The New Production Baseline
The synthetic leather market is undergoing a technology shift as cleaner production routes become part of competitive positioning. Waterborne and solvent-free polyurethane (PU) systems are relevant not only for regulatory reasons, but also because they help suppliers align with stricter cabin air quality expectations and brand sustainability targets. A 2026 study in Colloids and Surfaces A showed that waterborne polyurethane with polyol synergy can achieve soft yet resilient structures through physical foaming, helping narrow the trade-off between eco-compliance and haptic performance. A 2025 study in the Journal of the American Leather Chemists Association also showed that waterborne PU requires careful formulation control during microfiber impregnation, particularly when alkali resistance and process stability are important. Even with those formulation demands, the synthetic leather market is moving toward a lower-solvent production baseline as the cost advantage of older chemistry narrows with rising compliance pressure.
Restraints Impact Analysis of Synthetic Leather Market*
| Restraints | (~) % Impact on CAGR Forecast | Geographic Relevance | Impact Timeline |
|---|---|---|---|
| PFAS, DMF, and Vinyl-Based Chemical Regulatory Pressure | -0.9% | EU, France, North America, China | Short term (≤ 2 years) |
| Hydrolysis and Heat-Aging Durability Limitations | -0.6% | Southeast Asia, South America, marine, and specialty uses in humid climates | Medium term (2-4 years) |
| Bio-Based Synthetic Leather Cost and Scalability Constraints | -0.5% | Global | Long term (≥ 4 years) |
| Source: Mordor Intelligence | |||
PFAS, DMF, and Vinyl-Based Chemical Regulations: Compliance Cost as a Market Reshaper
Tighter regulations on PFAS, DMF, and vinyl-linked formulations present a clear restraint for the synthetic leather market, as compliance now affects both chemical choices and export readiness. The EU perfluorohexanoic acid (PFHxA) regulation adds pressure on affected product categories, including clothing, accessories, and related coated materials, narrowing the scope for legacy treatments in European channels. France has also introduced restrictions on PFAS-containing textiles and footwear effective January 2026, increasing the urgency for reformulation and testing among suppliers that serve those product lines. For mid-tier exporters, the challenge extends beyond chemical substitution to include the costs of documentation, batch testing, and recall prevention when a single production line serves multiple end markets. This slows parts of the synthetic leather market, as smaller manufacturers may delay upgrades, lose access to premium channels, or shift toward lower-specification applications where compliance requirements are less stringent.
Hydrolysis and Heat-Aging Durability: A Hidden Barrier to Market Expansion
The synthetic leather market continues to face performance limitations in humid and hot conditions, as hydrolysis can shorten the service life of standard polyester-based polyurethane (PU) products. Industry material guidance and chemistry research identify chain scission and bond weakness as the root causes, while more resistant formulations, such as polycarbonate PU, perform better over longer use cycles. The Journal of the American Leather Chemists Association noted that waterborne PU systems can exhibit weak alkali resistance at elevated temperatures during microfiber impregnation, adding further formulation complexity to advanced products. This issue is relevant in tropical markets, marine applications, and mid-priced categories where buyers may not assess long-term durability before purchase. Bio-based grades pose an additional restraint in the synthetic leather market, as scale-up, cost stability, and supply predictability still lag behind those of petroleum-based PU in large commercial programs.
*Our forecasts treat driver/restraint impacts as directional, not additive. The impact forecasts reflect baseline growth, mix effects, and variable interactions.
Synthetic Leather Market Segment Analysis
By Leather Type:
PU Dominance Coexists with Bio-Based DisruptionPU accounted for 51.36% of total demand in 2025, maintaining a clear lead over other leather types in the synthetic leather market. This position reflects its ability to meet a wider range of performance and appearance requirements than PVC, particularly in premium footwear, upholstery, and vehicle interiors. Bio-based synthetic leather is the fastest-growing leather type, projected to expand at a 9.80% CAGR through 2031, indicating a demand shift even before full cost parity is achieved. PVC retains a presence in price-sensitive applications such as entry-level footwear and lower-end furnishings, supported by a large installed process base and cost advantages. Silicone and TPO/TPU variants hold smaller shares in the synthetic leather market but are gaining traction in applications where heat stability, weather resistance, or specialized surface performance take priority over price.
The leather type mix also reflects the pace of technical development in the synthetic leather industry. A 2025 study in ACS Sustainable Chemistry & Engineering found that bio-based poly(ester amide) coatings derived from 1,4-butanediol and adipic acid achieved tensile strength 8 times higher than constituent homopolymers and delivered more than 60% biodegradation relative to cellulose under composting conditions within one month. This progress supports the case for premium bio-based materials by narrowing the gap between sustainability and usable performance. PU is therefore likely to retain its lead through the forecast period, while bio-based grades expand first in programs where branding, compliance, and supplier collaboration carry more weight than lowest-cost output.

By Manufacturing Technology:
Solvent-Based Incumbency Under Systematic PressureSolvent-based coagulation and coating held 56.40% of production volume in 2025, reflecting the extent to which the installed base continues to shape the synthetic leather market. Solvent-free PU is projected to grow at a 9.33% CAGR through 2031, making it the fastest-growing manufacturing technology in the report. This gap between current scale and future growth reflects a market that is still operating on older equipment while preparing for new chemical standards. Water-based PU coating remains an important transitional technology, as it eliminates DMF while fitting many converters better than a full shift to solvent-free production. The synthetic leather market is therefore undergoing a gradual transition in which producers adopt cleaner processes at varying speeds based on end-use exposure, customer mix, and capital capacity.
Recent research supports this technical direction. A 2026 Colloids and Surfaces A study showed that waterborne PU systems can achieve stable foaming and acceptable mechanical performance when resin formulation is carefully engineered, strengthening confidence in scalable lower-emission production routes. A 2025 JALCA paper also indicated that process stability, peel strength, and alkali resistance still require close control in microfiber applications, confirming that the transition is feasible but not straightforward. The synthetic leather industry is therefore moving steadily from full solvent reliance toward waterborne and fully solvent-free output, favoring suppliers that can demonstrate both regulatory compliance and product consistency at commercial scale.
By Application:
Footwear Holds Volume, Automotive Commands ValueFootwear accounted for 33.56% of the total value in 2025, making it the largest end-use segment in the synthetic leather market. This position is driven by the large volume of synthetic leather consumed in budget and mid-market shoe production, particularly across Asian manufacturing hubs. Automotive interiors are forecast to grow at an 8.42% CAGR through 2031, making them the fastest-growing application in the synthetic leather market. This growth reflects broader surface use in EV cabins, stricter low-emission requirements, and increasing acceptance of vegan interior specifications among vehicle manufacturers. Furnishing remains a stable mid-tier application, as chairs, sofas, and upholstery continue to require easy-clean, visually consistent surfaces across multiple price points.
Further application growth is emerging where differentiation carries more value than simple material substitution. Bags, wallets, and luggage offer an accessible entry point for bio-based grades, as development cycles are shorter and qualification barriers are lower than in the automotive sector. Clothing and fashion applications also support stronger pricing when branded PU finishes can replicate a vegetable-tanned appearance without animal-derived inputs. In automotive, research by imec and Quad Industries under the SASS program demonstrated that printed electronics can be embedded within flexible surface layers, indicating a potential future demand path for the synthetic leather market. Marine and specialty applications remain smaller in volume but are important for silicone and thermoplastic polyolefin (TPO)/thermoplastic polyurethane (TPU) suppliers, as these chemistries address UV exposure, salt, and thermal stress more effectively than standard polyurethane (PU) in demanding environments.
Geography Analysis
APAC Synthetic Leather Market
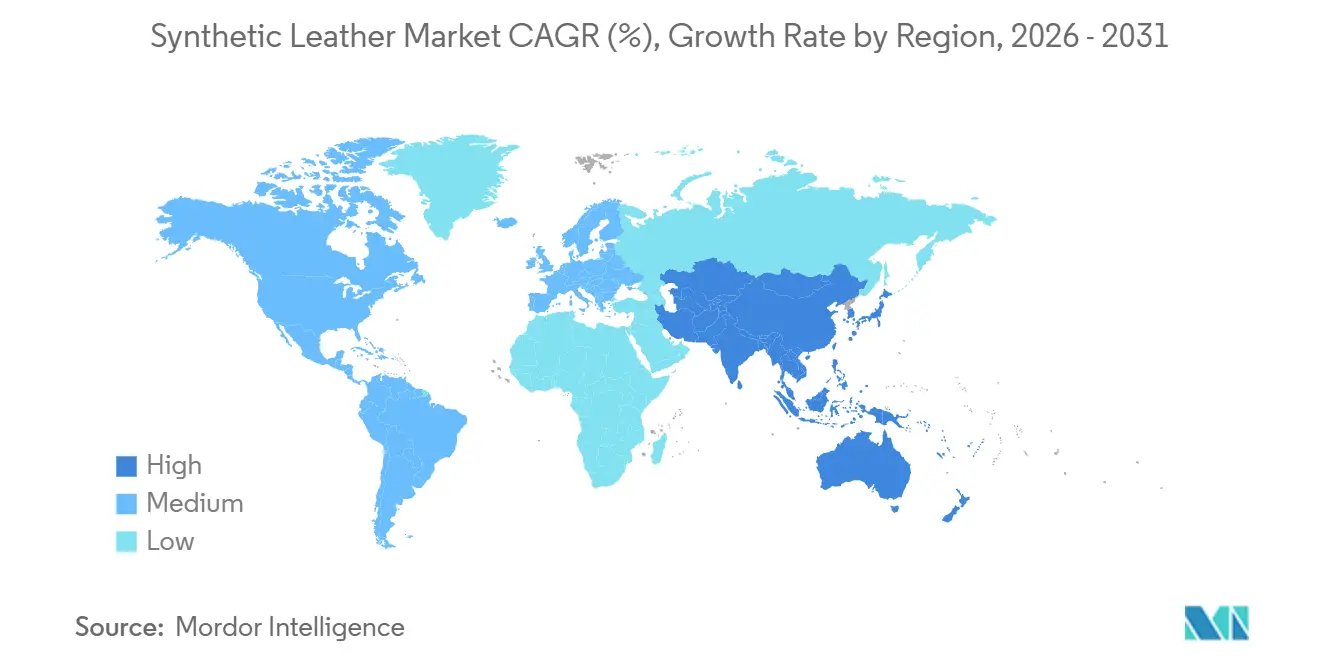
Asia-Pacific accounted for 45.71% of global demand in 2025 and is forecast to grow at a 8.81% CAGR through 2031, making it both the largest and fastest-growing region in the synthetic leather market. The region benefits from China's large converting base, India's expanding footwear manufacturing position, and a dense supply chain linking raw materials, coating capacity, and export channels. This combination gives Asia-Pacific a scale advantage in mainstream categories while supporting a gradual shift toward higher-grade PU output. Japan remains relevant in the premium tier, with companies such as Toray Industries, Kuraray, and Asahi Kasei holding established positions in microfiber and high-performance materials for automotive and fashion applications. Given the region's depth, many technology and cost transitions in the broader synthetic leather market continue to originate in Asia-Pacific before spreading to other regions.
North America and Europe Synthetic Leather Market
North America and Europe represent the highest-value regional pair in the synthetic leather market, driven by regulatory compliance requirements and interior quality expectations that are more stringent than in most other regions. Demand in both regions is supported by premium waterborne and solvent-free PU grades that meet lower-emission and higher-performance product specifications. Vulcaflex S.p.A. reflected this trend in June 2026 with its plan to invest almost USD 70 million in its first North American plant in Auburn, Alabama, to supply automotive customers across the United States, Canada, and Mexico. In Europe, tighter chemical regulations and stricter buyer requirements continue to support demand for upgraded PU systems, even as total volume growth remains slower than in Asia.
South America and MEA Synthetic Leather Market
South America, the Middle East, and Africa represent a longer-cycle opportunity for the synthetic leather market, with demand tied to footwear output, furnishing consumption, and the gradual localization of automotive assembly. Brazil and Argentina remain the primary South American demand centers, where regional footwear manufacturing creates a meaningful market for coated materials at competitive prices. Saudi Arabia and the UAE serve as the main consumption hubs in the Middle East, supported by demand for hospitality furnishings and fashion retail. Growth across these regions remains below the global average due to less developed converter infrastructure and inconsistent enforcement of quality and sustainability standards. As a result, lower-cost polyvinyl chloride (PVC)-heavy products are likely to remain prevalent in these markets for longer than in Europe or North America.
Competitive Landscape
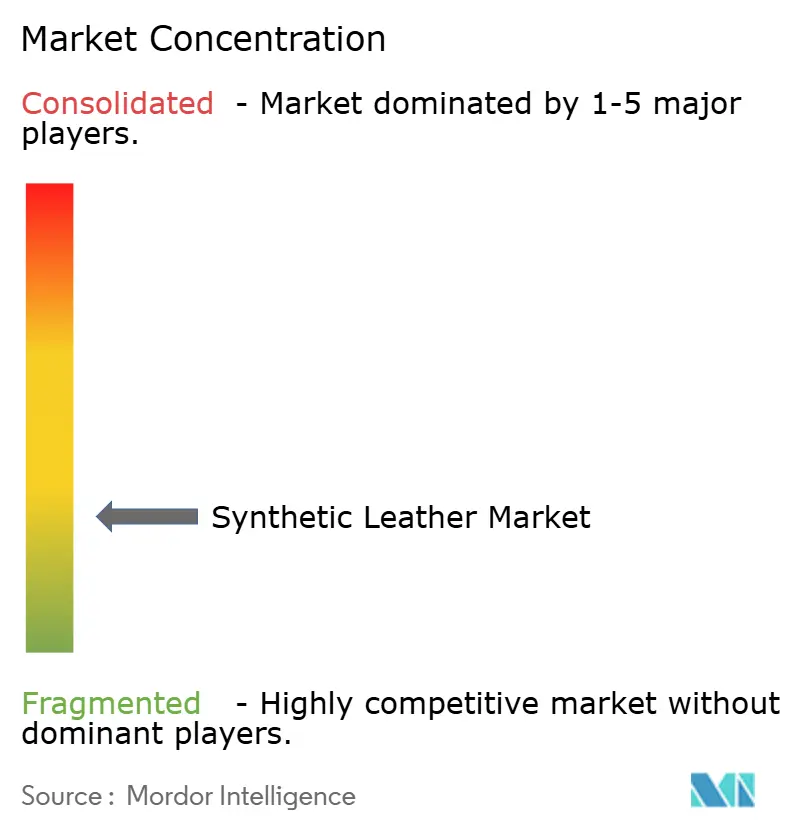
The synthetic leather market is fragmented at the converter level, but technical influence is concentrated among a smaller group of specialty fiber and chemical suppliers. Toray Industries, Kuraray, Asahi Kasei, and Teijin hold positions in microfiber and high-performance substrate layers, where material expertise and long qualification cycles create entry barriers. At the mid-market level, suppliers such as Anhui Anji, FILWEL, Fujian Polytech, Nan Ya Plastics, and San Fang Chemical compete on price, capacity, and export reliability. BASF and Covestro shape the upstream technology path by supplying polyurethane systems that affect surface quality, emissions, and process readiness. This gives the synthetic leather market a two-speed structure, with premium positions driven by technical specifications and larger-volume segments driven by cost and manufacturing scale.
Recent strategic moves indicate that suppliers are working to secure positions in higher-value demand rather than only adding undifferentiated capacity. Covestro collaborated with Marquardt and E Ink in 2025 to develop responsive integrated surfaces for automotive interiors, demonstrating how polyurethane (PU)-coated synthetic leather can support embedded display and interface functions. Hyundai CRADLE's August 2025 partnership with Uncaged Innovations reflects a similar direction from the buyer side, as vehicle manufacturers are actively shaping next-generation animal-free materials rather than waiting for mature supply to emerge. Vulcaflex S.p.A. also expanded geographically in June 2026 with its Alabama investment, placing dedicated capacity close to major North American automotive production zones.
The most open competitive space in the synthetic leather market lies between bio-based content and automotive-grade durability. No supplier covered in this report is described as having a fully scalable bio-based synthetic leather platform that has completed the full automotive seat qualification cycle, leaving room for a first mover with proven performance and reliable output. This gap is significant because premium buyers increasingly require both sustainability credentials and long service life, rather than one at the expense of the other. Suppliers that can combine low-emission chemistry, stable weathering performance, and smart-surface compatibility are likely to secure specification positions over the forecast period. The synthetic leather market remains competitive enough to prevent extreme concentration, yet differentiated enough for a small number of technically capable players to shape the direction of materials and applications.
Synthetic Leather Industry Leaders
-
KURARAY CO., LTD.
-
NAN YA PLASTICS CORPORATION
-
TEIJIN LIMITED
-
San Fang Chemical Industry Co., Ltd.
-
Mayur Uniquoters Limited
- *Disclaimer: Major Players sorted in no particular order
Synthetic Leather Market Companies Covered in this Report
- Anhui Anli Material Technology Co., Ltd.
- Asahi Kasei Corporation
- Baiksan Co., Ltd.
- BASF SE
- Continental AG
- Covestro AG
- Dow Inc.
- FILWEL Co., Ltd.
- Fujian Polytech Technology Corp., Ltd.
- H.R. Polycoats Pvt. Ltd.
- Jasch Industries Limited
- Kolon Industries, Inc.
- KURARAY CO., LTD.
- Mayur Uniquoters Limited
- NAN YA PLASTICS CORPORATION
- Responsive Industries Limited
- San Fang Chemical Industry Co., Ltd.
- Seiren Co., Ltd.
- TEIJIN LIMITED
- Toray Industries, Inc.
- Wanhua Chemical Group Co., Ltd.
Recent Industry Developments in Synthetic Leather Market
- June 2026: Vulcaflex S.p.A., an Italian automotive synthetic leather manufacturer, announced an investment of approximately USD 70 million to establish its first North American manufacturing facility in Auburn, Alabama, creating 130 jobs. The plant will produce synthetic leather materials for the automotive industry across the US, Canada, and Mexico, expanding Vulcaflex's geographic presence from its base in Ravenna, Italy.
- August 2025: UltraSense Systems (San Jose) and Mankiewicz (Hamburg) announced a collaboration combining Mankiewicz's INSIGHT ShyTech hidden-until-lit coating with UltraSense's integrated HMI controllers to develop smart surfaces for vehicle interiors and exteriors. The partnership enables synthetic leather surfaces to host touch controls that remain invisible until activated.
Global Synthetic Leather Market Report Scope
Synthetic leather is a man-made alternative to animal leather. It is produced by treating a fabric base, such as polyester or cotton, with polymers to replicate the look, feel, and texture of natural leather at a lower cost.
The synthetic leather market is segmented by leather type, manufacturing technology, application, and geography. By leather type, the market is segmented into PU synthetic leather, PVC synthetic leather, bio-based synthetic leather, silicone synthetic leather, and TPO/TPU synthetic leather. By manufacturing technology, the market is segmented into solvent-based coagulation and coating, water-based PU coating, and solvent-free PU systems. By application, the market is segmented into footwear, furnishing, automotive interiors, bags, wallets, and luggage, clothing and fashion accessories, sports and leisure goods, and marine and specialty uses. The report also covers market size and forecasts for synthetic leather across 18 countries in major regions. The market sizes and forecasts are provided in terms of value (USD).
Segmentation Overview
| PU Synthetic Leather |
| PVC Synthetic Leather |
| Bio-based Synthetic Leather |
| Silicone Synthetic Leather |
| TPO/TPU Synthetic Leather |
| Solvent-based Coagulation and Coating |
| Water-based PU Coating |
| Solvent-free PU Systems |
| Footwear | |
| Furnishing | Chairs |
| Sofas | |
| Other Upholstery | |
| Automotive Interiors | Seats |
| Door Trims and Panels | |
| Dashboard and Instrument Panel Surfaces | |
| Steering Wheel and Console Surfaces | |
| Other Interior Surfaces | |
| Bags, Wallets and Luggage | Wallets |
| Bags | |
| Purses | |
| Clothing and Fashion Accessories | Jackets |
| Belts | |
| Other Apparel Accessories | |
| Sports and Leisure Goods | |
| Marine and Specialty Uses |
| Asia-Pacific | China |
| Japan | |
| India | |
| South Korea | |
| Rest of Asia-Pacific | |
| North America | United States |
| Canada | |
| Mexico | |
| Europe | Germany |
| United Kingdom | |
| France | |
| Italy | |
| Spain | |
| Russia | |
| Rest of Europe | |
| South America | Brazil |
| Argentina | |
| Rest of South America | |
| Middle-East and Africa | Saudi Arabia |
| United Arab Emirates | |
| South Africa | |
| Rest of Middle-East and Africa |
| By Leather Type | PU Synthetic Leather | |
| PVC Synthetic Leather | ||
| Bio-based Synthetic Leather | ||
| Silicone Synthetic Leather | ||
| TPO/TPU Synthetic Leather | ||
| By Manufacturing Technology | Solvent-based Coagulation and Coating | |
| Water-based PU Coating | ||
| Solvent-free PU Systems | ||
| By Application | Footwear | |
| Furnishing | Chairs | |
| Sofas | ||
| Other Upholstery | ||
| Automotive Interiors | Seats | |
| Door Trims and Panels | ||
| Dashboard and Instrument Panel Surfaces | ||
| Steering Wheel and Console Surfaces | ||
| Other Interior Surfaces | ||
| Bags, Wallets and Luggage | Wallets | |
| Bags | ||
| Purses | ||
| Clothing and Fashion Accessories | Jackets | |
| Belts | ||
| Other Apparel Accessories | ||
| Sports and Leisure Goods | ||
| Marine and Specialty Uses | ||
| By Geography | Asia-Pacific | China |
| Japan | ||
| India | ||
| South Korea | ||
| Rest of Asia-Pacific | ||
| North America | United States | |
| Canada | ||
| Mexico | ||
| Europe | Germany | |
| United Kingdom | ||
| France | ||
| Italy | ||
| Spain | ||
| Russia | ||
| Rest of Europe | ||
| South America | Brazil | |
| Argentina | ||
| Rest of South America | ||
| Middle-East and Africa | Saudi Arabia | |
| United Arab Emirates | ||
| South Africa | ||
| Rest of Middle-East and Africa | ||
Key Questions Answered in the Report
What is the size of Synthetic Leather Market?
The Synthetic Leather Market size stands at USD 48.84 billion in 2026 and is forecast to reach USD 71.86 billion by 2031 at 8.03% CAGR over 2026-2031.
Which material type leads to demand today?
PU is the leading leather type, with 51.36% share in 2025, supported by better appearance, wider application fit, and lower compliance risk than PVC.
Which end use is growing the fastest through 2031?
Automotive interiors are projected to grow at a 8.42% CAGR through 2031, driven by EV cabins requiring more visible surface area and buyers increasingly specifying animal-free interiors.
What is pushing suppliers toward solvent-free and waterborne PU?
Tighter chemical rules, lower-emission product expectations, and better research support for waterborne and solvent-free performance are all accelerating the shift.