
Syndicated Loans Market Size and Share
Market Overview
| Study Period | 2020 - 2031 |
|---|---|
| Market Size (2026) | USD 7.5 Trillion |
| Market Size (2031) | USD 9.80 Trillion |
| Growth Rate (2026 - 2031) | 5.40 % |
| Fastest Growing Market | Middle East and Africa |
| Largest Market | North America |
| Market Concentration | Low |
Major Players *Disclaimer: Major Players sorted in no particular order Image © Mordor Intelligence. Reuse requires attribution under CC BY 4.0. | |
Syndicated Loans Market Analysis by Mordor Intelligence
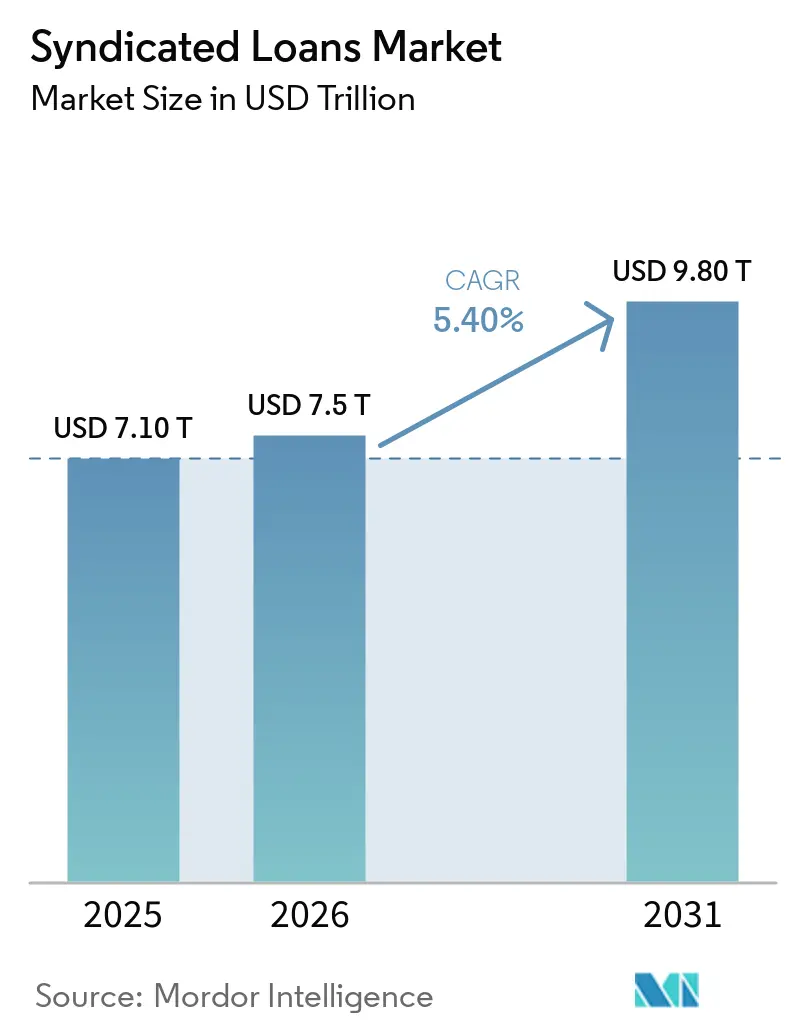
The Syndicated Loans Market size was valued at USD 7.10 trillion in 2025 and is estimated to grow from USD 7.5 trillion in 2026 to reach USD 9.80 trillion by 2031, at a CAGR of 5.40% during the forecast period (2026-2031).
The syndicated loans market entered 2026 with support from refinancing needs, recovering merger and acquisition activity, and large infrastructure funding requirements. Borrowers are also returning to multi-lender facilities where syndicated pricing remains more favorable than private credit for suitable transactions. A large concentration of maturities between 2027 and 2028 is likely to keep refinancing activity central to the syndicated loans market. The syndicated loans market also depends on steady collateralized loan obligation demand and reliable secondary trading to distribute new loans. Competitive conditions differ by transaction type, as banks compete on balance-sheet capacity, distribution reach, pricing, and execution certainty.
Key Report Takeaways
- By borrower type, non-sponsor-backed corporate borrowers held 48.3% of the syndicated loans market share in 2025, while sponsor-backed corporate borrowers are projected to grow at 7.2% CAGR through 2031.
- By loan purpose, refinancing captured 48.9% of the syndicated loans market share in 2025, while acquisition-related financing is projected to grow at 7.8% CAGR through 2031.
- By industry vertical, financial services accounted for 23.3% of the syndicated loans market share in 2025, while technology, media, and telecommunications is projected to grow at 8.1% CAGR through 2031.
- By deal size, large-cap deals captured 72% of the syndicated loans market share in 2025, while upper middle-market deals are projected to grow at 6.9% CAGR through 2031.
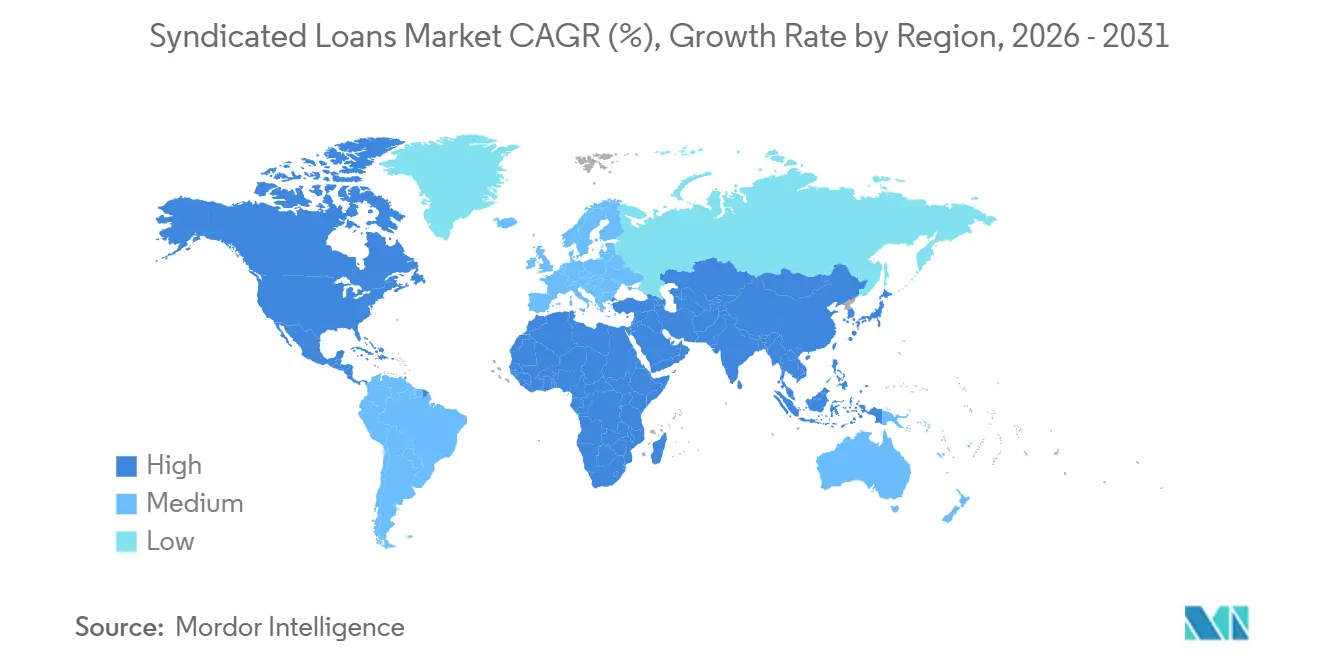
- By geography, North America captured 59.6% of the syndicated loans market share in 2025, while the Middle East and Africa are projected to grow at 8.5% CAGR through 2031.
Note: Market size and forecast figures in this report are generated using Mordor Intelligence’s proprietary estimation framework, updated with the latest available data and insights as of January 2026.
Market Trends and Insights
Drivers Impact Analysis of Syndicated Loans Market*
| Driver | (~) % Impact on CAGR Forecast | Geographic Relevance | Impact Timeline |
|---|---|---|---|
| Elevated Refinancing and Debt Maturity Requirements Driving Large-Scale Syndicated Borrowing | +1.5% | Global, concentrated in North America and EMEA | Short term (≤ 2 years) |
| Bank Capital, Concentration and Balance-Sheet Limits Increasing Demand for Risk Sharing | +0.9% | Global, with a pronounced effect in the EU and United Kingdom under Basel IV implementation | Medium term (2-4 years) |
| Recovery in M&A and Leveraged Buyout Activity Increasing Demand for Large Multi-Lender Facilities | +1.1% | North America, EMEA, Asia-Pacific, Japan, and Australia | Medium term (2-4 years) |
| Competitive Pricing Advantage Over Private Credit Driving Borrowers Toward Syndicated Financing | +0.7% | North America and Western Europe | Short term (≤ 2 years) |
| Larger and More Complex Financing Requirements Increasing the Need for Syndicated Funding Capacity | +0.5% | Global, including AI and data center hubs in North America and Asia-Pacific | Long term (≥ 4 years) |
| Deepening Institutional Participation and Secondary Market Liquidity Supporting Loan Distribution | +0.4% | North America and core EMEA, with spillover to Asia-Pacific | Medium term (2-4 years) |
| Source: Mordor Intelligence | |||
Elevated Refinancing and Debt Maturity Requirements Driving Large-Scale Syndicated Borrowing
The 2027 to 2028 maturity wall is a major source of demand for the syndicated loans market. United States loans maturing across 2026 to 2028 total USD 344 billion, and 52% of that amount is rated B- or lower, which raises refinancing risk for weaker borrowers. The refinancing cycle has encouraged issuers with stronger credit profiles to act early and secure longer maturities. European leveraged loan issuance exceeded USD 442 billion in 2025, with refinancing and repricing transactions accounting for nearly 90% of the total. The large supply of higher-quality refinancing candidates has also kept spreads under pressure, even as loan volumes have increased. Borrowers are timing refinancings around documentation and investor conditions, which continues to shape syndicated loan activity.
Bank Capital, Concentration and Balance-Sheet Limits Increasing Demand for Risk Sharing
Bank capital rules and single-name concentration limits support the use of syndication for large exposures. As of 2026, research based on AnaCredit and DealScan data found that a one-standard-deviation fall in a bank’s capital ratio doubled the probability that a loan would be syndicated[1]. This relationship makes risk sharing more important as capital requirements rise and banks manage concentrated lending positions. Banks can originate loans, retain selected exposure, and distribute the remainder to other lenders and institutional investors. This approach can also increase secondary trading activity and support the collateralized loan obligation investor base. The syndicated loans market therefore benefits when bank balance-sheet limits make hold-to-maturity lending less practical.
Recovery in M&A and Leveraged Buyout Activity Increasing Demand for Large Multi-Lender Facilities
A recovery in merger and acquisition activity is increasing demand for large multi-lender financing packages. Global merger and acquisition deal values are projected to exceed USD 4 trillion in 2026, supported by lower short-term rates, private equity capital, and a more accommodative regulatory setting. United States, merger and acquisition broadly syndicated loan volume reached USD 142 billion in 2025, including USD 59.4 billion of leveraged buyout volume. Large transactions test the distribution capacity of arrangers because underwriting commitments must be sold to a broad lender group. Successful syndications can attract new collateralized loan obligation formation and widen the institutional investor base. This activity provides an important source of new-money volume as refinancing activity becomes less dominant.
Deepening Institutional Participation and Secondary Market Liquidity Supporting Loan Distribution
Secondary market liquidity supports the ability of arrangers to distribute loans after underwriting. United States secondary loan trading reached USD 971 billion in 2025 and rose to a quarterly record of USD 288 billion in the first quarter of 2026. The trailing 12-month trading total exceeded USD 1 trillion for the first time during the first quarter of 2026[2]. Collateralized loan obligations remain important buyers of broadly syndicated loans and influence new-issue pricing. Digital data platforms can reduce reconciliation work and improve the flow of loan information between agents and lenders. Barclays’ agented United States broadly syndicated loan deals became available on Versana’s centralized platform in July 2026 through an API integration[3].
Restraints Impact Analysis of Syndicated Loans Market*
| Restraint | (~) % Impact on CAGR Forecast | Geographic Relevance | Impact Timeline |
|---|---|---|---|
| Private Credit’s Speed, Execution Certainty and Structural Flexibility Diverting Transactions from Syndicated Loans | -1.2% | Global, particularly acute in North America and Western Europe for middle-market transactions | Short term (≤ 2 years) |
| Multi-Lender Underwriting, Coordination and Syndication Processes Extending Deal Execution | -0.6% | Global | Short term (≤ 2 years) |
| Underwriting and Distribution Risk During Interest-Rate, Credit Spread and Liquidity Volatility | -0.8% | Global, with a pronounced effect in EMEA and Asia-Pacific during geopolitical events | Medium term (2-4 years) |
| Dependence on Institutional Investor and CLO Demand for Efficient Loan Distribution | -0.5% | North America and core EMEA | Medium term (2-4 years) |
| Source: Mordor Intelligence | |||
Private Credit’s Speed, Execution Certainty and Structural Flexibility Diverting Transactions from Syndicated Loans
Private credit remains a material restraint on the syndicated loans market, especially in middle-market financing. Direct lenders can provide confidentiality, flexible covenants, and a single-counterparty process for borrowers that value execution certainty. Broadly syndicated loans can offer lower pricing, but that advantage may not outweigh speed or structural flexibility for every borrower. The middle market is especially exposed because unitranche structures can remove the coordination required for a multi-lender process. Sponsor-backed borrowers continue to compare both sources of capital when assessing financing options. The syndicated loans market is likely to retain an advantage for transactions that need the scale and liquidity of a broad lender base.
Underwriting and Distribution Risk During Interest-Rate, Credit Spread and Liquidity Volatility
Interest-rate movements, credit-spread changes, and geopolitical disruption can increase underwriting and distribution risk. Global syndicated loan volume declined 12% year over year to USD 1.37 trillion in the first quarter of 2026, while Asia-Pacific volume fell 43% and EMEA volume fell 23%. A widening of secondary spreads after underwriting can expose arrangers to mark-to-market losses on loans that have not yet been distributed. The concentration of lower-rated maturities in 2028 can amplify this pressure if refinancing windows narrow. Persistent inflation and restrictive monetary policy can keep borrowing costs elevated and delay a broader recovery in leveraged merger and acquisition activity. These conditions can compress arranger fees and place more loans temporarily on bank balance sheets.
*Our forecasts treat driver/restraint impacts as directional, not additive. The impact forecasts reflect baseline growth, mix effects, and variable interactions.
Syndicated Loans Market Segment Analysis
By Borrower Type:
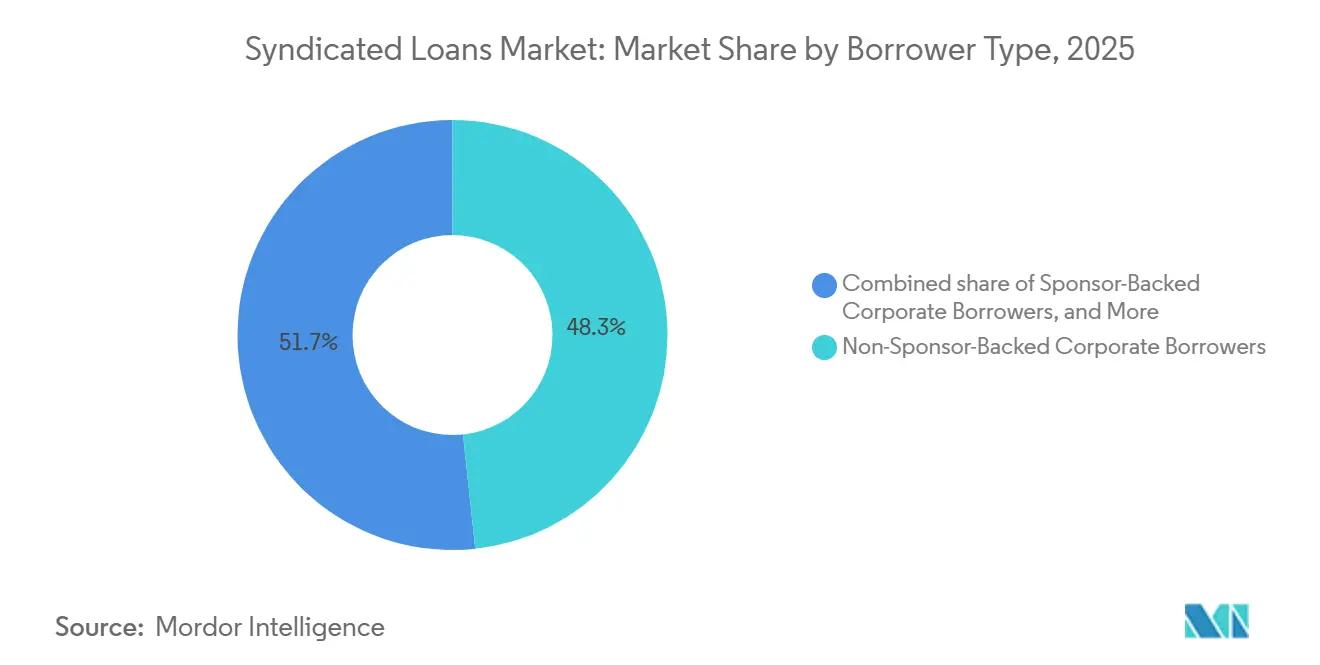
Non-Sponsor Borrowers Anchor the Market While Sponsor-Led Volume RebuildsNon-sponsor-backed corporate borrowers held 48.32% of the syndicated loans market share in 2025. Their position reflects demand from investment-grade companies using revolving facilities, term loans, and delayed-draw structures for working capital, capital expenditure, and acquisitions. Large multinational issuers often maintain long-standing lending groups with relationship banks, and facilities are frequently renewed instead of being competitively retendered. Sponsor-backed corporate borrowers are projected to grow at a 7.2% CAGR through 2031, the fastest rate among borrower types.
United States leveraged buyout-backed syndicated lending reached USD 59.4 billion in 2025, while private equity add-on financing reached USD 40.5 billion. Higher-quality non-sponsor borrowers have been priced at tighter spreads, which can limit arranger economics. Sponsor-backed transactions tend to require more complex structuring and can offer higher fees despite their higher credit risk. Issuers rated BB-minus or higher accounted for 40% of merger and acquisition-related volume year to date in 2026. Indian companies raised USD 32.5 billion through offshore syndicated loans in 2025, with financial institutions accounting for 42% of issuance volume, while sovereigns and government-related borrowers remain important in MEA and Asia-Pacific infrastructure financing. These trends continue to shape the syndicated loans market size as private equity activity, corporate refinancing, and infrastructure financing influence borrower demand.
By Loan Purpose:
Refinancing Dominates but Acquisition Finance Supports GrowthRefinancing captured 48.91% of the syndicated loans market share in 2025. The result reflects the refinancing cycle that has shaped loan issuance since 2023. In EMEA, refinancing accounted for 54% of total syndicated lending volume, reaching USD 816.4 billion in 2025, up from USD 598 billion in 2024. The United States new-issue leveraged loan volume reached USD 709 billion in 2025, with refinancing representing 44% of that volume. Acquisition-related financing is projected to grow at a 7.82% CAGR through 2031 and is expected to outpace other loan purposes.
Refinancing accounted for 37% of institutional loan volume in the first quarter of 2026, down from 49% in the first quarter of 2025. This change increases the need for acquisition financing to support arranger revenue and collateralized loan obligation supply. Global merger and acquisition values are projected to exceed USD 4 trillion in 2026, supporting acquisition-related lending. General corporate purpose, working capital, project finance, and infrastructure facilities provide a stable demand base, especially in MEA and APAC. Sustainability-linked loans are also used within refinancing and general corporate purpose financing under the Loan Market Association documentation principles, supporting growth in the syndicated loans market size.
By Industry Vertical:
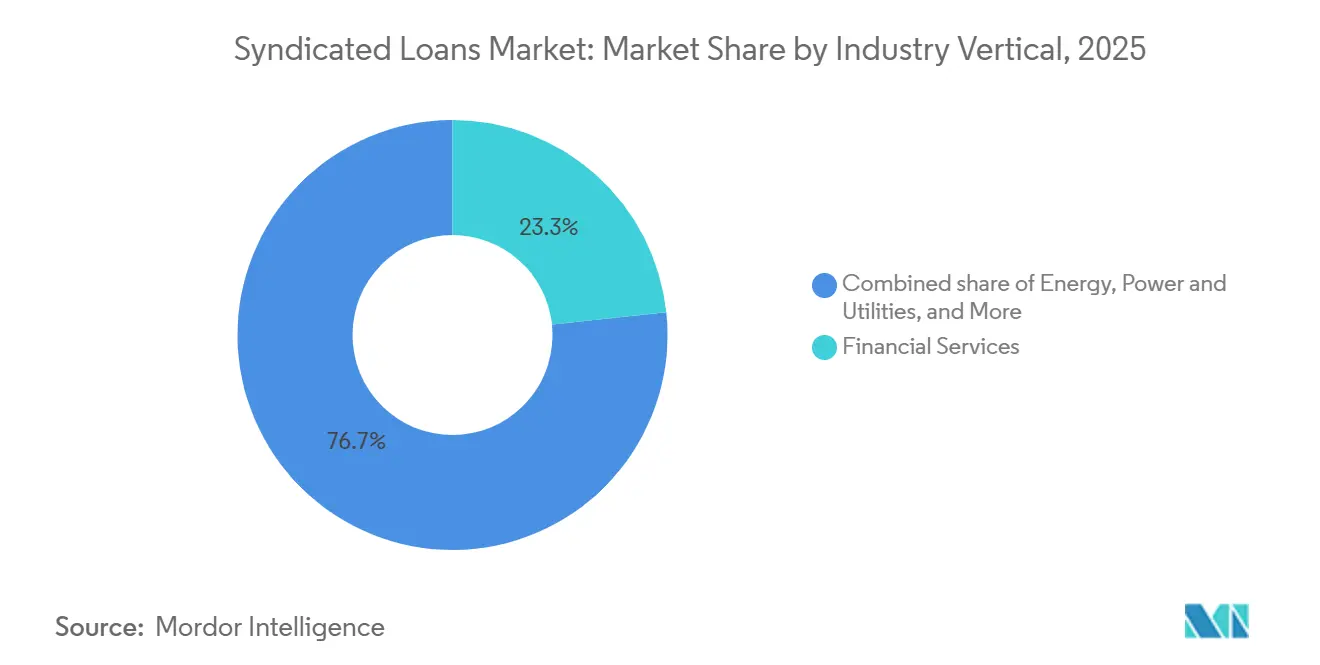
Financial Services Leads While TMT Benefits From Infrastructure InvestmentFinancial services accounted for 23.31% of the syndicated loans market share in 2025. Banks, especially Asian financial institutions, are active borrowers as well as arrangers in syndicated lending. Syndicated loans to Japanese companies reached JPY 35 trillion (USD 220 billion) in the fiscal year from April 2025 to March 2026, 18% higher than the preceding year. Indian banks are also increasing offshore syndicated borrowing in 2026. Energy, power, and utilities remain important borrowers because of investment in transition-related infrastructure.
Technology, media, and telecommunications are projected to grow at a 8.13% CAGR through 2031. AI infrastructure investment and 5G deployment are raising capital requirements for technology and telecom issuers. TMT issuers are estimated to account for 25% of EUR 485 billion (USD 524 billion) in European credit issuance during 2026, equal to EUR 121 billion (USD 131 billion). In August 2025, JPMorgan and MUFG led a USD 22 billion syndicated loan for Vantage Data Centers, demonstrating the financing scale associated with hyperscale data center development. Telecom borrowers are linking loan proceeds to licensed-band 5G deployment, while healthcare, industrials, consumer goods, and real estate provide diversified demand for the syndicated loans market size.
By Deal Size:
Large Cap Deals Lead While Upper Middle-Market Activity ExpandsLarge-cap deals captured 72.02% of the syndicated loans market share in 2025. This concentration reflects the financing needs of multinational companies and major private equity sponsors. The Bank of America and Citigroup bridge loan supporting the Paramount Skydance transaction began at USD 57.5 billion in March 2026 and was later reduced to USD 49 billion as the lender group expanded to 18 banks. SMBC Aviation Capital completed a USD 3.7 billion global syndicated facility in April 2026 with 40 participating financial institutions. Traditional and lower-middle-market facilities support smaller borrowers but face stronger competition from direct lenders.
Upper middle-market deals are projected to grow at a 6.92% CAGR through 2031. Banks are extending arranger capabilities to capture transactions that have historically been handled by direct lenders. Competition between broadly syndicated loans and direct lending is most intense for deals between USD 500 million and USD 1.5 billion. Above this range, broadly syndicated loans have stronger liquidity advantages, while direct lenders can offer faster execution and greater confidentiality below it. Delayed-draw term loans give sponsors committed capital for future acquisitions while allowing conservative initial loan sizing, supporting growth in the syndicated loans market size.
Geography Analysis
North America Syndicated Loans Market
North America held 59.55% of the syndicated loans market share total in 2025. The region has the deepest secondary trading market, the most developed collateralized loan obligation ecosystem, and the largest group of investment-grade and leveraged borrowers. United States leveraged loan volume reached USD 1 trillion in 2025, the second-highest annual level on record. Secondary loan trading reached USD 971 billion in 2025, and the trailing 12-month figure exceeded USD 1 trillion in the first quarter of 2026. Canada and Mexico remain relevant submarkets for infrastructure and energy-related financing, and the withdrawal of the United States leveraged lending guidelines in December 2025 is expected to support bank competition through 2027.
Europe Syndicated Loans Market
European leveraged loan issuance exceeded USD 442 billion in 2025, with leveraged buyout loan volume reaching USD 51.8 billion. Large corporate financings included the Zegona and Vodafone Spain refinancing and Enel’s sustainability-linked revolving credit facility. The European investor base for collateralized loan obligations has broadened as United States accounts seek relative value in the region. Competition among broadly syndicated loans, high-yield bonds, and private credit remains intense, while sustainable-finance taxonomy and Loan Market Association principles are standardizing documentation.
APAC and MEA Syndicated Loans Market
Middle East and Africa is projected to grow at 8.51% CAGR through 2031, the fastest rate among geographic segments. Japan recorded JPY 35 trillion (USD 220 billion), in syndicated loans to corporate borrowers in the fiscal year from April 2025 to March 2026. Japan’s domestic syndicated loan outstanding balance stood at JPY 122.5 trillion (USD 771.8 billion) in June 2026. India raised USD 32.5 billion through offshore syndications in 2025, while Asia-Pacific excluding Japan declined to USD 217.6 billion in the first half of 2026. Middle East lending rose 34% to USD 110.8 billion in 2025, while Africa Finance Corporation raised a USD 2 billion syndicated loan in June 2026, up from USD 1.6 billion. African banks are increasingly arranging infrastructure transactions, which broadens the region’s lending capabilities.
Competitive Landscape
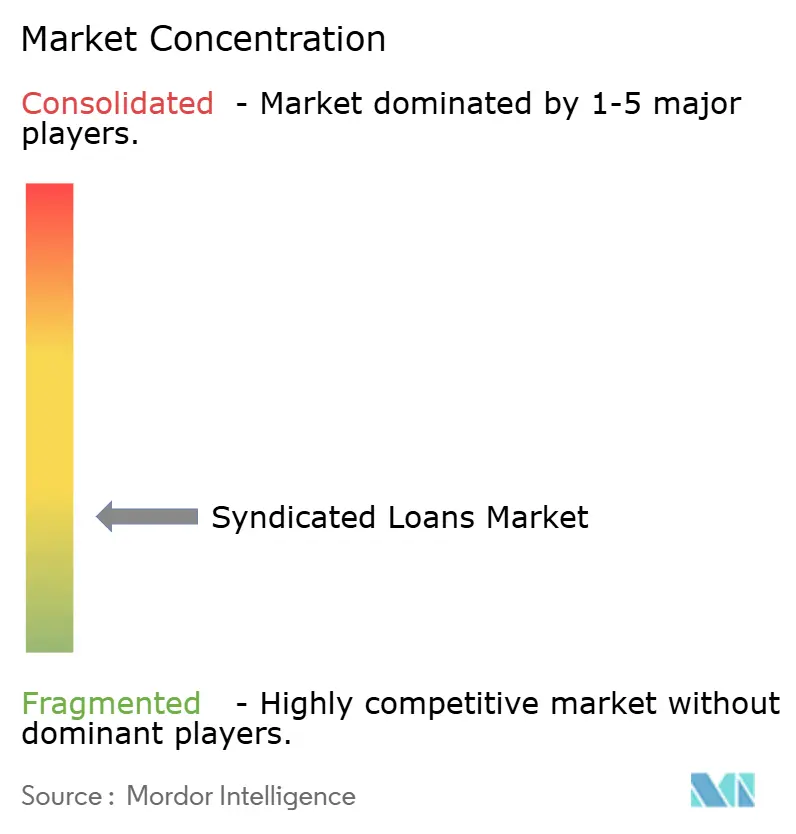
The syndicated loans market is fragmented. Bank of America Securities, JPMorgan, Citigroup, MUFG, BNP Paribas, and HSBC compete across the Americas, EMEA, and APAC. Bank of America Securities led global syndicated loan rankings in 2025 and in the first quarter of 2026. The leading banks combine balance-sheet capacity, broad lender relationships, and cross-asset financing capabilities. Competition for mandates depends on pricing, product range, execution certainty, and access to institutional loan investors. The syndicated loans market also requires strong operational capability because agents must manage large lender groups and detailed loan workflows.
Citigroup expanded its direct lending presence through a USD 25 billion platform partnership with Apollo Global Management. JPMorgan created its Strategic Financing Solutions group in 2025 to provide direct lending, syndicated loans, and high-yield financing options. MUFG participated in 146 data center project finance deals during 2025, strengthening its position in AI-related infrastructure financing. African infrastructure lending offers room for local banks to act as anchors alongside development finance institutions. Technology is becoming another source of differentiation as loan agents seek faster notice delivery, amendment processing, and data exchange. Barclays’ integration with Versana illustrates how banks are applying shared loan-data infrastructure to reduce manual work.
These operational changes can shorten execution steps and reduce administrative cost for agents and lenders. They may also help smaller institutions participate in syndicated transactions where manual processes previously created high operating burdens. AI-based lender-matching tools are emerging in the middle market to identify likely investor interest from historical transaction data. This may reduce the time needed for investor outreach without changing the need for credit review and loan documentation. The available information does not provide a combined top-player share, so a concentration score cannot be calculated under the stated share-based thresholds.
Syndicated Loans Industry Leaders
-
JPMorgan Chase and Co.
-
Bank of America Corporation
-
Citigroup Inc.
-
BNP Paribas
-
HSBC Holdings plc
- *Disclaimer: Major Players sorted in no particular order
Syndicated Loans Market Companies Covered in this Report
- JPMorgan Chase and Co.
- Bank of America Corporation
- Citigroup Inc.
- BNP Paribas
- HSBC Holdings plc
- Barclays PLC
- Wells Fargo and Company
- Deutsche Bank Aktiengesellschaft
- Crédit Agricole CIB
- MUFG Bank, Ltd.
- Mizuho Financial Group, Inc.
- Sumitomo Mitsui Banking Corporation
- UBS Group AG
- Royal Bank of Canada
- Goldman Sachs Group, Inc.
- Morgan Stanley
- Standard Chartered PLC
- ING Group
- Société Générale
- Banco Santander, S.A.
Recent Industry Developments in Syndicated Loans Market
- August 2026: Intesa Sanpaolo, through its IMI Corporate and Investment Banking Division, participated in a EUR 2.26 billion (USD 2.44 billion) ESG-linked Revolving Credit Facility for Terna, Italy's electricity transmission operator, alongside Cassa Depositi e Prestiti and a pool of leading Italian and international banks, replacing and extending Terna's 2024 facility. The transaction incorporates ESG target-linked incentive and penalty mechanisms.
- July 2026: Barclays' agented United States broadly syndicated loan deals went live on Versana's centralized data platform via API integration, following a follow-on investment in the platform. The arrangement delivers real-time golden-source lender-level data across Barclays' USD-denominated facilities.
- June 2026: Gunvor Singapore secured a USD 1.366 billion sustainability-linked syndicated revolving credit facility on June 12, 2026. Its key performance indicators are tied to Scope 1, 2, and 3 greenhouse gas emissions reductions and renewable-energy investment.
- June 2026: Africa Finance Corporation raised a record USD 2 billion syndicated loan, upsized from USD 1.6 billion, with participation from banks across Asia-Pacific at 35%, Europe at 35%, the Middle East at 25%, and Africa at 5%.
Global Syndicated Loans Market Report Scope
Segmentation Overview
| Non-Sponsor-Backed Corporate Borrowers |
| Sponsor-Backed Corporate Borrowers |
| Financial Institutions |
| Sovereigns, Public Sector and Government-Related Entities |
| Refinancing |
| Acquisition-Related Financing (Corporate Strategic M&A, Leveraged Buyouts / Sponsor Transactions) |
| General Corporate Purposes and Working Capital |
| Project Finance and Infrastructure |
| Other Purposes |
| Financial Services |
| Energy, Power and Utilities |
| Healthcare and Life Sciences |
| Technology, Media, and Telecommunications |
| Industrials and Manufacturing |
| Consumer Goods, Retail and Services |
| Real Estate and Infrastructure |
| Other Verticals |
| Large Cap Deals |
| Upper Middle Market |
| Traditional / Lower Middle Market |
| North America | United States |
| Canada | |
| Mexico | |
| South America | Brazil |
| Argentina | |
| Rest of South America | |
| Europe | United Kingdom |
| Germany | |
| France | |
| Italy | |
| Spain | |
| Rest of Europe | |
| Asia-Pacific | China |
| Japan | |
| India | |
| South Korea | |
| Australia | |
| Indonesia | |
| Thailand | |
| Malaysia | |
| Singapore | |
| Vietnam | |
| Rest of Asia-Pacific | |
| Middle East and Africa | Saudi Arabia |
| United Arab Emirates | |
| Turkey | |
| South Africa | |
| Egypt | |
| Rest of Middle East and Africa |
| By Borrower Type | Non-Sponsor-Backed Corporate Borrowers | |
| Sponsor-Backed Corporate Borrowers | ||
| Financial Institutions | ||
| Sovereigns, Public Sector and Government-Related Entities | ||
| By Loan Purpose | Refinancing | |
| Acquisition-Related Financing (Corporate Strategic M&A, Leveraged Buyouts / Sponsor Transactions) | ||
| General Corporate Purposes and Working Capital | ||
| Project Finance and Infrastructure | ||
| Other Purposes | ||
| By Industry Vertical | Financial Services | |
| Energy, Power and Utilities | ||
| Healthcare and Life Sciences | ||
| Technology, Media, and Telecommunications | ||
| Industrials and Manufacturing | ||
| Consumer Goods, Retail and Services | ||
| Real Estate and Infrastructure | ||
| Other Verticals | ||
| By Deal Size | Large Cap Deals | |
| Upper Middle Market | ||
| Traditional / Lower Middle Market | ||
| By Geography | North America | United States |
| Canada | ||
| Mexico | ||
| South America | Brazil | |
| Argentina | ||
| Rest of South America | ||
| Europe | United Kingdom | |
| Germany | ||
| France | ||
| Italy | ||
| Spain | ||
| Rest of Europe | ||
| Asia-Pacific | China | |
| Japan | ||
| India | ||
| South Korea | ||
| Australia | ||
| Indonesia | ||
| Thailand | ||
| Malaysia | ||
| Singapore | ||
| Vietnam | ||
| Rest of Asia-Pacific | ||
| Middle East and Africa | Saudi Arabia | |
| United Arab Emirates | ||
| Turkey | ||
| South Africa | ||
| Egypt | ||
| Rest of Middle East and Africa | ||
Key Questions Answered in the Report
What is driving syndicated loan activity through 2031?
Refinancing demand, merger and acquisition financing, infrastructure funding, and the need to share large bank exposures support activity through 2031.
Which borrower group held the largest share in 2025?
Non-Sponsor-Backed Corporate Borrowers held 48.3% in 2025, while Sponsor-Backed Corporate Borrowers are forecast to grow at 7.2% CAGR through 2031.
Why is refinancing important to syndicated lending?
Refinancing accounted for 48.9% by loan purpose in 2025, reflecting borrowers’ efforts to extend maturities and manage financing costs.
Which region is growing fastest?
Middle East and Africa is projected to grow at 8.5% CAGR through 2031, supported by infrastructure financing and development finance activity.
How does private credit affect bank-led syndications?
Private credit competes strongly in the middle market through faster execution, confidentiality, and flexible covenants, while syndicated loans retain scale and liquidity advantages.
Which sector is forecast to grow fastest?
Technology, Media and Telecommunications is projected to grow at 8.1% CAGR through 2031, supported by AI infrastructure and 5G investment.