
Supply Chain Control Tower Market Size and Share
Market Overview
| Study Period | 2020 - 2031 |
|---|---|
| Market Size (2026) | USD 11.57 Billion |
| Market Size (2031) | USD 25.76 Billion |
| Growth Rate (2026 - 2031) | 17.36 % |
| Fastest Growing Market | Asia-Pacific |
| Largest Market | North America |
| Market Concentration | Medium |
Major Players *Disclaimer: Major Players sorted in no particular order Image © Mordor Intelligence. Reuse requires attribution under CC BY 4.0. | |
Supply Chain Control Tower Market Analysis by Mordor Intelligence
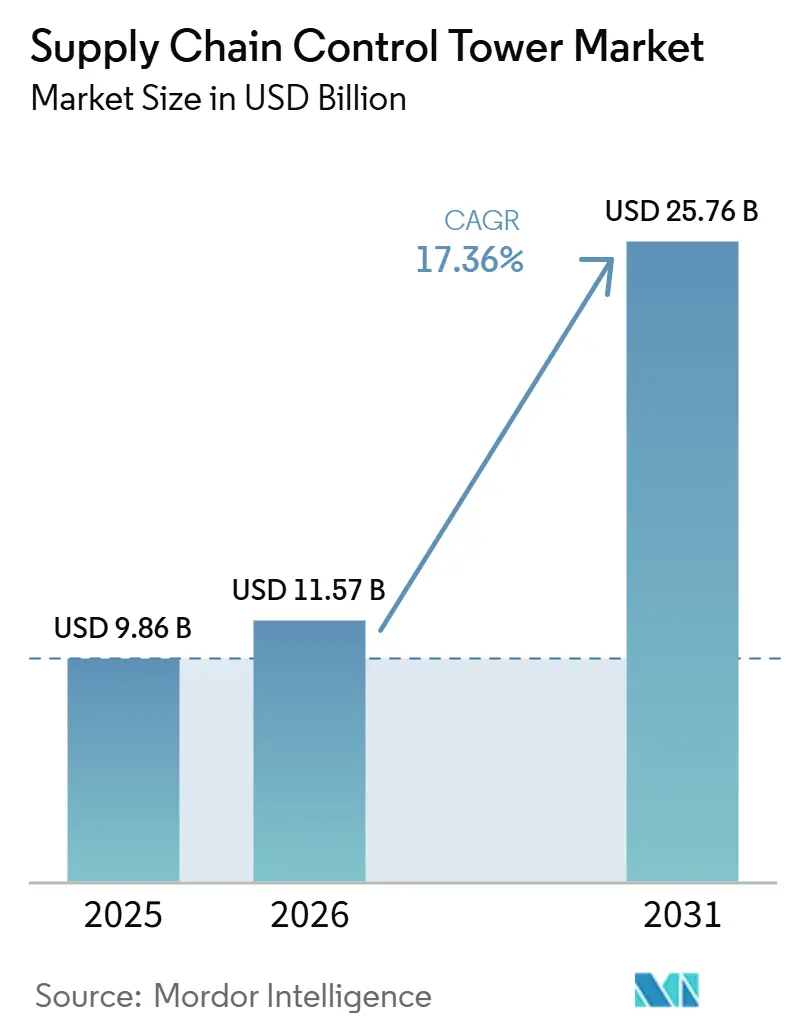
The supply chain control tower market size is projected to expand from USD 9.86 billion in 2025 to USD 25.76 billion by 2031, registering a CAGR of 17.36% between 2026 and 2031. The supply chain control tower market is growing as trade rerouting, tariff changes, and variable demand make slower planning cycles less useful. Companies need current information from carriers, suppliers, warehouses, and internal systems to respond before a disruption affects fulfillment. Machine learning, carrier signals, and shared data networks are moving control towers beyond simple tracking toward guided action. This change favors providers that can connect planning, procurement, logistics, and fulfillment without creating separate data environments. The supply chain control tower market also faces heightened expectations for secure data sharing, as a breach at one partner can affect many connected organizations.
Key Report Takeaways
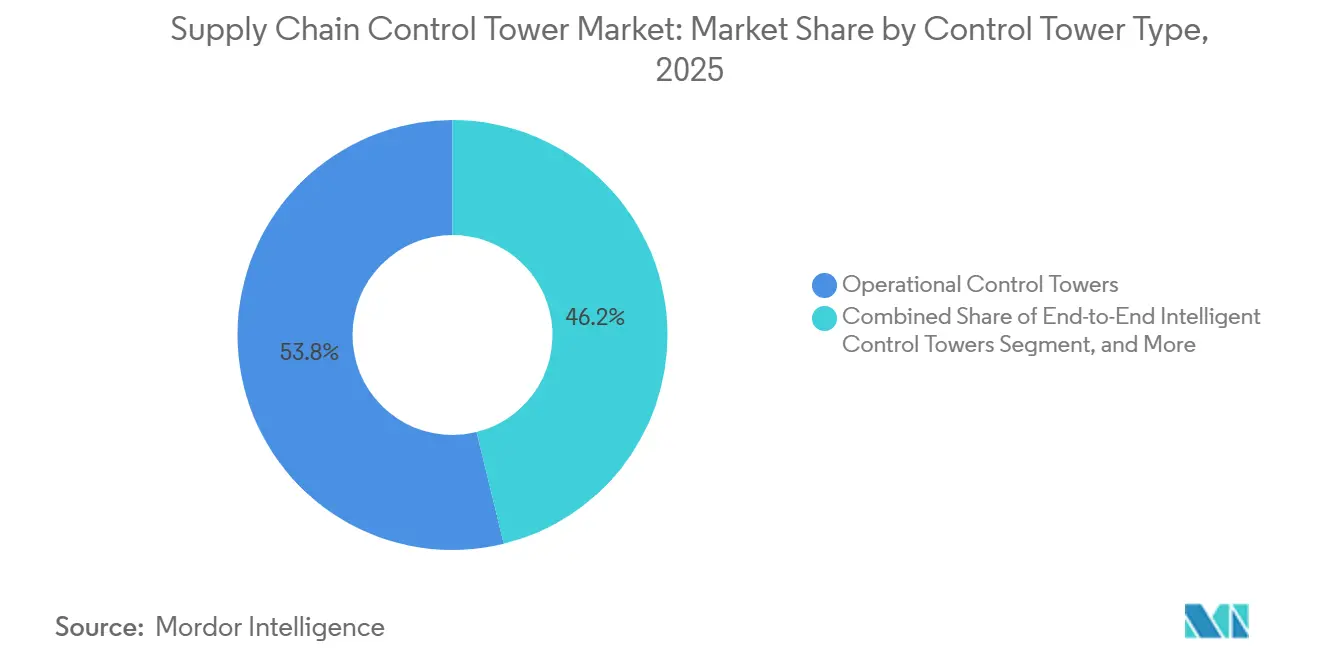
- By control tower type, Operational Control Towers held 53.84% of the supply chain control tower market share in 2025, while End-to-End Intelligent Control Towers are projected to expand at a 19.58% CAGR through 2031.
- By component, Software accounted for 62.13% of the supply chain control tower market size in 2025, while Services are expected to grow at a 18.51% CAGR through 2031.
- By deployment mode, Cloud held 62.37% of revenue in 2025, while Hybrid deployment is projected to grow at a 19.16% CAGR through 2031.
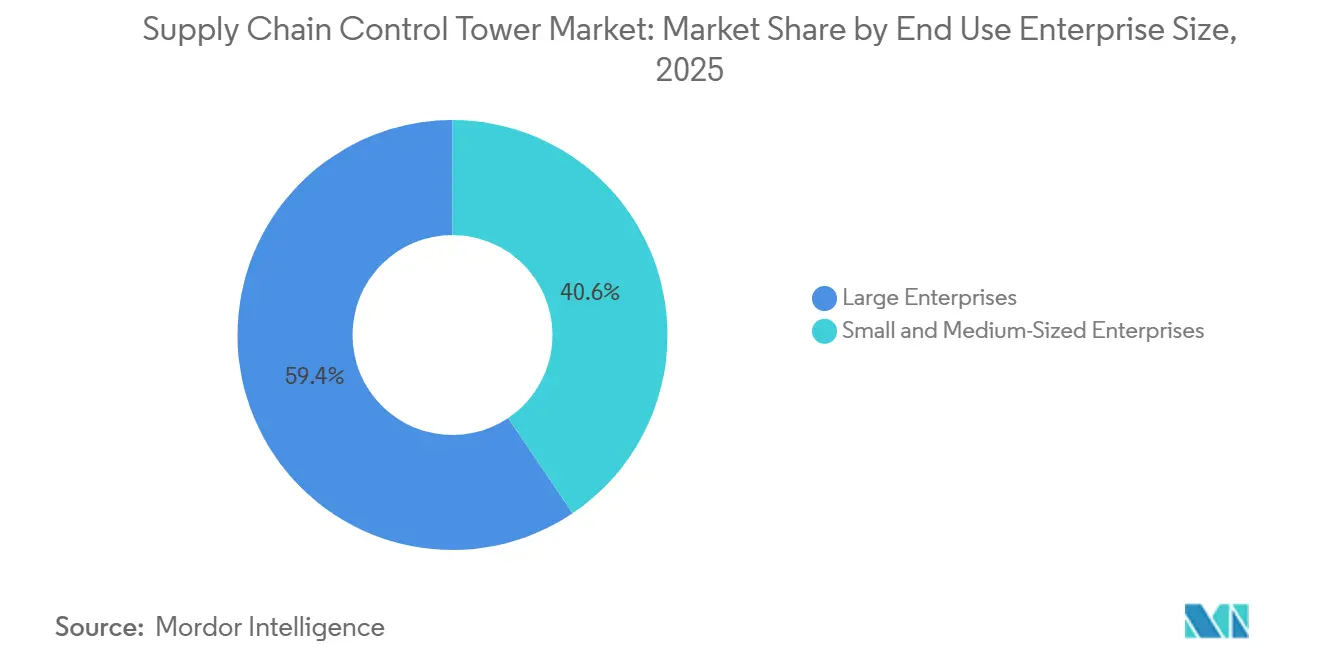
- By enterprise size, Large Enterprises represented 59.43% of revenue in 2025, while small and medium-sized enterprises are expected to expand at a 19.34% CAGR through 2031.
- By end-user industry, Retail and E-Commerce accounted for 25.76% of revenue in 2025, while Healthcare and Life Sciences are projected to grow at a 18.53% CAGR through 2031.
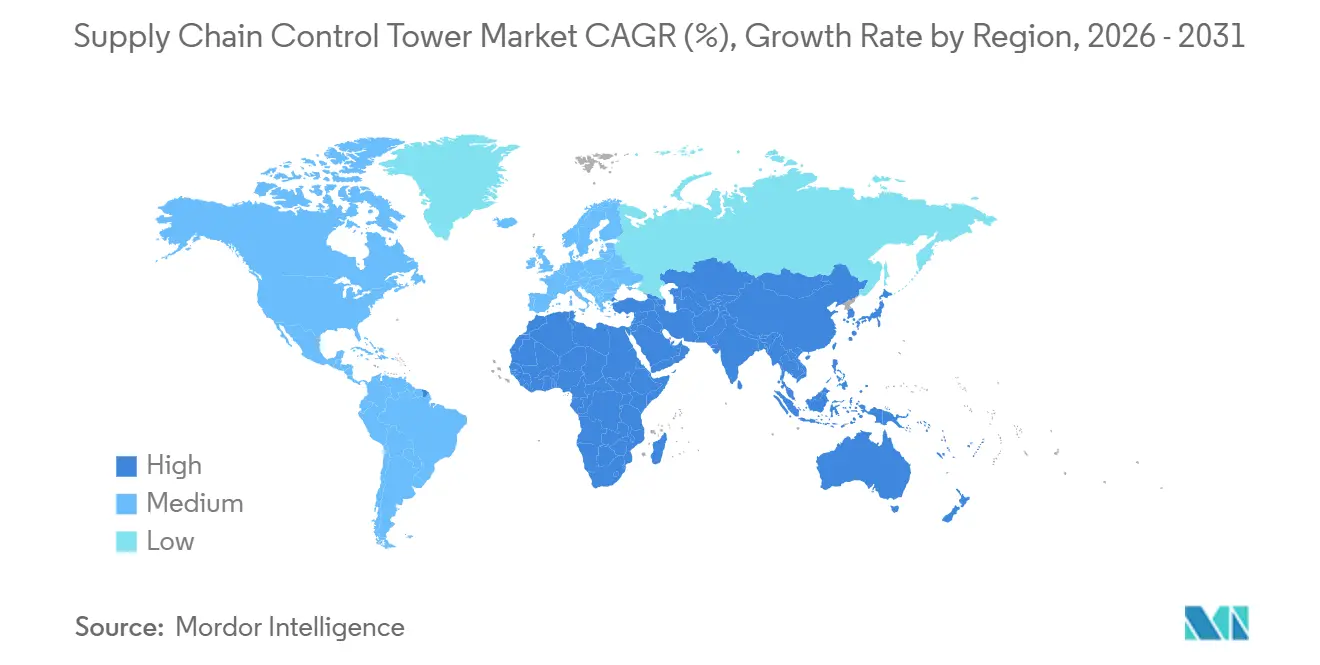
- By geography, North America accounted for 37.04% of revenue in 2025, while Asia-Pacific is expected to expand at a 19.36% CAGR through 2031.
Note: Market size and forecast figures in this report are generated using Mordor Intelligence’s proprietary estimation framework, updated with the latest available data and insights as of January 2026.
Global Supply Chain Control Tower Market Trends and Insights
Drivers Impact Analysis*
| Driver | (~) % Impact on CAGR Forecast | Geographic Relevance | Impact Timeline |
|---|---|---|---|
| Demand for Real-Time End-to-End Supply Chain Visibility | +4.2% | Global | Short term (≤ 2 years) |
| Intensifying Supply Chain Disruptions and Resilience Investment | +3.5% | Global, concentrated in North America and Europe | Short term (≤ 2 years) |
| AI-Enabled Predictive Exception Management | +2.8% | North America and Asia-Pacific, with spillover to Europe | Medium term (2-4 years) |
| Cloud Migration and Multi-Enterprise Collaboration | +2.2% | Global, accelerating in Asia-Pacific and South America | Medium term (2-4 years) |
| Product-Level Traceability and Carbon-Data Requirements | +1.5% | Europe and North America, with spillover to Asia-Pacific | Medium term (2-4 years) |
| Autonomous Execution Through Digital Twins and AI Agents | +1.1% | North America and Western Europe | Long term (≥ 4 years) |
| Source: Mordor Intelligence | |||
Demand for Real-Time End-to-End Supply Chain Visibility
The supply chain control tower market is benefiting from the shift from periodic reporting to continuous visibility across supply networks. Many companies still lack a complete view of risks across suppliers, transport partners, and distribution points. This gap makes it difficult to identify the source and likely effect of a delay before customer service is affected. Continuous inventory and shipment information can help companies reduce excess stock while lowering the risk of unavailable products. The result is a business case that includes both operational resilience and improved working capital use. Providers with ready connections to ERP, warehouse, transport, and supplier systems can shorten deployment work for buyers. Their advantage is stronger where customers cannot afford a long program of custom integration and process redesign.
Intensifying Supply Chain Disruptions and Resilience Investment
The supply chain control tower market is also supported by resilience programs that now focus on early action rather than recovery after a disruption. Resilinc issued 26,225 disruption alerts in 2025, up 38% from the prior year, across geopolitical enforcement, restructuring, labor issues, and climate-related events.[1]Resilinc, “2025 Annual Supply Chain Report,” Resilinc, resilinc.ai These events make static supplier lists and manual escalation practices less sufficient for complex networks. Companies that change sourcing locations or add suppliers need clearer visibility across several tiers of the network. This requirement increases the value of systems that can assess alternative supply routes and quickly flag affected materials. It also shifts purchase decisions toward platforms that combine supplier data, transportation events, and planning information. The supply chain control tower industry, therefore, has an opportunity to tie resilience spending to protecting service levels and operational continuity.
AI-Enabled Predictive Exception Management
AI is changing control tower work by reducing dependence on teams that monitor long lists of alerts. project44 reported that customer adoption of AI agents rose 235% year over year and that its platform initiated nearly 1 million automated carrier communications to address visibility gaps. The supply chain control tower market benefits when systems can identify problems, collect missing information, and propose next steps without waiting for an analyst. Human teams can then focus on decisions that require commercial judgment, policy approval, or cross-functional coordination. This model can reduce the work needed for routine shipment and inventory exceptions. It can also make a control tower more useful to companies that operate many lanes, suppliers, and customer commitments. Blue Yonder introduced 5 specialized AI agents in 2025 for inventory, shelf, logistics, warehouse, and network operations, showing how vendors are organizing these functions around specific operational tasks.
Cloud Migration and Multi-Enterprise Collaboration
Cloud delivery supports the supply chain control tower market by enabling trading partners to connect without relying on separate on-premises installations. A shared platform can bring together carrier events, warehouse activity, supplier records, manufacturing schedules, and customer demand. That combined view gives prediction tools more complete information when they assess an exception. The approach is particularly useful for companies that work with large partner networks across several countries. SAP launched Autonomous Supply Chain Management in May 2026 with 6 Joule Assistants and more than 60 purpose-built AI agents across planning, manufacturing, logistics, engineering, and warehouse operations. The launch shows that established enterprise software suppliers are embedding control tower capabilities within broader cloud environments. It may favor buyers seeking a common data foundation across supply chain applications while increasing competitive pressure on stand-alone providers.
Restraints Impact Analysis*
| Restraint | (~) % Impact on CAGR Forecast | Geographic Relevance | Impact Timeline |
|---|---|---|---|
| Legacy-System Integration and Data Harmonization Costs | -1.3% | Global, most acute in Europe and South America | Medium term (2-4 years) |
| Cybersecurity, Data Sovereignty, and Third-Party Data Exposure | -1.0% | Global, concentrated in Europe and the Asia-Pacific | Medium term (2-4 years) |
| Explainability and Accountability Gaps in AI Recommendations | -0.7% | Global, with the highest regulatory sensitivity in the EU | Long term (≥ 4 years) |
| Shortage of Supply Chain Data and Change-Management Specialists | -0.5% | Global, most acute in developing markets | Long term (≥ 4 years) |
| Source: Mordor Intelligence | |||
Legacy-System Integration and Data Harmonization Costs
Older ERP environments can delay supply chain control tower market adoption because system connectivity is only one part of the work. Supplier records, product definitions, transport lanes, and location data often use different formats across business units. Poor data quality can weaken the recommendations produced by prediction models. Companies may need months of data cleanup before they can rely on exception alerts or automated decisions. The challenge becomes larger when a program needs to connect many suppliers and carriers with different data practices. These relationships also require agreements on access rights, data ownership, and error responsibility. Companies that prepare their data structures before selecting a platform are better positioned to achieve meaningful outcomes sooner.
Cybersecurity, Data Sovereignty, and Third-Party Data Exposure
Control towers hold sensitive information because they combine operational data from an enterprise and its external partners. This exposure makes security review a central part of platform selection and partner onboarding. Data residency rules in China, India, Brazil, and Europe can require regional system designs that increase implementation complexity. Buyers must also consider how suppliers and logistics providers authenticate, share files, and manage access. Zero-trust access controls, data lineage, and clear contract terms can reduce some of these concerns. The supply chain control tower industry must demonstrate that greater visibility does not come at the expense of weaker governance.
*Our forecasts treat driver/restraint impacts as directional, not additive. The impact forecasts reflect baseline growth, mix effects, and variable interactions.
Segment Analysis
By Control Tower Type: Intelligent Orchestration Is Replacing Passive Monitoring
End-to-End Intelligent Control Towers are projected to grow at a 19.58% CAGR from 2026 to 2031, the highest rate among control tower types. Operational Control Towers held 53.84% of the supply chain control tower market share in 2025. They remain relevant for companies that are building basic visibility across transportation, inventory, and suppliers. These buyers can gain value from current operational information without implementing advanced automation at the start. Analytical and Decision Support Control Towers sit between monitoring and full orchestration. They support scenario analysis, root-cause review, and more informed planning choices. This category can provide a practical transition for companies that are strengthening their data foundation. Many vendors now include more predictive features in standard offerings. That change can reduce the appeal of separate capability layers for buyers who need a system that can expand over time.
Demand for intelligent platforms is supported by a single vendor relationship that extends from visibility to execution. Blue Yonder reported in May 2026 that it had shifted fully to its cognitive portfolio, added 30 customer logos, and appeared in 24 industry analyst reports during the first quarter of 2026.[2]Blue Yonder, “Blue Yonder Releases Q1 2025 Company Highlights and Launches Cognitive Solutions With AI Agents Heading Into Q2,” Business Wire, businesswire.com The announcement reflects demand for platforms that do not require customers to replace their operating model each time they add automation. Buyers can begin with monitoring and later apply recommendation or execution features to the same data. This path can lower the disruption associated with moving between separate products. It also gives providers opportunities to expand within current customer accounts. Vendors that only provide passive tracking face pressure to show how they will support guided actions and automated exception handling. The supply chain control tower market favors providers whose data coverage and product design can support that progression.



By Component: Software Leads While Services Support Continuing Model Work
Software accounted for 62.13% of the supply chain control tower market size in 2025. This position underscores the importance of subscription platforms that organize visibility, workflows, and analysis in a single environment. Software revenue is concentrated among providers with established enterprise platforms and broad partner connections. Services are projected to grow at a 18.51% CAGR through 2031. The faster pace reflects demand for integration work, model tuning, and support for process changes. These needs differ from traditional implementation work because AI systems must be tailored to customer data and operating practices. Service teams can help users interpret exceptions and set rules for automated actions. Their work can influence whether a platform delivers reliable results after the first deployment.
The supply chain control tower market is moving toward service relationships that continue after the initial software go-live. O9 Solutions introduced its APEX model in March 2026 and reported 130+ successful go-lives and 28 consecutive quarters of ARR growth. Its deployment at Hormel Foods covered more than 70 manufacturing sites and linked demand and supply planning across dry and refrigerated networks. Such programs show why customers may view ongoing model work as part of operating a control tower rather than as a one-time project. Providers can use these engagements to improve data quality and adjust decision rules. Buyers should assess how service needs affect cost, internal skills, and the ability to change vendors. They should also separate work that builds reusable internal capability from work that creates continuing dependence on a provider. Clear service scope can help retain the benefits of a tailored platform without obscuring total ownership costs.
By Deployment Mode: Cloud Supports Scale While Hybrid Addresses Data Controls
Cloud deployment held 62.37% of revenue in 2025, reflecting its ability to support flexible computing capacity and faster system updates. Cloud platforms also use application programming interfaces to connect suppliers, carriers, warehouses, and internal business systems. This capability is important for companies that manage large partner ecosystems. Hybrid deployment is projected to expand at a 19.16% CAGR through 2031. It combines cloud-based logistics data and analytics with on-premise storage for selected sensitive information. This approach can suit regulated industries and companies with government-connected operations. On-premise systems remain relevant in defense, critical infrastructure, and locations with strict local data rules. Their role may narrow as cloud providers expand compliance certifications and regional service availability.
Hybrid systems reflect selective use of cloud services rather than broad resistance to cloud adoption. Companies can route carrier events and logistics telemetry through cloud interfaces while keeping contractual, financial, and demand information in separate environments. They can also choose where model training data and model weights are kept. SAP stated that its 2026 autonomous supply chain capabilities would extend into SAP Cloud ERP Private environments. This design recognizes that data control requirements can persist even when companies want modern analytics. It also gives large software providers a way to serve customers with varied technology policies. Buyers need to test whether a hybrid design preserves current data flows and decision speed. The supply chain control tower market also requires buyers to account for the additional governance and integration work that can accompany a distributed architecture.
By End Use Enterprise Size: Subscription Delivery Broadens Access for Smaller Companies
Large Enterprises accounted for 59.43% of revenue in 2025 because they often have the resources to coordinate data across multiple functions and partner groups. Their systems commonly cover many sites, suppliers, shipping lanes, and customer channels. This scale creates enough operational complexity to support broad control tower programs. Small and medium-sized enterprises are projected to grow at a 19.34% CAGR through 2031. Cloud subscriptions and usage-based pricing can reduce the initial investment that formerly limited advanced visibility platforms to large multinational firms. Smaller companies can begin with a focused use case and add connections as operational needs increase. They may also use prebuilt templates rather than develop every integration from the start. These options make the supply chain control tower market more accessible to businesses with smaller technical teams.
Smaller firms still need a practical data and process foundation before they can use a control tower effectively. The BVL Logistics and Supply Chain Management Trends study found that more than 50% of German companies were implementing or planning AI integration in supply chain and logistics operations in 2025 and 2026. This includes companies in the German Mittelstand that are evaluating scalable digital tools. Providers that offer industry templates can reduce the integration burden for these customers. Examples include connectors for retailer data exchange or tools for food-grade cold-chain monitoring. Specialized products may be easier for a smaller organization to adopt than a broad enterprise suite. At the same time, buyers need to confirm that a focused solution can connect to future partners and systems. The supply chain control tower market can retain relevance for an SME when a platform supports step-by-step expansion into new markets or channels.
By End-User Industry: Retail Anchors Demand While Healthcare Grows Faster
Retail and E-Commerce held 25.76% of revenue in 2025, making it the largest end-user segment. Retailers need current inventory and shipment information across stores, distribution centers, online orders, and last-mile partners. Direct-to-consumer delivery expectations make it costly to detect a stock or transport issue late. Healthcare and Life Sciences are projected to grow at an 18.53% CAGR through 2031. Cold-chain control, batch traceability, and dependable delivery are central to its case for adoption. These requirements are especially important for temperature-sensitive pharmaceutical products and regulated distribution networks. The supply chain control tower market provides these users with a common view of product movement, inventory conditions, and potential delays. It can also help teams coordinate a response before a supply issue affects a patient-facing commitment.
Pharmaceutical Commerce described how AI-enabled control towers can identify potential active pharmaceutical ingredient shortages and project effects on batch production before deadlines are missed. Automotive, industrial manufacturing, electronics, and high-tech users often use operational towers for supplier sequencing and component inventory. Their need has increased as tariffs and sourcing changes alter established supplier arrangements. Third-party logistics and freight providers are adopting visibility tools because shippers increasingly expect current data in service proposals. Food and beverages and chemicals users prioritize traceability and compliance-oriented applications. Aerospace and defense organizations generally move more cautiously because of data sovereignty requirements. Consumer goods and pharmaceutical companies are also using control tower capabilities for cross-border trade compliance and product-level serialization. These different use cases allow vendors to compete through industry knowledge as well as the breadth of their technology.
Geography Analysis
North America held 37.04% of the supply chain control tower market share in 2025. The region benefits from early adoption of cloud-based supply chain tools and the presence of several AI-focused platform providers. United States-headquartered multinationals manage complex international supplier, manufacturing, and logistics networks. That scale creates many exceptions and data relationships that can justify investment in a broad control tower. Buyers in the region also have experience with digital supply chain programs that started during the 2020 to 2022 pandemic period. South America remains an emerging geography with growing interest from omnichannel retailers in Brazil and Colombia. These companies want better coordination across fragmented, multimodal transport networks. Data infrastructure limitations and integration costs can still delay mid-market users' ability to realize value.
Europe has a more regulation-driven demand pattern for the supply chain control tower market. The Corporate Sustainability Reporting Directive and the Corporate Sustainability Due Diligence Directive were amended in March 2026.[3]European Commission, “Directive (EU) 2022/2464 on Corporate Sustainability Reporting, as Amended,” EUR-Lex, eur-lex.europa.eu Their requirements strengthen the importance of supply-chain traceability and Scope 3 emissions information for affected companies. Control towers can help connect supplier data, shipment information, and product records needed for such reporting. Germany is a major source of regional demand because of its large industrial base. More than 50% of German logistics and manufacturing firms were actively scaling AI integration in supply chain operations during 2025 and 2026. Saudi Arabia and the United Arab Emirates are also investing in supply chain modernization around logistics hubs and multimodal trade flows.
Asia-Pacific is projected to grow at a 19.36% CAGR through 2031, the fastest regional rate. Manufacturing nearshoring, domestic platform development, and digital infrastructure investment in China, India, and Southeast Asia support this expansion. China has local technology companies that build proprietary supply chain orchestration layers, creating strong competition for international providers. India is attracting investment from multinationals developing supplier networks and from domestic manufacturers seeking stronger export capabilities. Nippon Express Holdings launched NX Lead Logistics Solutions with control tower functionality in 2025. Yamaha implemented a Domo-powered global logistics control tower system in January 2026. Africa is still at an early stage, where smartphone-based visibility tools and regional third-party logistics partnerships are building the data foundation for more extensive adoption.

Competitive Landscape
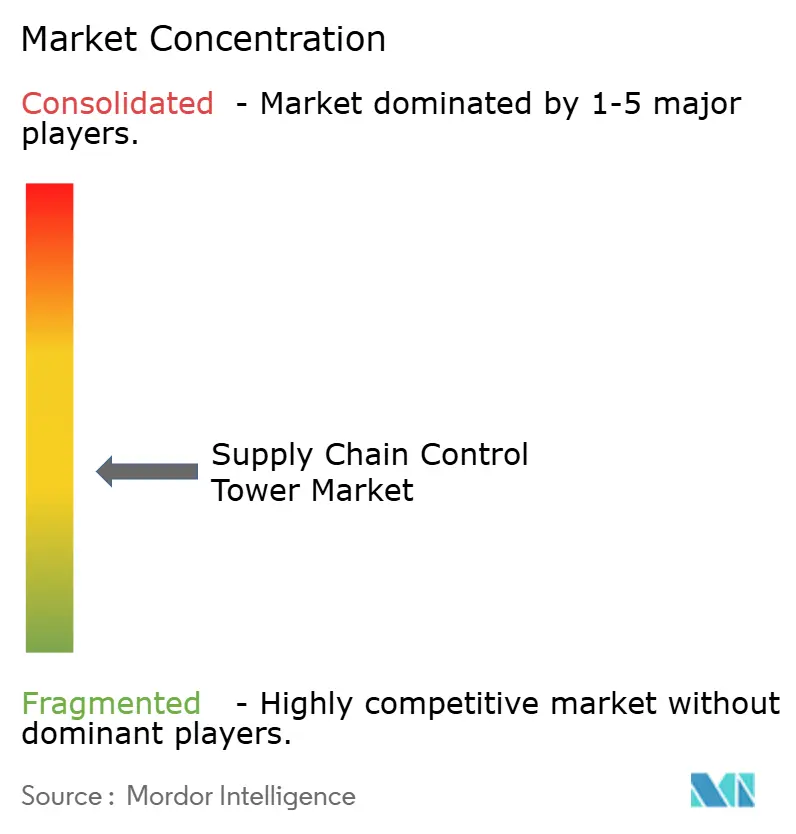
The supply chain control tower market is moderately fragmented. Full-suite supply chain software providers, including Shippeo SAS and Blue Yonder, compete through broad orchestration capabilities and enterprise-system integration. AI-native visibility specialists, including project44 and FourKites, compete through logistics data networks and agent-based products. Risk intelligence providers, including Resilinc, Everstream Analytics, Interos, and Altana Technologies, are expanding into adjacent control tower applications. Their products combine supplier risk information with wider network visibility. Competition is increasingly based on whether a platform can turn a detected issue into an approved operational response. This favors providers that combine data coverage, workflow control, and usable recommendations. Opportunities remain in clinical trial supply management, aerospace maintenance, SME deployments, and tools that link planning systems to execution systems.
Blue Yonder stated in May 2026 that it introduced new Cognitive Solutions for space planning, production planning, and scheduling, along with additional AI agents and user experience updates. The company’s strategy is to bring automated decisions into planning, warehouse, commerce, and supply chain workflows. project44 split its offer into an enterprise decision intelligence platform and LSP44, an AI-native infrastructure business for logistics providers. The move separates customer needs for enterprise decisions from the infrastructure requirements of large logistics service providers. FourKites enhanced Inventory Twin in May 2026 to identify inventory risk up to 14 days in advance and create stock-transfer recommendations that connect to booking workflows.[4]FourKites, “FourKites Bridges the Gap Between Supply Chain Planning and Execution With AI-Powered Inventory Twin Enhancements,” Business Wire, businesswire.com These examples show a competitive move away from static dashboards toward products that support a response inside the same workflow. Providers that can show practical results from these capabilities can differentiate in lengthy enterprise buying cycles.
Risk intelligence suppliers are also building links to the platforms used for planning and execution. Resilinc became a validated Databricks Built-on Partner for its Agent Factory in March 2026, supporting distributed processing of multi-tier supply chain information. Everstream Analytics was named a Leader in the 2026 Gartner Magic Quadrant for Supplier Risk Management Solutions. These moves point to a more mature risk intelligence segment that can support supply-chain planning and procurement workflows. Buyers may select broad suite vendors for a unified environment or choose specialists for deeper network intelligence. The choice will depend on existing systems, data access, security expectations, and the operating tasks that need automation. Partnerships may remain important where no one provider covers every source of logistics, supplier, and internal business data. The supply chain control tower market is therefore likely to retain both large platform vendors and specialized providers.
Supply Chain Control Tower Industry Leaders
Blue Yonder Group, Inc.
project44, Inc.
FourKites, Inc.
o9 Solutions, Inc.
Shippeo SAS
- *Disclaimer: Major Players sorted in no particular order

Recent Industry Developments
- May 2026: SAP SE launched Autonomous Supply Chain Management at SAP Sapphire, introducing 6 Joule Assistants and over 60 purpose-built AI agents embedded across planning, manufacturing, logistics, engineering, and warehouse operations, with phased general availability beginning immediately. The announcement represented a major supply chain AI product commitment by an ERP vendor and was designed to shift workflows toward continuously self-correcting operations.
- May 2026: Blue Yonder unveiled new Cognitive Solutions for Space Planning and Production Planning and Scheduling at ICON 2026, alongside new AI agents and user experience enhancements across its planning, warehouse, and commerce solutions. The releases were designed to automate complex supply chain decisions and accelerate disruption response for 3,000 or more global enterprise customers.
- May 2026: FourKites announced enhancements to Inventory Twin within the Intelligent Control Tower. The release introduced real-time inventory risk detection up to 14 days in advance, a live Inventory Risk Dashboard with heat maps by product category, and AI-generated mitigation recommendations integrated with Booking Connect for automated carrier selection and freight booking.
- April 2026: project44 launched a portfolio of AI agents at its Decision44 customer event. The portfolio covered carrier procurement, visibility, and exception recovery and was built on a decade of supply chain context and more than USD 1.5 billion invested in data infrastructure.


Global Supply Chain Control Tower Market Report Scope
The supply chain control tower market comprises software platforms and solutions that provide end-to-end visibility, real-time monitoring, analytics, and decision-support capabilities across supply chain operations. The scope of the report covers solutions that help organizations track shipments, inventory, orders, suppliers, logistics activities, and disruptions across global supply chains, enabling improved planning, execution, and risk management.
The Supply Chain Control Tower Market Report is Segmented by Control Tower Type (Operational Control Towers, Analytical and Decision Support Control Towers, and End-to-End Intelligent Control Towers), Component (Software, and Services), Deployment Mode (Cloud, On-Premise, and Hybrid), End Use Enterprise Size (Large Enterprises, and Small and Medium-Sized Enterprises), End-User Industry (Retail and E-Commerce, Automotive and Industrial Manufacturing, Electronics and High Technology, Healthcare and Life Sciences, Food and Beverages, Chemicals, Aerospace and Defense, Third-Party Logistics and Freight Services, Pharmaceuticals, and Consumer Goods), and Geography (North America, South America, Europe, Asia-Pacific, Middle East, and Africa). The Market Forecasts are Provided in Terms of Value (USD).
| Operational Control Towers |
| Analytical and Decision Support Control Towers |
| End-to-End Intelligent Control Towers |
| Software |
| Services |
| Cloud |
| On-Premise |
| Hybrid |
| Large Enterprises |
| Small and Medium-Sized Enterprises |
| Retail and E-Commerce |
| Automotive and Industrial Manufacturing |
| Electronics and High Technology |
| Healthcare and Life Sciences |
| Food and Beverages |
| Chemicals |
| Aerospace and Defense |
| Third-Party Logistics and Freight Services |
| Pharmaceuticals |
| Consumer Goods |
| North America | United States |
| Canada | |
| Mexico | |
| South America | Brazil |
| Argentina | |
| Colombia | |
| Rest of South America | |
| Europe | Germany |
| United Kingdom | |
| France | |
| Italy | |
| Spain | |
| Russia | |
| Nordics | |
| Rest of Europe | |
| Asia-Pacific | China |
| India | |
| Japan | |
| South Korea | |
| Australia | |
| Southeast Asia | |
| New Zealand | |
| Rest of Asia-Pacific | |
| Middle East | Saudi Arabia |
| United Arab Emirates | |
| Israel | |
| Turkey | |
| Rest of Middle East | |
| Africa | South Africa |
| Egypt | |
| Nigeria | |
| Kenya | |
| Rest of Africa |
| By Control Tower Type | Operational Control Towers | |
| Analytical and Decision Support Control Towers | ||
| End-to-End Intelligent Control Towers | ||
| By Component | Software | |
| Services | ||
| By Deployment Mode | Cloud | |
| On-Premise | ||
| Hybrid | ||
| By End Use Enterprise Size | Large Enterprises | |
| Small and Medium-Sized Enterprises | ||
| By End-User Industry | Retail and E-Commerce | |
| Automotive and Industrial Manufacturing | ||
| Electronics and High Technology | ||
| Healthcare and Life Sciences | ||
| Food and Beverages | ||
| Chemicals | ||
| Aerospace and Defense | ||
| Third-Party Logistics and Freight Services | ||
| Pharmaceuticals | ||
| Consumer Goods | ||
| By Geography | North America | United States |
| Canada | ||
| Mexico | ||
| South America | Brazil | |
| Argentina | ||
| Colombia | ||
| Rest of South America | ||
| Europe | Germany | |
| United Kingdom | ||
| France | ||
| Italy | ||
| Spain | ||
| Russia | ||
| Nordics | ||
| Rest of Europe | ||
| Asia-Pacific | China | |
| India | ||
| Japan | ||
| South Korea | ||
| Australia | ||
| Southeast Asia | ||
| New Zealand | ||
| Rest of Asia-Pacific | ||
| Middle East | Saudi Arabia | |
| United Arab Emirates | ||
| Israel | ||
| Turkey | ||
| Rest of Middle East | ||
| Africa | South Africa | |
| Egypt | ||
| Nigeria | ||
| Kenya | ||
| Rest of Africa | ||


Key Questions Answered in the Report
What is the projected value through 2031?
The supply chain control tower market is projected to increase from USD 9.86 billion in 2025 to USD 25.76 billion by 2031, at a 17.36% CAGR from 2026 to 2031.
Which control tower type is growing fastest?
End-to-End Intelligent Control Towers are projected to grow at a 19.58% CAGR through 2031 as buyers seek more automation across planning, procurement, and fulfillment.
Why are companies adopting supply chain control towers?
Companies use these platforms to improve visibility across suppliers, transport, inventory, and fulfillment, and to respond faster to operational exceptions.
Which deployment model is expanding most quickly?
Hybrid deployment is projected to grow at a 19.16% CAGR through 2031 because it combines cloud connectivity with controls for sensitive data.
Which end-user segment has the highest growth outlook?
Healthcare and Life Sciences is projected to expand at an 18.53% CAGR through 2031, supported by cold-chain, traceability, and regulated distribution requirements.
Which region is expected to grow fastest?
Asia-Pacific is projected to grow at a 19.36% CAGR through 2031, supported by manufacturing changes, digital infrastructure investment, and local platform development.
Page last updated on:





