
Streaming Rights Market Size and Share
Market Overview
| Study Period | 2020 - 2031 |
|---|---|
| Market Size (2026) | USD 42.24 Billion |
| Market Size (2031) | USD 60.01 Billion |
| Growth Rate (2026 - 2031) | 7.28 % |
| Fastest Growing Market | Asia-Pacific |
| Largest Market | North America |
| Market Concentration | Medium |
Major Players *Disclaimer: Major Players sorted in no particular order Image © Mordor Intelligence. Reuse requires attribution under CC BY 4.0. | |
Streaming Rights Market Analysis by Mordor Intelligence
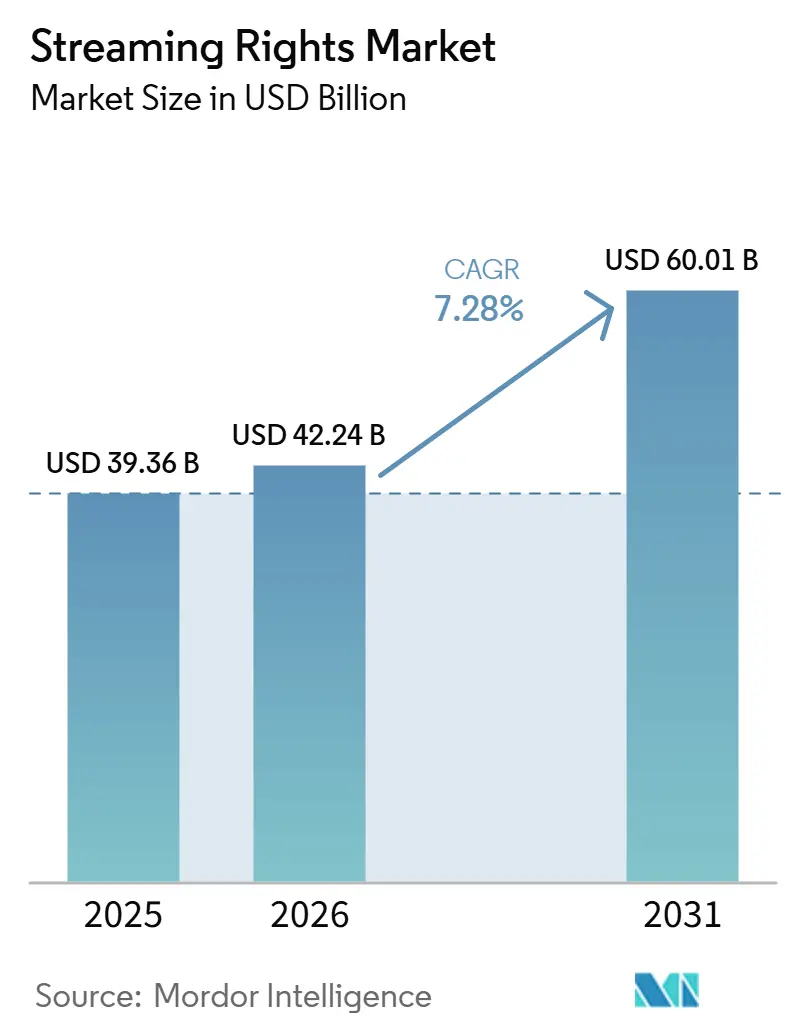
The Streaming rights market size was valued at USD 39.36 billion in 2025 and is estimated to grow from USD 42.24 billion in 2026 to reach USD 60.01 billion by 2031, at a CAGR of 7.28% during the forecast period 2026-2031. Live sports are moving from linear television into digital services, which is increasing demand for exclusive rights and supporting higher deal values. Ad-supported services are adding licensing windows for content that previously had fewer routes to viewers. Cloud-based rights operations in the Streaming rights market are helping rights owners handle agreements across territories, languages, services, and release dates. Platforms are responding with selective acquisitions, direct distribution deals, and technology investments that support multi-window licensing. Piracy, territorial restrictions, and higher licensing costs remain important limits because they can reduce the return from premium rights, increase legal work, and make content owners more selective about where they place valuable programs.
Key Report Takeaways
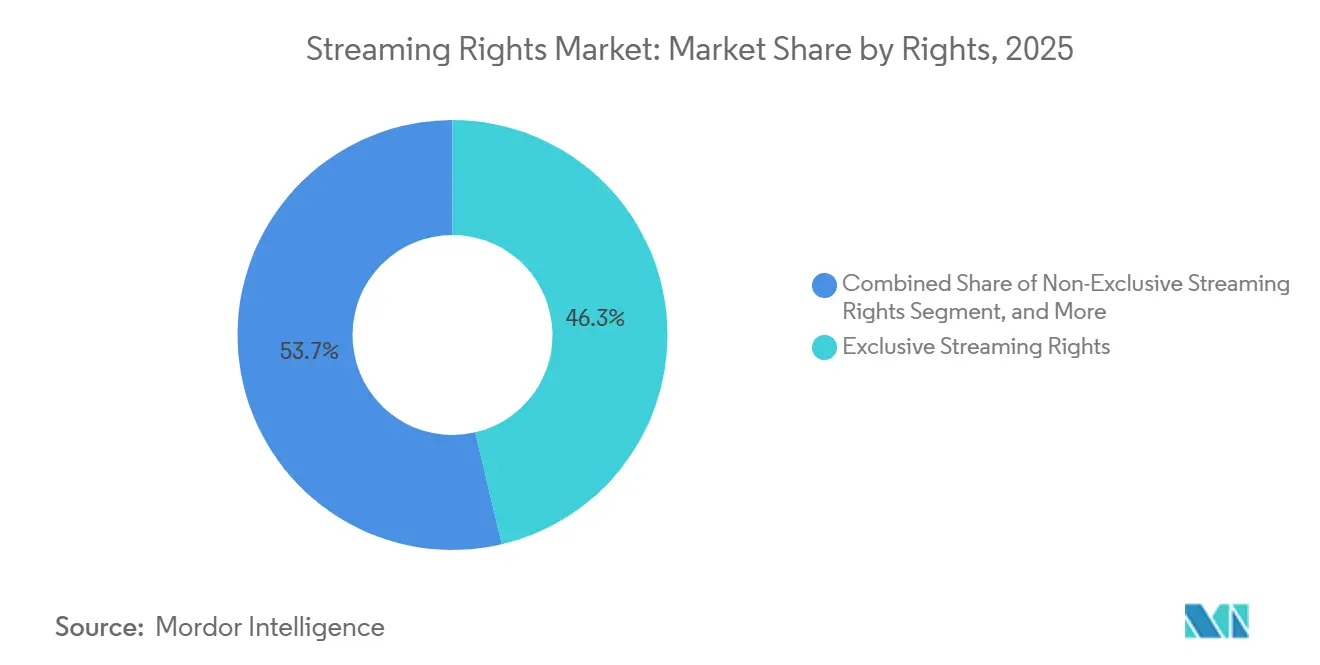
- By rights, exclusive streaming rights held 46.33% of the Streaming rights market share in 2025, while windowed streaming rights are projected to expand at a CAGR of 7.76% through 2031.
- By content type, TV shows and episodic content accounted for 39.82% of the Streaming rights market size in 2025, while documentaries are projected to expand at a CAGR of 8.11% through 2031.
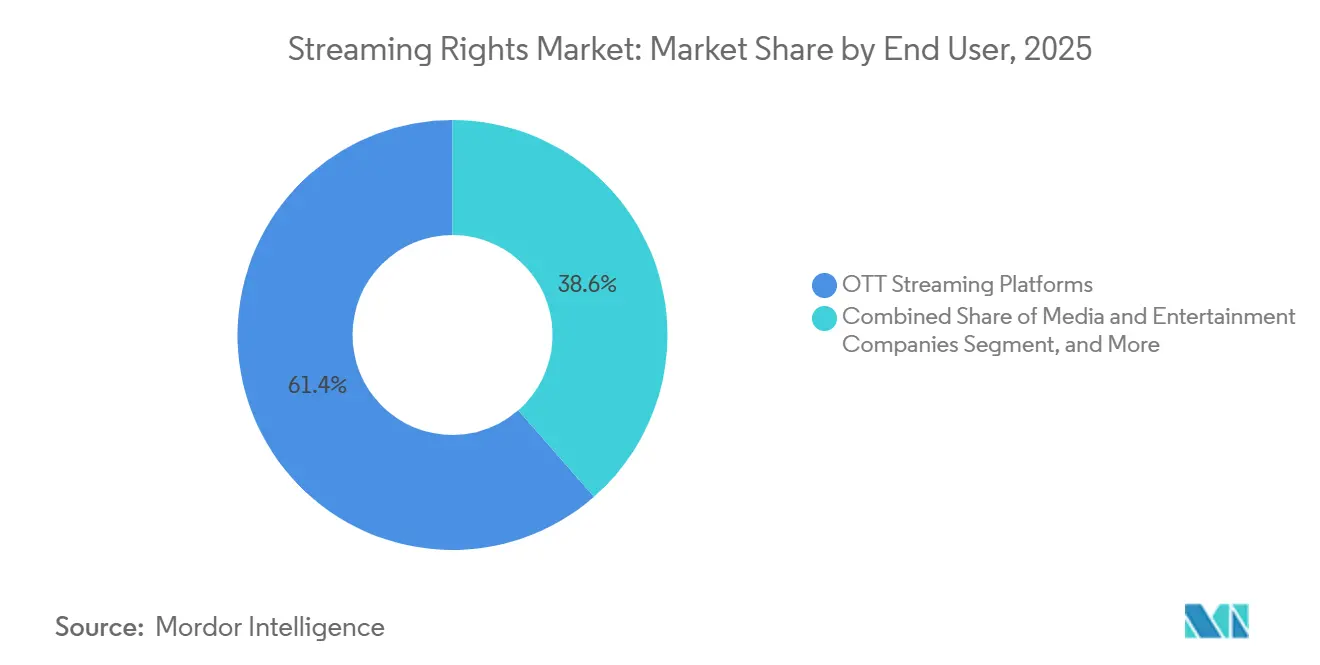
- By end user, OTT streaming platforms held 61.44% of the streaming rights market in 2025, while media and entertainment companies are projected to expand at a CAGR of 7.63% through 2031.
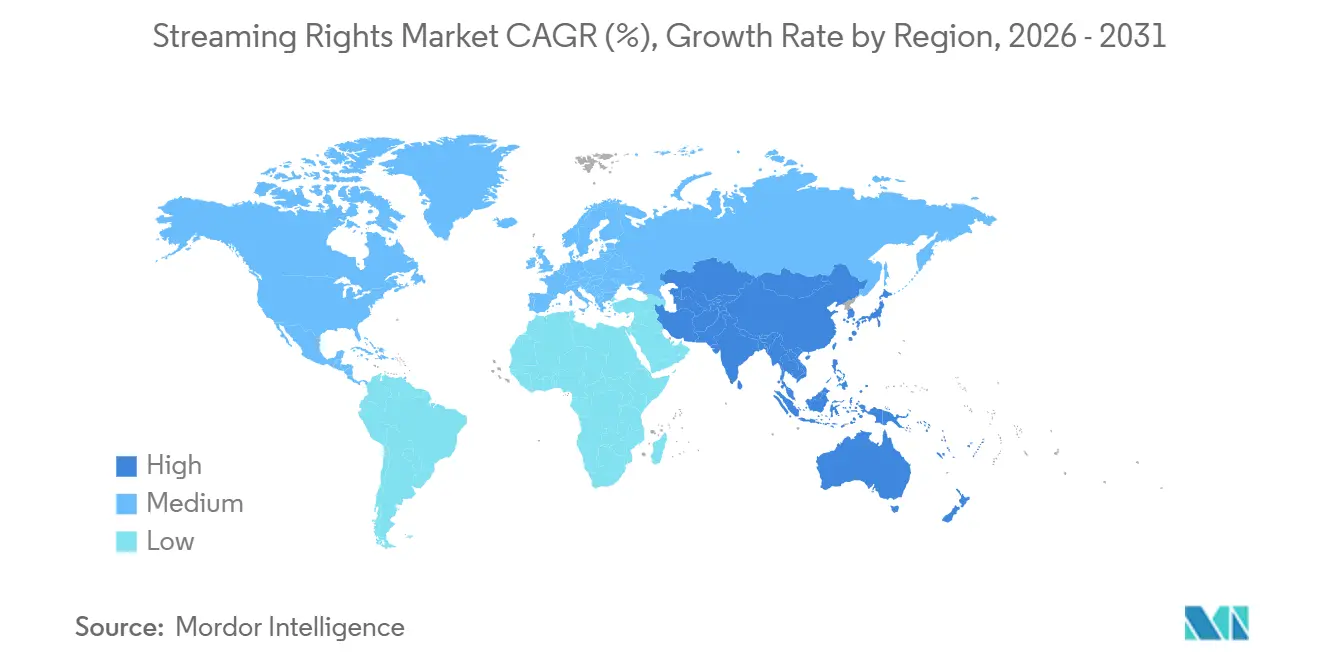
- By geography, North America held 42.62% of the streaming rights market in 2025, while Asia-Pacific is projected to expand at a CAGR of 8.24% through 2031.
Note: Market size and forecast figures in this report are generated using Mordor Intelligence’s proprietary estimation framework, updated with the latest available data and insights as of January 2026.
Global Streaming Rights Market Trends and Insights
Drivers Impact Analysis*
| Driver | (~) % Impact on CAGR Forecast | Geographic Relevance | Impact Timeline |
|---|---|---|---|
| Exclusive Sports and Live Event Rights Premiumization | +2.1% | Global, with highest intensity in North America and Western Europe | Short term (≤ 2 years) |
| FAST, AVOD, and Ad-Supported Window Expansion | +1.5% | Global, Asia-Pacific core, with spillover to Middle East and Africa | Medium term (2-4 years) |
| Cross-Border Localization and Multi-Territory Release Demand | +1.1% | Global, especially Asia-Pacific and South America | Medium term (2-4 years) |
| Cloud-Native Rights Operations and Automated Avails Management | +0.8% | North America and Europe, with early gains in South Korea and Australia | Medium term (2-4 years) |
| AI-Powered Metadata, Fingerprinting, and Rights Matching | +0.7% | Global | Long term (≥ 4 years) |
| Bundled Distribution Deals Across Telco and Streaming Ecosystems | +0.6% | Asia-Pacific core, with spillover to Middle East and Europe | Medium term (2-4 years) |
| Source: Mordor Intelligence | |||
Exclusive Sports and Live Event Rights Premiumization
Premium live programming is a major source of competition in the Streaming rights market because exclusive sports can attract subscribers and reduce cancellations. Amazon Prime Video’s 11-year NBA media rights agreement showed that global digital platforms are willing to take long-term positions in major sports properties.[1]Amazon MGM Studios, “Amazon Prime Video and the NBA Announce Landmark 11-Year Global Media Rights Agreement Beginning in 2025,” Amazon MGM Studios Press, press.amazonmgmstudios.com Paramount+ also secured exclusive U.S. UFC rights beginning in 2026, which brought another major live property under a streaming-led distribution model. Rights owners can license more than the primary live feed, including alternate camera angles, commentary tracks, language feeds, real-time statistics, and data overlays. These assets can widen the set of rights available for negotiation and require services to coordinate production, delivery, and clearance before an event begins. The result is greater emphasis on exclusivity, packaging, and reliable live delivery at scale.
FAST, AVOD, and Ad-Supported Window Expansion
Ad-supported viewing is changing the order in which content moves through licensing windows. A title can first appear through a subscription service, then reach ad-supported viewers, and later be licensed more broadly. This sequencing can let owners protect the value of an early release while building later revenue from advertising and wider distribution. Titan OS expanded its European FAST distribution through an agreement with NBCUniversal Global TV Distribution in July 2026. The agreement covered the United Kingdom, Germany, Spain, Italy, the Nordic markets, and the Netherlands. This arrangement brings studios, device platforms, and ad-supported channel operators into the same licensing chain while giving older catalog programs renewed commercial use.
Cross-Border Localization and Multi-Territory Release Demand
Global platforms are placing greater value on agreements that can support release in several territories at the same time. Amazon Prime Video’s 2025 deal with CJ ENM covered worldwide rights outside Korea and China for new and library programming. The service planned subtitles in 28 languages and dubbing in 11 languages, making localization part of the commercial scope of the agreement. This approach gives a platform more flexibility to use content across national services and can help an owner realize value beyond the home market. It also makes language rights, delivery requirements, local marketing, and approval processes more important during negotiations. The Streaming rights market benefits when content can travel across borders, but regulatory requirements, local quotas, and legacy rights obligations can limit simultaneous releases.
Cloud-Native Rights Operations and Automated Avails Management
Rights operations are shifting from manual contract reviews and spreadsheet-based availability tracking to more integrated digital workflows. Cloud-based systems can assess a title’s availability across territories, languages, platforms, and license windows in a unified process. Whip Media states that its Helix system can significantly reduce availability processing time. Vubiquity introduced rights-aware catalog intelligence to evaluate readiness by territory, platform, license window, and format. Faster validation can reduce distribution delays and help prevent titles from being made available outside approved windows. Improved availability data can also help content owners determine when to license titles and identify territories that require separate pricing strategies.
Restraints Impact Analysis*
| Restraint | (~) % Impact on CAGR Forecast | Geographic Relevance | Impact Timeline |
|---|---|---|---|
| Fragmented Rights Ownership and Territorial Clearing Complexity | -1.2% | Global, especially Asia-Pacific and South America | Long term (≥ 4 years) |
| Escalating Content Licensing Costs and Margin Compression | -0.9% | North America and Europe | Short term (≤ 2 years) |
| Persistent Piracy, Leakage, and Unauthorized Restreaming | -0.7% | Global, especially South Asia and South America | Medium term (2-4 years) |
| Data Privacy, Localization, and Compliance Burden | -0.4% | Europe and Asia-Pacific | Medium term (2-4 years) |
| Source: Mordor Intelligence | |||
Fragmented Rights Ownership and Territorial Clearing Complexity
Territory-by-territory licensing continues to complicate global streaming releases. A co-production may give a streamer rights outside one country while a domestic broadcaster retains the national rights. That structure can create gaps in availability and reduce the reach of a coordinated advertising or promotional campaign. Each carve-out can require separate legal review, title delivery, payment terms, compliance monitoring, and communication with a different distribution partner. These tasks add cost even when the underlying program is the same across markets. The Streaming rights market, therefore, depends on careful clearance work when owners seek wider releases.
Escalating Content Licensing Costs and Margin Compression
Higher sports rights prices and royalty obligations place pressure on platform budgets. Netflix reported substantial content amortization relative to its revenue in its annual filing. That cost base shows why services are reviewing the revenue potential of individual titles and rights packages more closely. Platforms are selecting fewer high-value exclusives and seeking content that can support retention, advertising, or multiple licensing windows. This can raise premiums for the strongest properties while weakening demand for mid-tier catalogs that lack a clear audience benefit. Cost pressure favors rights structures that produce more than one revenue window.
*Our forecasts treat driver/restraint impacts as directional, not additive. The impact forecasts reflect baseline growth, mix effects, and variable interactions.
Segment Analysis
By Rights: Exclusive Agreements Lead While Windowed Models Expand
Exclusive streaming rights held 46.33% of the Streaming rights market size in 2025, making them the leading rights category. Their position reflects the value of content that a service can offer as unavailable elsewhere, particularly where viewers want immediate access. Exclusivity can support subscriber acquisition and can justify licensing fees that a non-exclusive agreement may not support. Sports and live events are important because their time-sensitive audience can make a premium, exclusive arrangement more valuable. Amazon’s NBA agreement demonstrated the continued preference for high-value, exclusive live rights within the Streaming rights market.
Windowed streaming rights are projected to expand at a CAGR of 7.76% through 2031, the strongest rate in this rights group. These agreements let owners release a program through subscription, ad-supported, and broader licensing outlets in a planned sequence. A shorter window can help a title earn revenue from more than 1 route while preserving the value of its first release. Platforms can obtain appealing content without committing to a long exclusive term, which gives owners more room to manage later availability. Non-exclusive, sublicensing, clip, and format agreements remain useful parts of the Streaming rights market because they broaden the ways intellectual property can be licensed.



By Content Type: TV Shows Lead Revenue While Documentaries Grow Faster
TV shows and episodic content accounted for 39.82% of the Streaming rights market size in 2025, supported by production volume and repeat licensing opportunities. A new season can trigger a fresh rights negotiation, which can support the value of established serialized programs for owners and platforms. Movies and films continue to serve transactional and pay-per-view uses, although services are investing more in series that can sustain longer viewing activity. The 2025 CJ ENM agreement showed continued demand for Korean episodic content across international services, with language support planned for broad distribution. The Streaming rights market, therefore, includes both global programs and local stories whose reach depends on subtitles, dubbing, and effective promotion.
Documentaries are projected to expand at a CAGR of 8.11% through 2031, the fastest pace among content types. Their lower production costs can appeal to services that are managing content budgets, while durable subjects can provide a longer licensing life. Netflix confirmed in July 2026 that it used AI-enhanced production for 17 minutes of footage in The American Experiment. The company said the work was completed at twice the speed and half the cost of conventional methods, which may affect the supply of factual programming. Sports highlights, concerts, and short-form programs also gain additional outlets as FAST channels give the Streaming rights market more non-theatrical distribution options.
By End User: OTT Platforms Hold the Largest Position While Media Companies Expand
OTT streaming platforms held 61.44% of the Streaming rights market share in 2025 and remained the main rights buyers. Their scale gives them the ability to allocate license fees across broad subscriber bases and use longer content amortization periods. Netflix said it served close to 1 billion people globally in its first-quarter 2026 investor communications.[2]Netflix, “Netflix to Acquire Warner Bros. Following the Separation of Discovery Global,” Netflix, about.netflix.com Broadcasters still matter in territories where sports history, regulation, and local viewing patterns support linear distribution. The Streaming rights market increasingly requires owners to evaluate digital and broadcast partners together because many premium packages now serve both types of distributors.
Media and entertainment companies are projected to expand at a CAGR of 7.63% through 2031 as studios and content groups seek greater control of distribution. This shift supports acquisitions, partnerships, and direct service launches instead of licensing entire libraries to third parties. Telecom and pay-TV operators remain relevant because they can combine connectivity, billing, and entertainment access in a single customer offer. Jio launched an OTT Pass in 2026 that combined 15 streaming platforms with unlimited 5G connectivity for INR 200 per month, equivalent to USD 2.40. These bundles give the Streaming rights industry another mass-audience route, while making revenue allocation and customer data central issues for the participating services.
Geography Analysis
North America held 42.62% of the Streaming rights market in 2025 and remained the largest regional licensing base. The United States supports this position through frequent sports renewals, major platform-studio groups, and a large group of streaming subscribers. Amazon’s NBA agreement and Paramount+’s U.S. UFC agreement show the continued value of premium sports to regional buyers. Federal communications and copyright royalty frameworks affect the terms used for digital distribution. Active competition across sports, scripted programming, and live entertainment sustains rights bidding in the Streaming rights market.
Asia-Pacific is projected to expand at a CAGR of 8.24% through 2031, making it the fastest-growing geography. India is a major source of demand because local sports rights and telecom bundles can bring several services to a large consumer base. Jio’s 2026 OTT bundle showed how connectivity providers can combine mobile access and entertainment access in one offer. Japan relies more on premium pricing and sports-led differentiation within a mature subscriber base, while China, South Korea, Australia, and Southeast Asia have distinct viewing and regulatory conditions. Localization rules, language needs, and varied service models make multi-territory agreements valuable but operationally demanding for the Streaming rights market.
Europe is the second-largest region by revenue, and its audiovisual market reached EUR 142 billion, equivalent to USD 155 billion, in 2024.[3]European Audiovisual Observatory, “The Value of Europe’s Audiovisual Market Is Estimated at EUR 142 Billion,” European Audiovisual Observatory, obs.coe.int The European Commission’s review of the Audiovisual Media Services Directive can affect local content and investment duties for multi-territory services. South America has growing potential for streaming-first sports distribution, illustrated by CazéTV’s rights to all 104 matches of the 2026 FIFA World Cup and to the 2026 Winter Olympics and 2028 Summer Olympics. The Middle East is supported by sports and entertainment investment, while Africa is developing from a lower base where FAST services can offer a more accessible entry point.

Competitive Landscape
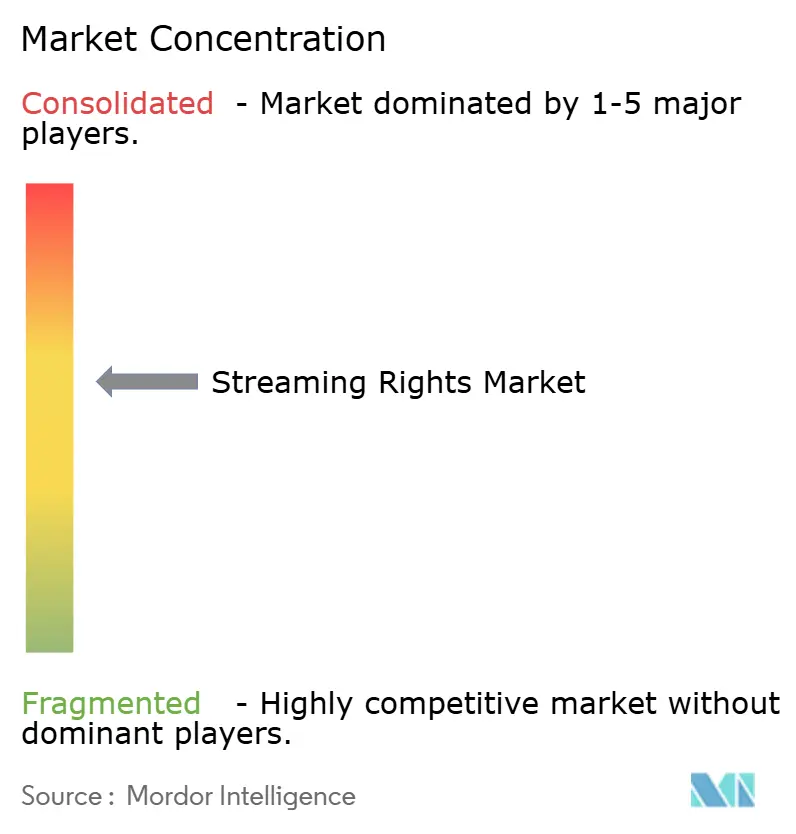
The Streaming rights market remained moderately concentrated in 2026. The market has 2 connected competitive groups: rights buyers and rights operations technology providers. Rights buyers include global platforms, broadcasters, studios, telecom groups, and specialist sports services, each with different distribution strengths. Netflix, Amazon Prime Video, Disney+, Apple, and DAZN compete for premium programs that can differentiate their services and support retention. Apple’s five-year Formula 1 agreement, reported at USD 750 million, indicated a greater focus on premium live sports. Paramount+’s UFC arrangement similarly showed how a major exclusive property can shape a service’s position within the Streaming rights market.
DAZN agreed to merge ViewLift into its business in April 2026 in a transaction valued at USD 100 million. The transaction gave DAZN technology and relationships used in local U.S. sports distribution, extending its ability to deliver as well as acquire content. In May 2026, DAZN also secured Canadian Football League domestic and global media rights beginning with the 2027 season. These actions show that specialist services are building distribution capability alongside their rights portfolios. Viaplay’s sale of its Dutch operations to Videoland showed the pressure on regional services that compete against better-capitalized global buyers in the Streaming rights market.
Technology providers compete to manage rights, contracts, royalties, and availability data for content owners and distributors. Rightsline received a USD 500 million strategic growth investment in May 2026 for AI product development and international expansion. HG Whip Media, FADEL, Vistex, and Rightsline are pursuing a central role in rights and royalty operations. Vubiquity’s 2025 update showed why checking availability by territory, platform, window, and format has become important as licensing arrangements diversify.
Streaming Rights Industry Leaders
Netflix, Inc.
The Walt Disney Company
Warner Bros. Discovery, Inc.
Amazon.com, Inc.
Apple Inc.
- *Disclaimer: Major Players sorted in no particular order

Recent Industry Developments
- July 2026: Netflix confirmed the use of AI-enhanced production for its documentary The American Experiment, which included 17 minutes of AI-generated footage produced at twice the speed and half the cost of conventional production methods. The disclosure signals a different production economics framework for documentary content that could affect how documentary rights are licensed and valued.
- July 2026: Titan OS announced a distribution agreement with NBCUniversal Global TV Distribution on July 14, 2026, bringing a portfolio of FAST channels to European smart TV devices across the United Kingdom, Germany, Spain, Italy, the Nordic markets, and the Netherlands. The deal extends NBCUniversal's free ad-supported streaming footprint into markets where its direct streaming presence is limited.
- June 2026: Cineflix Rights expanded its Property Brothers FAST channel to the U.S. market on June 23, 2026, securing distribution on Prime Video, Roku Channel, VIZIO WatchFree+, Pluto TV, Sling Freestream, and 5 additional platforms. A Spanish-language version, Hermanos a la Obra, was simultaneously launched on Pluto TV across South America.
- June 2026: stc group extended its partnership with Netflix, enabling Baity fiber customers in Saudi Arabia to access Netflix as part of a bundled streaming portfolio on stc tv. The expanded collaboration is structured as a multi-service bundle at a discounted aggregate price.


Global Streaming Rights Market Report Scope
Streaming Rights Market refers to the ecosystem of legal permissions and licensing deals that allow platforms to distribute and stream audio‑visual content over the internet, including films, series, music, and live events. These rights define how, where, and for how long content can be made available, often segmented by region, language, platform type, and release window.
The Streaming Rights Market Report is Segmented by Rights (Exclusive Streaming Rights, Non-Exclusive Streaming Rights, and Windowed Streaming Rights), Content Type (Movies and Films, TV Shows and Episodic Content, and Documentaries), End User (OTT Platforms, Broadcasters, Telecom and Pay-TV Operators, and Media and Entertainment Companies), and Geography (North America, South America, Europe, Asia-Pacific, Middle East, Africa). The Market Forecasts are Provided in Terms of Value (USD).
| Exclusive Streaming Rights |
| Non-Exclusive Streaming Rights |
| Windowed Streaming Rights |
| Other Rights |
| Movies and Films |
| TV Shows and Episodic Content |
| Documentaries |
| Other Content Types |
| OTT Streaming Platforms |
| Broadcasters |
| Telecom and Pay-TV Operators |
| Media and Entertainment Companies |
| Other End Users |
| North America | United States |
| Canada | |
| Mexico | |
| South America | Brazil |
| Argentina | |
| Chile | |
| Rest of South America | |
| Europe | Germany |
| United Kingdom | |
| France | |
| Italy | |
| Spain | |
| Rest of Europe | |
| Asia-Pacific | China |
| Japan | |
| India | |
| South Korea | |
| Australia | |
| Rest of Asia-Pacific | |
| Middle East | Saudi Arabia |
| United Arab Emirates | |
| Qatar | |
| Rest of Middle East | |
| Africa | South Africa |
| Egypt | |
| Nigeria | |
| Rest of Africa |
| By Rights | Exclusive Streaming Rights | |
| Non-Exclusive Streaming Rights | ||
| Windowed Streaming Rights | ||
| Other Rights | ||
| By Content Type | Movies and Films | |
| TV Shows and Episodic Content | ||
| Documentaries | ||
| Other Content Types | ||
| By End User | OTT Streaming Platforms | |
| Broadcasters | ||
| Telecom and Pay-TV Operators | ||
| Media and Entertainment Companies | ||
| Other End Users | ||
| By Geography | North America | United States |
| Canada | ||
| Mexico | ||
| South America | Brazil | |
| Argentina | ||
| Chile | ||
| Rest of South America | ||
| Europe | Germany | |
| United Kingdom | ||
| France | ||
| Italy | ||
| Spain | ||
| Rest of Europe | ||
| Asia-Pacific | China | |
| Japan | ||
| India | ||
| South Korea | ||
| Australia | ||
| Rest of Asia-Pacific | ||
| Middle East | Saudi Arabia | |
| United Arab Emirates | ||
| Qatar | ||
| Rest of Middle East | ||
| Africa | South Africa | |
| Egypt | ||
| Nigeria | ||
| Rest of Africa | ||


Key Questions Answered in the Report
What is the forecast value for streaming rights?
The streaming rights market is estimated at USD 42.24 billion in 2026 and is forecast to reach USD 60.01 billion by 2031 at a CAGR of 7.28%. The outlook reflects demand for exclusive live programming and more licensing windows.
Which rights category holds the largest share?
Exclusive streaming rights held 46.33% of revenue in 2025 because platforms use distinct programming to differentiate their content offerings. Windowed rights are expected to grow faster through 2031.
What content type is growing fastest?
Documentaries are projected to expand at a CAGR of 8.11% through 2031, supported by lower production costs and a longer licensing life. FAST services can create further distribution outlets for factual programs.
Why are sports rights important to streaming services?
Sports provide live, exclusive programming that can attract subscribers and reduce cancellations, as shown by major NBA and UFC rights agreements. They can also support several related rights packages beyond the main event feed.
Which region is growing fastest?
Asia-Pacific is projected to expand at a CAGR of 8.24% through 2031, supported by India, telecom bundles, local sports, and varied viewing models. Localization and national regulations shape each services approach.
How are rights management platforms changing licensing?
Cloud-based systems can track availability by territory, platform, language, and release window. This can reduce manual validation, prevent release errors, and improve the execution of more complex licensing arrangements.
Page last updated on:





