
Streaming Revenue Management Market Size and Share
Market Overview
| Study Period | 2020 - 2031 |
|---|---|
| Market Size (2026) | USD 1.15 Billion |
| Market Size (2031) | USD 1.99 Billion |
| Growth Rate (2026 - 2031) | 11.59 % |
| Fastest Growing Market | Asia-Pacific |
| Largest Market | North America |
| Market Concentration | Medium |
Major Players *Disclaimer: Major Players sorted in no particular order Image © Mordor Intelligence. Reuse requires attribution under CC BY 4.0. | |
Streaming Revenue Management Market Analysis by Mordor Intelligence
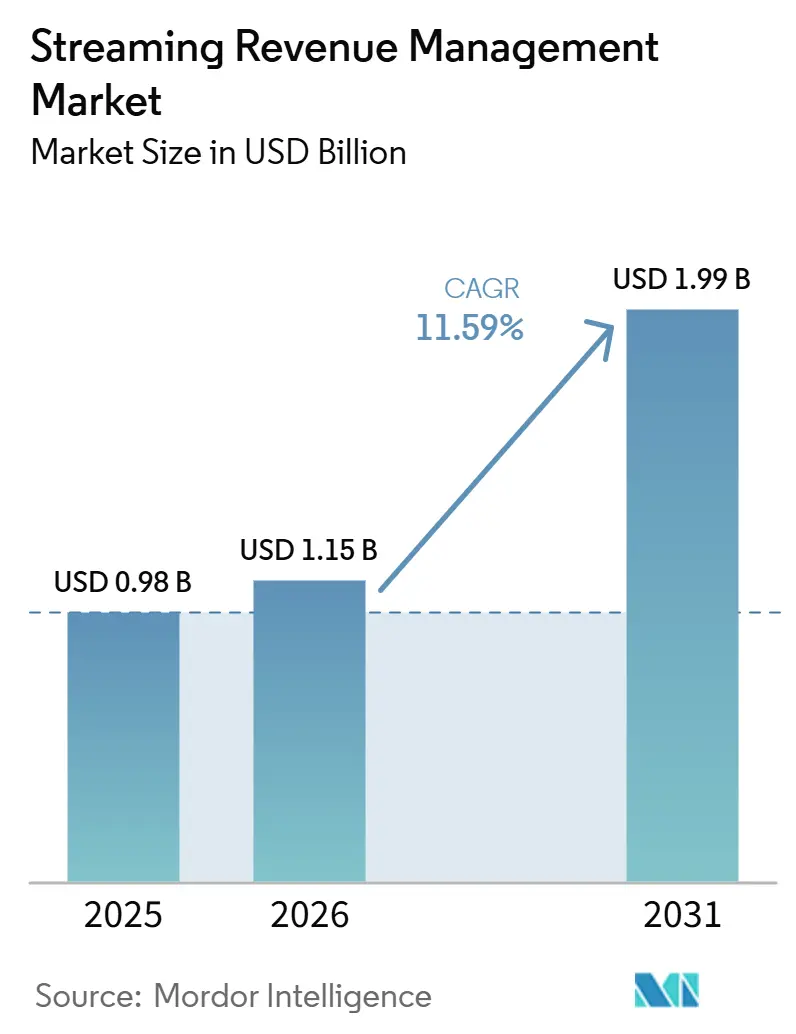
The Streaming revenue management market size was valued at USD 0.98 billion in 2025 and is estimated to grow from USD 1.15 billion in 2026 to reach USD 1.99 billion by 2031, at a CAGR of 11.59% during the forecast period 2026-2031. Growth reflects a shift from single subscription models to combinations of subscriptions, advertising, transactions, and partner distribution. Broadcasters, OTT platforms, and digital service providers must record and reconcile different revenue events across these channels, including recurring subscriber charges, advertising delivery, refunds, credits, transactional purchases, and payments routed through distribution partners. This raises the value of billing, analytics, and settlement systems that can work in real time. Providers are also adding payment recovery, churn management, and pricing tools to their platforms. Regulatory requirements for subscription cancellation, tax reporting, and electronic invoicing are increasing the need for reliable compliance functions within the Streaming revenue management market.
Key Report Takeaways
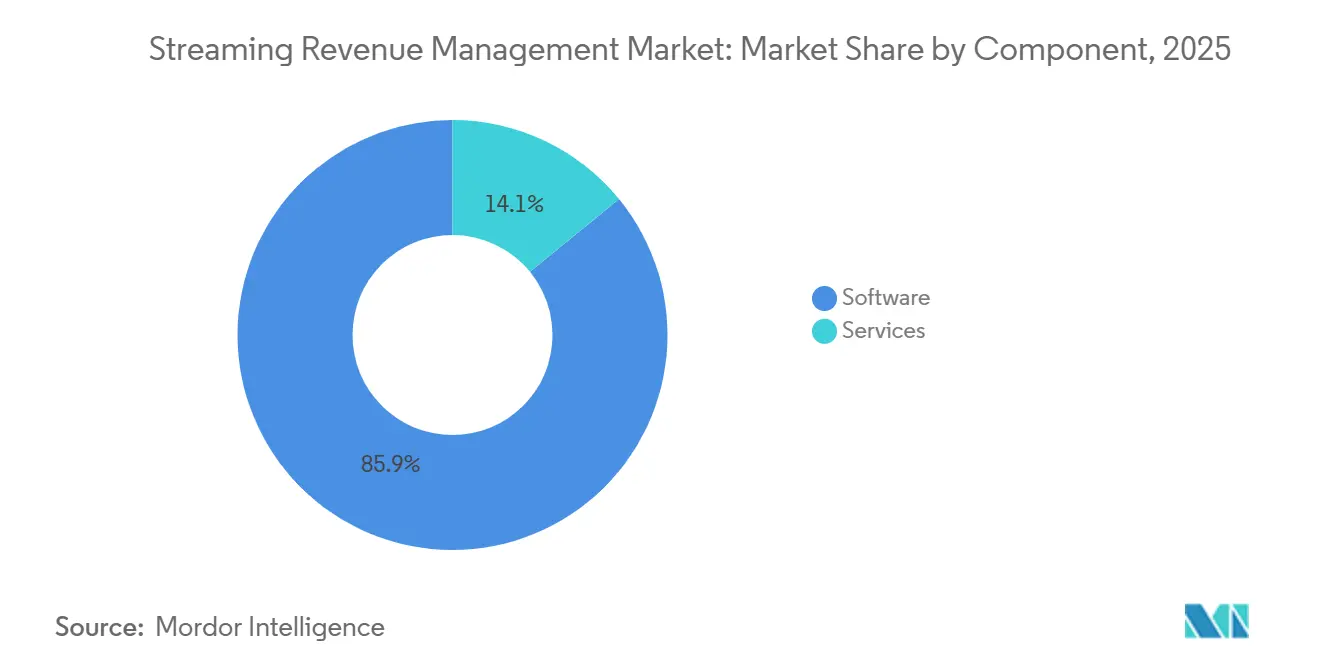
- By component, software held 85.90% of the streaming revenue management market share in 2025, while services are projected to expand at a 12.05% CAGR through 2031.
- By revenue model, recurring subscription billing (SVOD) accounted for 45.50% of the streaming revenue management market share in 2025, while advertising-supported billing (AVOD/FAST) is projected to expand at a 12.22% CAGR through 2031.
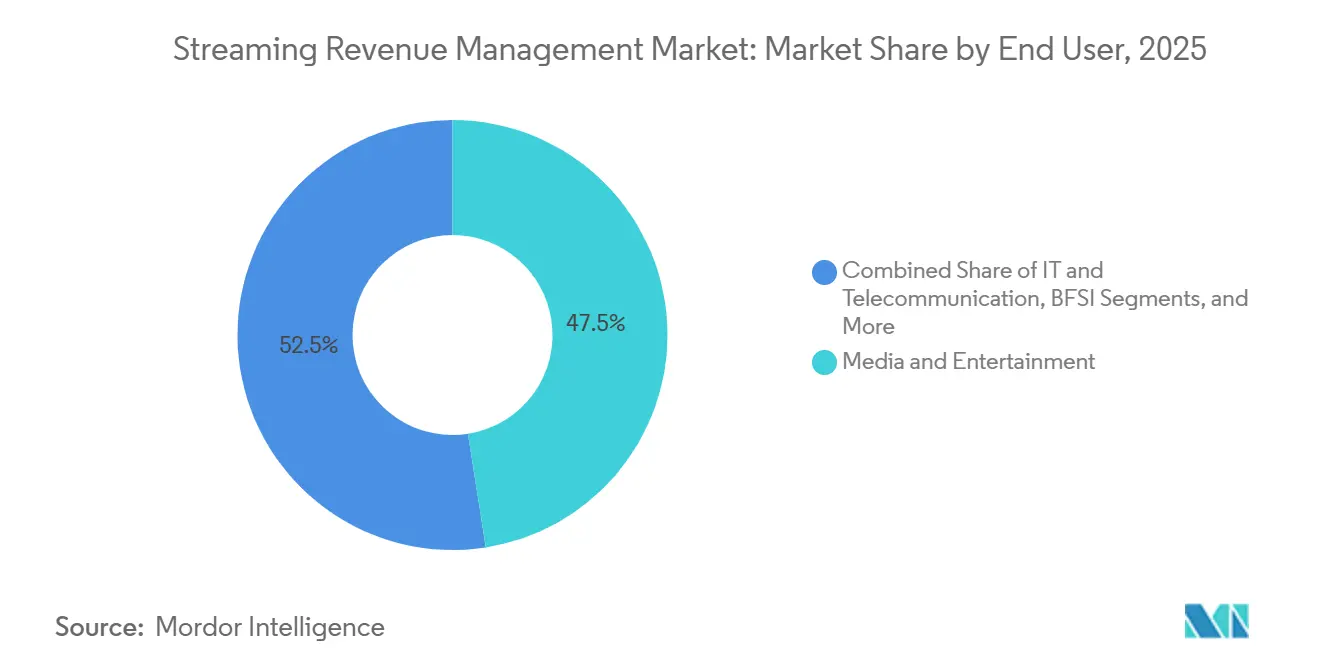
- By end user, media and entertainment held 47.52% share in 2025, while e-learning and education is projected to expand at an 11.94% CAGR through 2031.
- By deployment mode, cloud held 65.70% share in 2025 and is projected to expand at a 12.31% CAGR through 2031 in the streaming revenue management market.
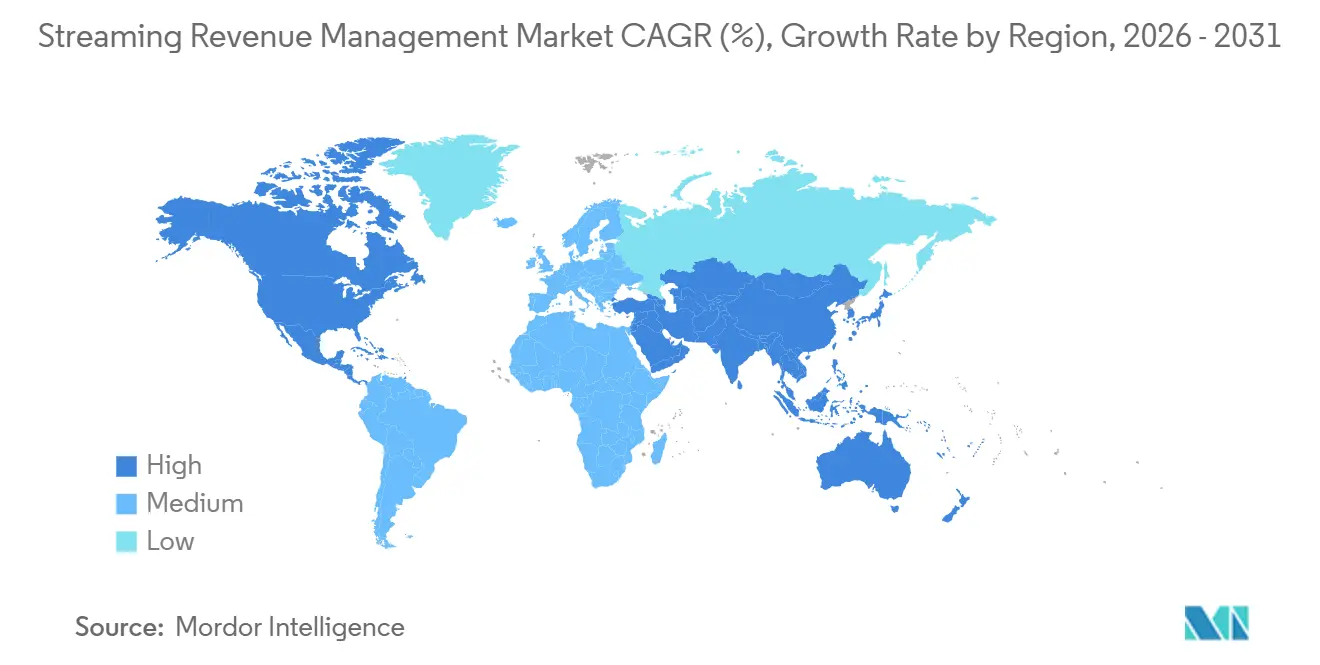
- By geography, North America held 35.40% share in 2025, while Asia-Pacific is projected to expand at a 12.06% CAGR through 2031.
Note: Market size and forecast figures in this report are generated using Mordor Intelligence’s proprietary estimation framework, updated with the latest available data and insights as of January 2026.
Market Trends and Insights
Drivers Impact Analysis of Streaming Revenue Management Market*
| Driver | (~) % Impact on CAGR Forecast | Geographic Relevance | Impact Timeline |
|---|---|---|---|
| Expansion of Ad-Supported and Hybrid Streaming Monetization | +3.2% | Global, with intensity in North America and Asia-Pacific | Short term (≤ 2 years) |
| Growth of Streaming Bundles and Partner-Led Distribution | +2.6% | North America and Europe core, with spillover to Asia-Pacific | Medium term (2-4 years) |
| Increasing Demand for Global Payment Conversion and Local Payment Rails | +2.0% | Asia-Pacific, South America, Middle East and Africa | Medium term (2-4 years) |
| Rights-Aware Revenue Allocation Across Territories and Content Windows | +1.4% | Global, with highest compliance pressure in Europe and North America | Long term (≥ 4 years) |
| Live-Event Revenue Volatility and Burst Reconciliation Requirements | +1.1% | North America, Europe, and Asia-Pacific | Short term (≤ 2 years) |
| Privacy-Safe First-Party Measurement Under Signal Loss | +0.8% | North America and Europe | Medium term (2-4 years) |
| Source: Mordor Intelligence | |||
Expansion of Ad-Supported and Hybrid Streaming Monetization
Advertising-supported viewing is changing the transactions that streaming billing systems must handle. Amagi reported 55% year-over-year growth in global FAST viewing hours in the April-June 2026 period.[1]Amagi, “Amagi Releases June 2026 AIRTIME Report: FAST Viewing Hours Grow 55% YoY as Metadata Friction Escalates,” Amagi Newsroom, amagi.com Platforms must reconcile ad-delivery shortfalls against commitments and issue make-good credits across several ad-serving systems. A service operating SVOD and AVOD tiers must manage subscriber records, content rights, and advertising inventory that settle with different counterparties and on different schedules. It therefore needs linked ledgers for recurring subscription revenue and advertising revenue. The Streaming revenue management market benefits when vendors can bring these settlement paths into one reporting and rights-distribution process.
Growth of Streaming Bundles and Partner-Led Distribution
Streaming bundles have made partner distribution more important to subscriber acquisition. Telecommunications operators, broadband providers, device platforms, and aggregators are increasingly involved in how subscribers purchase streaming services. Revenue systems still need to allocate payments among content owners, platform operators, telecommunications partners, device marketplaces, and other participants that may sit between the service and its subscriber. Each participant can apply a fee before the content owner receives its share of subscription revenue, creating a payment sequence that finance teams need to explain, validate, and report accurately. Platforms also lose some direct visibility into payment failures when an intermediary controls the customer billing relationship. The Streaming revenue management market has an opportunity for suppliers that offer established partner connections and automated revenue-share reconciliation.
Increasing Demand for Global Payment Conversion and Local Payment Rails
Expansion into Asia-Pacific, South America, and the Middle East and Africa requires payment options suited to each local market. Local networks such as India’s UPI-based IMPS and NEFT, Brazil’s Pix, and Indonesia’s BI-FAST can reduce the cost and delay associated with cross-border card payments. Recurly added Checkout.com and Nuvei gateway integrations in its April 2026 release to support localized subscription checkout in Brazil and South America.[2]Recurly, “What’s New: Recurly Spring Release 2026 Highlights,” Recurly, recurly.com Payment-record residency rules in several countries further divide billing operations by region. Billing systems must support local currencies, local methods, and regional data handling without disrupting a common subscriber record. This work supports demand for implementation and managed services in the Streaming revenue management market.
Rights-Aware Revenue Allocation Across Territories and Content Windows
Content rights data is becoming part of revenue settlement rather than a later compliance review. Revenue platforms must apply territorial windows, exclusivity terms, and holdback clauses when deciding whether a transaction can be recognized. Watch-time data can also affect the allocation of a subscription pool among titles and rights holders. Universal Music Group reported in January 2026 on the effect of bundled subscription classifications on music publishing economics. These disputes show why allocation logic needs a clear audit trail at title, territory, and window level. The Streaming revenue management market favors vendors that can connect rights data, usage records, billing events, and royalty calculations.
Restraints Impact Analysis of Streaming Revenue Management Market*
| Restraint | (~) % Impact on CAGR Forecast | Geographic Relevance | Impact Timeline |
|---|---|---|---|
| Payment Fraud, Chargebacks, and Involuntary Churn | -1.7% | Global, concentrated in North America and Europe | Short term (≤ 2 years) |
| Legacy Integration and Fragmented Revenue Data | -1.3% | North America, Europe, and Asia-Pacific core markets | Medium term (2-4 years) |
| Multi-Party Content-Rights Waterfall Disputes | -0.9% | Global, with regulatory intensity in Europe and North America | Long term (≥ 4 years) |
| Real-Time Ad-Quality and Make-Good Reconciliation Burden | -0.6% | North America and Europe | Short term (≤ 2 years) |
| Source: Mordor Intelligence | |||
Payment Fraud, Chargebacks, and Involuntary Churn
Payment failures can end a subscription even when the customer did not intend to cancel, which makes lost revenue harder to distinguish from an intentional decision to leave a service. Recurly stated that failed payments could cost subscription companies more than USD 129 billion in 2025.Billing providers must interpret different processor decline codes while avoiding retry activity that creates further fraud alerts, duplicate charges, or a poor customer experience when a legitimate payment problem occurs. Chargebacks add cost because payment networks monitor merchant dispute levels and can impose restrictions when ratios rise. Better retry logic can improve recovery, but it depends on timely data from payment gateways and subscriber systems. This constraint can slow adoption in the Streaming revenue management market when operators cannot integrate their payment data reliably.
Legacy Integration and Fragmented Revenue Data
Broadcasters, telecommunications operators, and pay-TV providers often rely on billing systems built before API-based streaming operations became common. Linking those systems to cloud-based monetization software requires translation of transaction formats, matching of subscriber identities, alignment of product catalogs, and careful mapping of historic payment and entitlement records. Payment events, entitlement records, and rights-consumption data may remain in separate databases without a common identifier. Finance teams then need manual reconciliation before they can complete revenue recognition and audit work, especially where a customer changes package, receives a credit, or accesses content through a partner bundle. Large operators can face long implementations because they need continuity across existing customer and network systems. This limits the pace of replacement projects in the Streaming revenue management market, even as it increases demand for specialist integration services.
*Our forecasts treat driver/restraint impacts as directional, not additive. The impact forecasts reflect baseline growth, mix effects, and variable interactions.
Streaming Revenue Management Market Segment Analysis
By Component:
Software Provides the Core Platform, While Services Address Complex DeliverySoftware held 85.90% of the Streaming revenue management market share in 2025. Streaming operators favor configurable software because it can support subscriber management, payment processing, entitlement control, collections, reporting, and revenue recognition without building a full billing stack internally. Once deployed across these functions, a platform is difficult to replace because customer records, payment routing, promotional rules, financial processes, and internal operating procedures depend on it. Enterprise changes can require parallel operation of old and new systems for extended periods.
Services are projected to grow at a 12.05% CAGR through 2031. Implementation, integration, managed services, and advisory work become necessary as operators add revenue models, launch new offers, connect distribution partners, and expand into new countries with different payment and compliance requirements. Payment rail onboarding, advertising-revenue data pipelines, partner connections, migration of historic account data, and rights-allocation configurations often require work beyond standard software settings. Mid-sized platforms also use managed services when they lack teams to maintain billing operations continuously. Evergent introduced its Agentic Revenue Orchestration Platform in April 2026, adding AI agents for subscriber lifecycle workflows.[3]Evergent, “Evergent Introduces Agentic Revenue Orchestration Platform to Transform Subscriptions from Transactions to Intelligence,” Evergent Press Release, evergent.com


By Revenue Model:
Advertising-Supported Services Add New Settlement RequirementsRecurring subscription billing, or SVOD, accounted for 45.50% of the Streaming revenue management market share in 2025. Its position reflects the installed base of subscription tools used by early streaming services, which were designed around direct recurring charges and standard access entitlements. The model remains important for predictable recurring revenue and direct subscriber relationships. It also provides the foundation for entitlement management and renewal processing.
Advertising-supported billing, including AVOD and FAST, is projected to grow at a 12.22% CAGR through 2031. Its growth requires platforms to reconcile impressions, delivery obligations, agency fees, advertiser commitments, campaign adjustments, and credits alongside subscription transactions. Hybrid offerings use SVOD, AVOD, and TVOD processes at the same time, rather than selecting one route to revenue. TVOD and pay-per-view remain relevant for live sports and premium film releases. The Streaming revenue management industry needs systems that can consolidate these transactions into one reporting period and one financial record.
By End User:
Media and Entertainment Leads, While Education Broadens DemandMedia and entertainment held 47.52% of the Streaming revenue management market size in 2025. The sector adopted OTT billing early and has complex needs across territorial rights, partner revenue shares, subscriber entitlements, promotional offers, refunds, and ad-delivery reconciliation. These requirements have shaped the product development priorities of many specialized vendors, particularly in billing controls, rights reporting, payment recovery, and partner settlement. The sector also has the largest concentration of services that combine subscriptions, advertising, and transactional access.
E-learning and education is projected to grow at an 11.94% CAGR through 2031. Subscription-based course providers and learning management systems use recurring billing, multi-seat accounts, trial periods, institutional contracts, and access permissions that resemble streaming operations. Their usage rules can differ because access may depend on enrollment or course completion rather than viewing time. Financial services and healthcare providers also monetize specialized content and data subscriptions, but their compliance requirements raise the standard for platform controls, record retention, access management, and payment-data handling. Retail, e-commerce, IT, and telecommunications users apply similar tools to subscription commerce and digital service monetization.

By Deployment Mode:
Cloud Combines Scale With Operational FlexibilityCloud deployment held 65.70% of the Streaming revenue management market size in 2025 and is projected to grow at a 12.31% CAGR through 2031. The segment leads because streaming services need capacity that can increase during major content releases and live events. Cloud systems can also support rapid updates to payment rules, pricing options, promotional terms, product packages, customer notifications, and reporting workflows. This makes them suitable for frequent changes in monetization design.
Oracle describes Cloud Scale Billing as a cloud-native billing and revenue management system for communications providers. On-premises systems remain important where data residency rules limit the handling of payment data through shared cloud environments. This applies in China, Russia, parts of the Middle East, and certain regulated financial services settings. Hybrid configurations can retain identity and payment data locally while using cloud tools for analytics, reporting, operational monitoring, and selected revenue-management processes. The Streaming revenue management market therefore continues to require flexible deployment models rather than a uniform cloud approach.
Geography Analysis
North America Streaming Revenue Management Market
North America held 35.40% of the Streaming revenue management market share in 2025. The region has a mature set of premium streaming services, advertising technology providers, payment processors, device ecosystems, and partner distribution relationships that add layers to subscription and advertising settlement. Operators often manage subscriptions, advertising, transactions, wholesale arrangements, promotional pricing, and device or channel distribution agreements at the same time. This increases the need for systems that reconcile multiple revenue streams and support transparent customer cancellation processes.
APAC Streaming Revenue Management Market
Asia-Pacific is projected to grow at a 12.06% CAGR through 2031. India, Japan, Indonesia, and China each have different payment habits, local platforms, and data rules. Revenue recovery depends on using local payment methods where card use is less common. Providers must also support local settlement, language, currency, customer-service processes, and subscriber-management requirements while maintaining reliable group reporting across markets. These conditions make regional implementation capability important for the Streaming revenue management market, because a billing design that works in one country may not serve local payment, reporting, and data-handling needs in another.
EMEA and South America Streaming Revenue Management Market
Europe was the third-largest regional contributor in 2025, with the United Kingdom and Germany holding large pools of streaming subscriber revenue. The region has demanding rules for digital value-added tax, electronic invoicing, personal data handling, and cross-border transaction reporting, which can affect the configuration of billing and finance workflows. Payment providers offering standard SEPA transfers were required from October 2025 to offer SEPA Instant at the same price, which increased expectations for rapid payment confirmation. South America is gaining importance as local platform activity and Pix-based subscription payments expand. The Middle East benefits from investment in digital infrastructure, while Africa has a longer-term opportunity as mobile money services support subscription payments where card access is limited.

Competitive Landscape
The Streaming revenue management market is moderately fragmented. Evergent, Cleeng, Vindicia, and Gotransverse compete for digital-native streaming customers. Zuora, Oracle, SAP SE, and Salesforce serve larger media groups and telecommunications operators that need enterprise financial integration. Vendors compete on billing depth, payment coverage, tax and invoicing support, reporting, revenue recognition, partner settlement, and the ability to manage several business models together without creating separate data records for each channel.
Zuora launched its AI Monetization Suite in June 2026, including an AI Pricing Simulator for evaluating pricing models, contract decisions, and usage scenarios before customer rollout. Evergent launched an AI-enabled revenue orchestration platform in April 2026 for subscriber lifecycle management. These releases show that vendors are incorporating churn prevention, payment recovery, and pricing support directly into core products. Such functions can make a platform harder to replace once they become part of daily commercial operations, because pricing, collections, customer support, and finance teams may all rely on the same decisions and data.
Chargebee and Avalara launched an integration in May 2026 for global electronic invoicing and live reporting compliance within the billing lifecycle. Rights-aware revenue allocation remains a specialized area where general billing products may not meet media-specific needs, particularly when rights terms differ by title, distribution window, territory, language, or commercial partner. FAST advertising settlement is another gap because many subscription tools lack direct connections with ad-insertion and demand-side platforms. Mid-sized services in Asia-Pacific and South America can be difficult for enterprise suppliers to serve at an appropriate cost. Pre-certified payment and invoicing controls raise entry barriers for new vendors, as customers may prefer suppliers that already support established compliance and reporting processes. The Streaming revenue management market rewards suppliers that combine media workflows with regional compliance and payments capability.
Recent Industry Developments in Streaming Revenue Management Market
- July 2026: Amagi released its June 2026 AIRTIME Report, documenting 55% year-over-year growth in global FAST viewing hours and a 53% increase in ad impressions across approximately 6,500 FAST channel deliveries on its THUNDERSTORM server-side ad insertion platform. South America recorded the strongest regional growth, with hours of viewing up 190% and ad impressions up 124%, reflecting the region's rapid monetization infrastructure build-out and its increasing relevance to global FAST revenue management workflows.
- June 2026: Zuora launched its AI Monetization Suite on June 4, 2026, introducing an AI Pricing Simulator that allows companies to evaluate pricing models, contract decisions, and usage scenarios before customer rollout. Additional capabilities include Metered Entitlements for configuring usage-based AI product billing and Flexible Commitments for structuring committed spend agreements, signaling Zuora's strategic pivot toward usage-based and AI-product monetization architectures alongside subscription billing.
- May 2026: Avalara and Chargebee launched a strategic integration on May 21, 2026, to automate global e-invoicing and live reporting compliance directly within the Chargebee billing lifecycle. The integration connects Chargebee customers to international e-invoicing exchange networks including Peppol and national tax systems, leveraging Avalara's AI-powered compliance capabilities across its 54 billion+ annual transaction processing volume.
- April 2026: Evergent introduced its Agentic Revenue Orchestration Platform on April 14, 2026, deploying purpose-built AI agents across subscriber lifecycle management workflows for streaming, direct-to-consumer sports, telecommunications, and gaming. The platform draws on insights from more than 1 billion users and over USD 8 billion in annual subscription transactions across 180+ countries, with full deployment availability confirmed for Q2 2026.


Global Streaming Revenue Management Market Report Scope
The Global Streaming Revenue Management Market refers to the ecosystem of software, platforms, and services that enable streaming content providers, over-the-top (OTT) platforms, digital broadcasters, music streaming services, live-streaming operators, and media companies to optimize, manage, and maximize revenue generated from subscription, advertising, pay-per-view, transactional video-on-demand (TVOD), hybrid monetization, and other digital streaming business models.
The Streaming Revenue Management Market is Segmented by Component (Software, Services [Implementation and Integration Services, Managed Services, and Consulting and Advisory Services]), Revenue Model (Recurring Subscription Billing (SVOD), Transactional Billing (TVOD/PPV), Advertising-Supported Billing (AVOD/FAST), and Hybrid Monetization Billing), End User (Media and Entertainment, E-Learning and Education, BFSI, Retail and E-commerce, IT and Telecommunication, Healthcare and Life Sciences, Government and Public Sector, and Other End Users), Deployment Mode (Cloud, On-Premises, and Hybrid Cloud), and Geography (North America, South America, Europe, Asia-Pacific, Middle East, and Africa). The Market Forecasts are Provided in Terms of Value (USD).
| Software | |
| Services | Implementation and Integration Services |
| Managed Services | |
| Consulting and Advisory Services |
| Recurring Subscription Billing (SVOD) |
| Transactional Billing (TVOD/PPV) |
| Advertising-Supported Billing (AVOD/FAST) |
| Hybrid Monetization Billing |
| Media and Entertainment |
| E-Learning and Education |
| BFSI |
| Retail and E-commerce |
| IT and Telecommunication |
| Healthcare and Life Sciences |
| Government and Public Sector |
| Other End Users |
| Cloud |
| On-Premises |
| Hybrid Cloud |
| North America | United States |
| Canada | |
| Mexico | |
| South America | Brazil |
| Argentina | |
| Rest of South America | |
| Europe | United Kingdom |
| Germany | |
| France | |
| Italy | |
| Spain | |
| Russia | |
| Rest of Europe | |
| Asia-Pacific | China |
| India | |
| Japan | |
| South Korea | |
| Australia | |
| Southeast Asia | |
| Rest of Asia-Pacific | |
| Middle East | United Arab Emirates |
| Saudi Arabia | |
| Turkey | |
| Israel | |
| Rest of Middle East | |
| Africa | South Africa |
| Nigeria | |
| Egypt | |
| Rest of Africa |
| By Component | Software | |
| Services | Implementation and Integration Services | |
| Managed Services | ||
| Consulting and Advisory Services | ||
| By Revenue Model | Recurring Subscription Billing (SVOD) | |
| Transactional Billing (TVOD/PPV) | ||
| Advertising-Supported Billing (AVOD/FAST) | ||
| Hybrid Monetization Billing | ||
| By End User | Media and Entertainment | |
| E-Learning and Education | ||
| BFSI | ||
| Retail and E-commerce | ||
| IT and Telecommunication | ||
| Healthcare and Life Sciences | ||
| Government and Public Sector | ||
| Other End Users | ||
| By Deployment Mode | Cloud | |
| On-Premises | ||
| Hybrid Cloud | ||
| By Geography | North America | United States |
| Canada | ||
| Mexico | ||
| South America | Brazil | |
| Argentina | ||
| Rest of South America | ||
| Europe | United Kingdom | |
| Germany | ||
| France | ||
| Italy | ||
| Spain | ||
| Russia | ||
| Rest of Europe | ||
| Asia-Pacific | China | |
| India | ||
| Japan | ||
| South Korea | ||
| Australia | ||
| Southeast Asia | ||
| Rest of Asia-Pacific | ||
| Middle East | United Arab Emirates | |
| Saudi Arabia | ||
| Turkey | ||
| Israel | ||
| Rest of Middle East | ||
| Africa | South Africa | |
| Nigeria | ||
| Egypt | ||
| Rest of Africa | ||


Key Questions Answered in the Report
What is the size of the streaming revenue management market?
The streaming revenue management market is estimated at USD 1.15 billion in 2026 and is forecast to reach USD 1.99 billion by 2031, growing at a CAGR of 11.59%. Growth is driven by the increasing need to manage subscription, advertising, transactional, and partner revenue streams within integrated systems.
What is driving demand for streaming revenue management software?
Demand is rising because streaming services require platforms that can manage subscriptions, advertising, transactions, partner payouts, and revenue reporting within a unified environment. The need becomes more critical as providers adopt multiple customer acquisition and monetization models.
Which component leads streaming revenue management spending?
Software accounted for the largest share at 85.90% in 2025, while the services segment is expected to grow at a 12.05% CAGR through 2031. Services demand is supported by implementation, integration, managed services, and consulting requirements.
Which revenue model is growing fastest?
AVOD (Advertising Video on Demand) and FAST (Free Ad-Supported Streaming TV) billing are projected to grow at a 12.22% CAGR through 2031. Expansion of advertising-supported streaming models is increasing the complexity of ad delivery, billing, credit management, and settlement processes.
Which region is growing fastest for these platforms?
Asia-Pacific is expected to be the fastest-growing region, with a 12.06% CAGR through 2031. Growth is supported by regional payment integrations, diverse regulatory requirements, local currencies, and market-specific delivery needs.
Why are cloud billing deployments expanding?
Cloud deployments held a 65.70% market share in 2025 and are projected to grow at a 12.31% CAGR through 2031. Their scalability supports live events and evolving monetization models, while hybrid deployments remain important for organizations that need to retain certain identity or payment data on-premises.
Page last updated on:





