SSD Caching Market Size and Share
Market Overview
| Study Period | 2020 - 2031 |
|---|---|
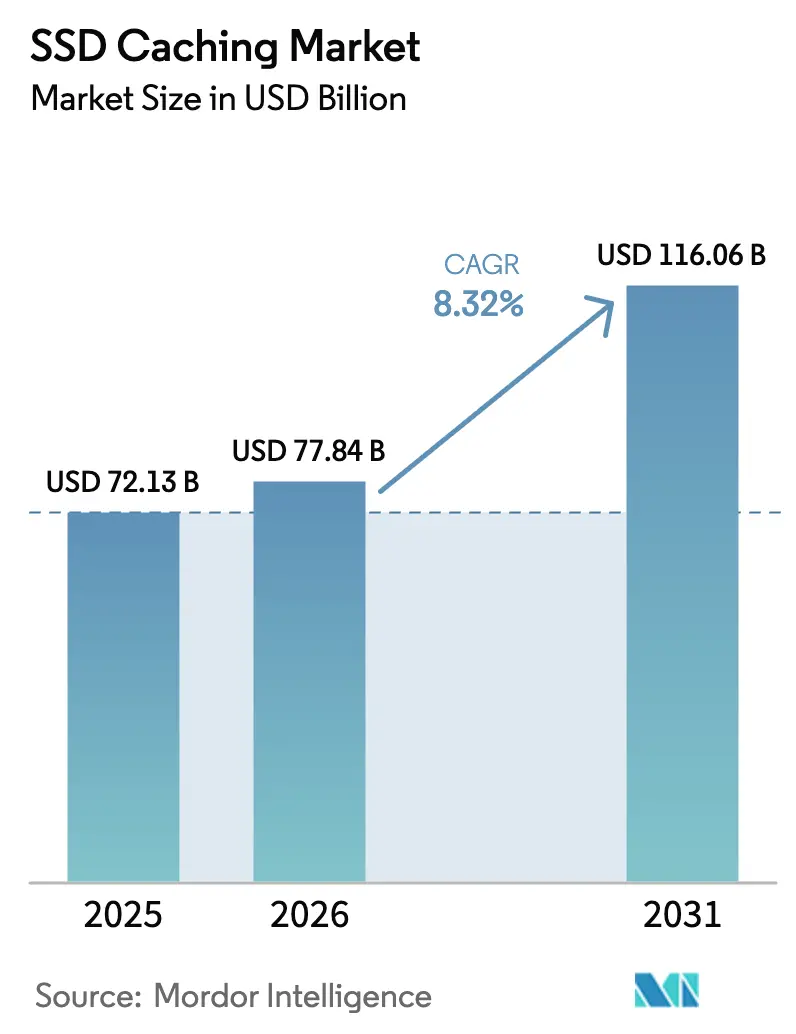
| Market Size (2026) | USD 77.84 Billion |
| Market Size (2031) | USD 116.06 Billion |
| Growth Rate (2026 - 2031) | 8.32% CAGR |
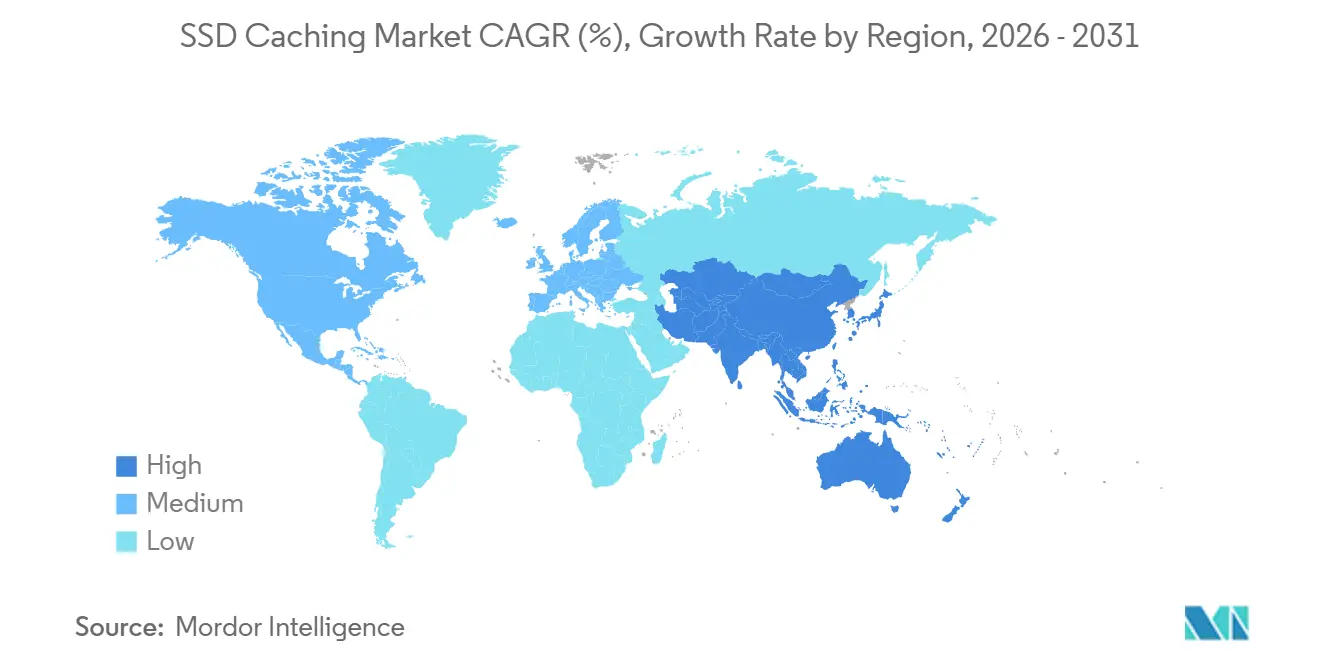
| Fastest Growing Market | Asia Pacific |
| Largest Market | North America |
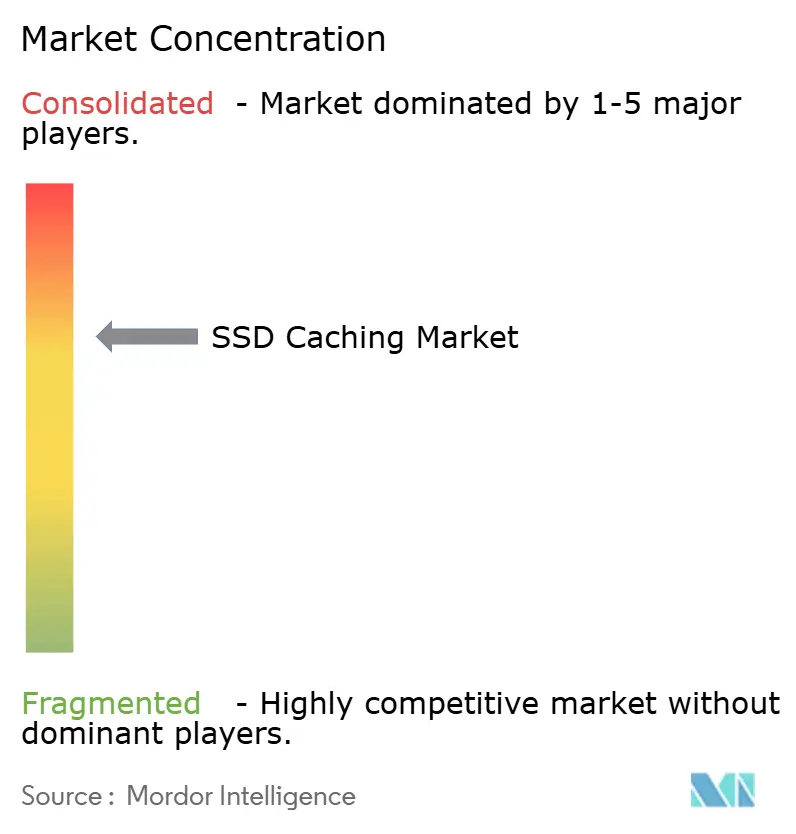
| Market Concentration | Medium |
Major Players *Disclaimer: Major Players sorted in no particular order Image © Mordor Intelligence. Reuse requires attribution under CC BY 4.0. | |
SSD Caching Market Analysis by Mordor Intelligence
The SSD caching market size is expected to grow from USD 72.13 billion in 2025 to USD 77.84 billion in 2026 and is forecast to reach USD 116.06 billion by 2031 at 8.32% CAGR over 2026-2031. Unrelenting demand for low-latency data services, the mainstreaming of PCIe 5.0 and Compute Express Link (CXL), and enterprise adoption of sovereign-AI workflows are lifting near-term revenue. Hardware share stays dominant, yet the pivot toward software-defined tiering is unmistakable as virtualization decouples performance tiers from physical media. Cloud-native deployments are accelerating because hyperscalers now expose NVMe-over-Fabrics as a routine service, while on-premise arrays defend share through consumption-based pricing. Competitive energy has moved from raw capacity to protocol interoperability and endurance, creating space for vendors that own both NAND fabrication and firmware road maps. Supply-chain volatility, geopolitical export controls, and emerging data-sovereignty rules remain the chief headwinds, but the SSD caching market continues to reward providers that combine vertical integration with flexible licensing.
Key Report Takeaways
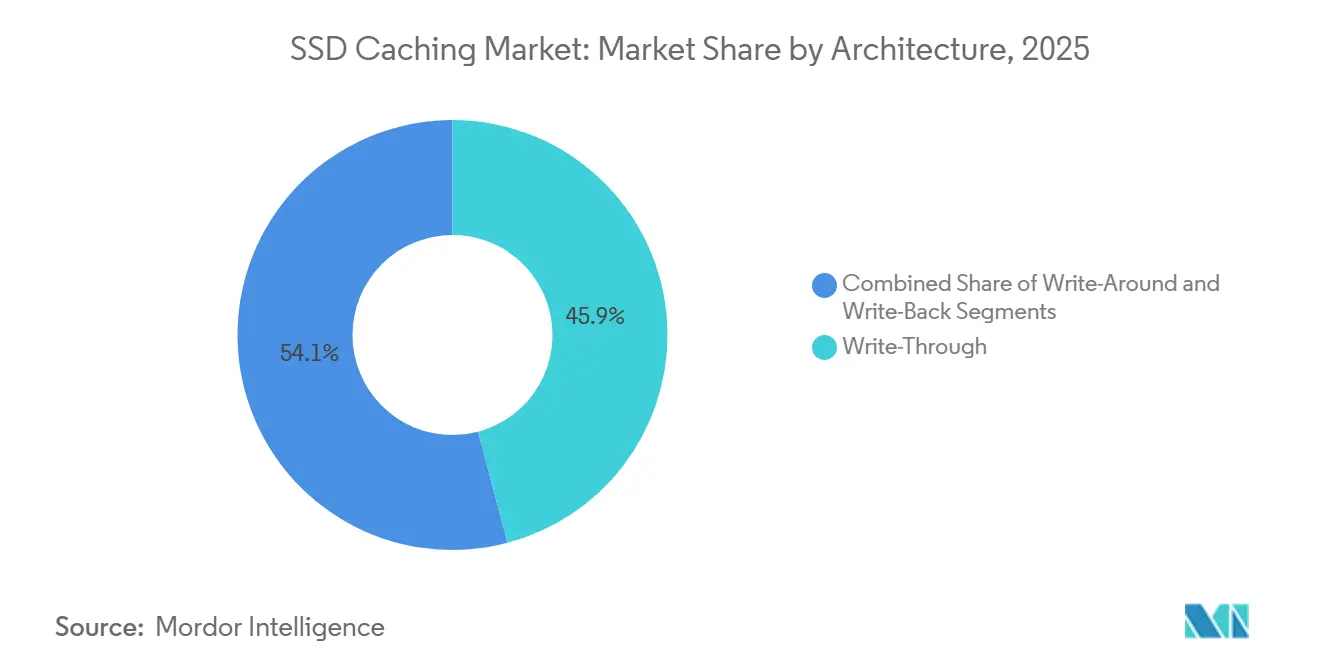
- By architecture, write-through captured 45.88% of the market share in 2025, whereas write-around is projected to expand at a 9.34% CAGR through 2031, the fastest among caching modes.
- By component, hardware commanded 68.63% of the market share in 2025, yet software-defined layers are forecast to grow at a 9.56% CAGR through 2031, the highest within the stack.
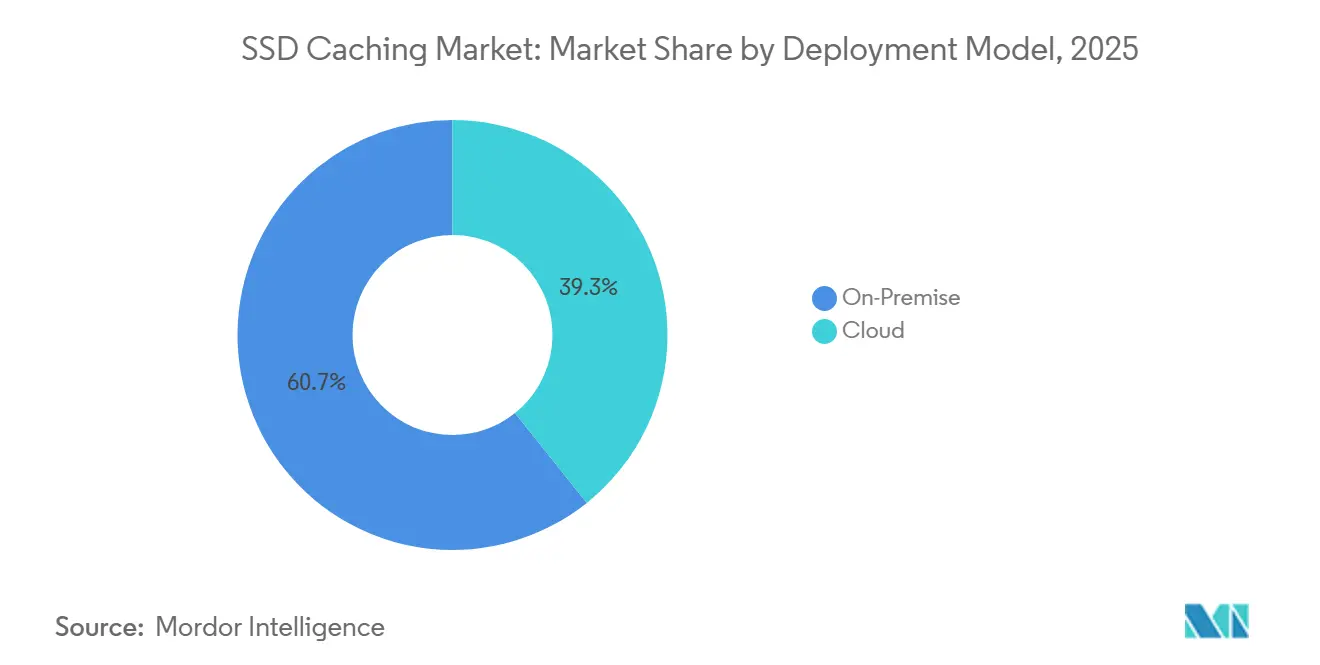
- By deployment model, on-premises installations accounted for 60.74% of the market share in 2025, while cloud-native caching is advancing at a 9.82% CAGR through 2031, outpacing all other environments.
- By application, enterprise servers led with 69.13% share in 2025, but personal computing is advancing at a 9.42% CAGR through 2031, the quickest segment.
- By region, North America held 38.84% of the market share in 2025; Asia-Pacific is poised to clock the strongest regional CAGR at 9.91% over 2026-2031.
Note: Market size and forecast figures in this report are generated using Mordor Intelligence’s proprietary estimation framework, updated with the latest available data and insights as of January 2026.
Global SSD Caching Market Trends and Insights
Drivers Impact Analysis*
| Driver | (~) % Impact on CAGR Forecast | Geographic Relevance | Impact Timeline |
|---|---|---|---|
| Accelerated Adoption of NVMe-Based Data Centers | +2.1% | Global, with concentration in North America and Asia-Pacific | Medium term (2-4 years) |
| Rising Data Analytics Workloads Across Enterprises | +1.8% | Global, strongest in North America and Europe | Short term (≤ 2 years) |
| Demand for Low-Latency Edge Computing Infrastructure | +1.5% | Asia-Pacific core, spill-over to Middle East and Africa | Medium term (2-4 years) |
| Growth in Hyperconverged Infrastructure Deployments | +1.3% | North America and Europe, emerging in Asia-Pacific | Medium term (2-4 years) |
| Mainstreaming of PCIe 5.0 and CXL Protocol Support | +1.0% | Global, led by North America and Asia-Pacific | Long term (≥ 4 years) |
| Enhanced SSD Endurance Through AI-Enabled Wear-Leveling | +0.7% | Global, with early adoption in North America | Long term (≥ 4 years) |
| Source: Mordor Intelligence | |||
Accelerated Adoption of NVMe-Based Data Centers
NVMe-over-Fabrics is replacing SATA and SAS, slashing latency from milliseconds to microseconds and allowing each drive to serve order-of-magnitude more IOPS. Intel reported that NVMe SSD attach rates in Xeon platforms exceeded 75% in Q1 2026, underscoring hyperscaler standardization. Kioxia’s PCIe 5.0 CD9P drive delivers 14 GB/s reads, enabling one device to replace three Gen4 units and cut rack count, power, and cooling. The switch strains legacy block-protocol SANs, pushing enterprises toward software-defined storage fabrics that add license overhead but unlock sub-100-microsecond cache hits.[1]Intel Corporation, “Intel Reports First Quarter 2026 Financial Results,” intc.com
Rising Data Analytics Workloads Across Enterprises
Global data-warehouse query volumes expanded 42% year-over-year in 2025 as generative-AI workloads exploded, intensifying demand for sustained random reads. Dell noted a 63% shipment jump for PowerStore arrays with integrated NVMe caching among financial-services customers. SSD caches permit enterprises to stage hot datasets on a fraction of total capacity, postponing costly capacity upgrades while maintaining service-level agreements. Machine-learning-based prefetching is emerging to stabilize cache-hit ratios amid shifting access patterns.[2]Dell Technologies, “Dell Reports Fourth Quarter and Full Year Fiscal 2025 Results,” investors.delltechnologies.com
Demand for Low-Latency Edge Computing Infrastructure
Manufacturing, retail, and telecom verticals now deploy localized caches to avoid cloud round-trips that bust the 10-millisecond budget for AR and autonomous-vehicle telemetry. HPE and Verizon began rolling out NVMe-backed edge servers at 5G sites in late 2025, while Samsung shipped an industrial-grade SSD certified for -40 °C to 85 °C operation and power-loss protection. China’s Cybersecurity Law compounds localization by requiring data generated domestically to stay onshore, driving region-specific cache builds and favoring vendors adept at compliance.[3]Hewlett Packard Enterprise, “HPE Partners with Verizon on Edge Computing Infrastructure,” hpe.com
Growth in Hyperconverged Infrastructure Deployments
Nutanix stated that 68% of new clusters shipped in FY2026 included NVMe caching, a jump from 41% two years earlier. A 4-node hyperconverged setup with NVMe cache can now match the IOPS of a 12-node all-flash array at 60% of capital cost, attracting mid-market enterprises. Still, shared cache pools suffer noisy-neighbor issues, prompting vendors to add quality-of-service profiles and giving rise to managed hyperconverged services that offer pre-tuned caching.
Restraints Impact Analysis*
| Restraint | (~) % Impact on CAGR Forecast | Geographic Relevance | Impact Timeline |
|---|---|---|---|
| High Upfront Capital Expenditure for Enterprise SSD Caches | -1.4% | Global, most acute in cost-sensitive emerging markets | Short term (≤ 2 years) |
| Complexity in Maintaining Multi-Tier Storage Architectures | -1.1% | Global, particularly in North America and Europe | Medium term (2-4 years) |
| Limited Performance Gains for Write-Intensive Workloads | -0.8% | Global, with higher impact in transactional database segments | Medium term (2-4 years) |
| Supply Chain Volatility in Advanced NAND Components | -0.9% | Global, with acute effects in Asia-Pacific manufacturing hubs | Short term (≤ 2 years) |
| Source: Mordor Intelligence | |||
High Upfront Capital Expenditure for Enterprise SSD Caches
Enterprise NVMe SSDs cost USD 0.80-1.20 per gigabyte versus USD 0.05 for nearline HDDs, a 16-24× delta that deters upgrades. Micron’s 15% price hike in FY2025 reversed years of ASP declines as AI servers absorbed wafer output. Consumption-based programs like Pure Storage’s Evergreen//Forever mitigate capex but remain sub-20% penetrated, creating a bifurcated market where hyperscalers advance and mid-tier buyers sweat Gen4 assets.
Complexity in Maintaining Multi-Tier Storage Architectures
NetApp revealed that over one-third of ONTAP support tickets stem from cache-tier misconfiguration. Caching hit ratios swing wildly with workload locality shifts, and AI-driven tiering needs months of telemetry to settle. Small IT teams lack tuning expertise, often reverting to simpler all-flash arrays that trade cost efficiency for operational ease. Industry groups are developing standard APIs, but convergence remains years away.
*Our forecasts treat driver/restraint impacts as directional, not additive. The impact forecasts reflect baseline growth, mix effects, and variable interactions.
Segment Analysis
By Architecture: Write-Through Stability, Write-Around Momentum
Write-through retained 45.88% of the market share in 2025, anchoring the SSD caching market as transactional databases insist on synchronous durability. Large financial and e-commerce platforms favor the design because every write is mirrored to the origin, eliminating data-loss concerns. Yet write-around will post the fastest growth at a 9.34% CAGR through 2031, reflecting analytics workloads where read latency trumps write speed. Software-defined arrays now let administrators toggle among caching modes per volume, injecting flexibility legacy controllers lack, and supporting the widening workload split within the SSD caching market.
The surge of PCIe 5.0 bandwidth permits ingest traffic to bypass cache without choking write-around arrays, removing a historic bottleneck. Snowflake and Databricks have standardized on the model for cloud warehouses that show 95% read ratios, signaling a broad architectural pivot. Meanwhile, write-back persists for mixed workloads but depends on battery-backed volatile buffers or persistent memory modules. Overall, the panoply of caching modes expands buyer choice and intensifies feature competition across the SSD caching market.


By Component: Software-Defined Share Inches Up
Hardware accounted for 68.63% of market share in 2025, but software-defined caching platforms are on pace for a 9.56% CAGR through 2031 as enterprises decouple logical performance layers from the underlying media. Platforms such as DataCore SANsymphony convert any block device into a cache tier, squeezing residual value from aging SAS drives and sliding PCIe 5.0 SSDs into the same cluster. This shift lowers vendor lock-in, though it pressures drive makers to embed smarter firmware to differentiate.
Micron’s 9550 SSD integrates on-controller machine learning that predicts hot data. Samsung’s Flexible Data Placement allows hosts to steer writes to high-endurance SLC within the same drive. These innovations blur the boundaries between hardware and software feature sets in the SSD caching market, prompting buyers to reassess total-cost-of-ownership frameworks.
By Deployment Model: Cloud-Native Caching Scales Out
On-premise retained 60.74% of the market share in 2025 thanks to data-residency mandates in finance, healthcare, and public sectors. Consumption models such as Dell APEX now let customers lease capacity, easing capex but keeping data on site. Even so, cloud-native caching is growing at a 9.82% CAGR as AWS io2 Block Express and Microsoft Azure Premium SSD v2 deliver per-volume IOPS and throughput rivalling on-premise arrays.
Hybrid blueprints dominate strategy: latency-sensitive databases stay local while burst analytics fluidly extend into the cloud. Unified control planes from NetApp BlueXP and Pure Storage Portworx orchestrate cache tiers across locations, reducing operational toil. Data-sovereignty laws in Europe and China force multinationals to duplicate caches per jurisdiction, heightening complexity but enlarging addressable demand for integrated management across the SSD caching market.
By Application: Servers Dominate, Clients Accelerate
Enterprise servers accounted for 69.13% of the market share in 2025, as AI training clusters require sub-millisecond access to checkpoint files. NVIDIA’s DGX SuperPOD prescribes almost 2 TB of NVMe cache per GPU node, and distributed databases like MongoDB Atlas place local NVMe ahead of shared storage to guarantee consistent latency across sharded clusters. These practices lock enterprise servers as the anchor tenant in the SSD caching market size through mid-decade.
Personal computing, however, will rise at a 9.42% CAGR through 2031. Microsoft Copilot and Apple Intelligence both cache model weights locally to avoid cloud calls, driving higher-endurance specs into consumer SSDs. Workstations for video editing and CAD similarly rely on client-side caches to remove congestion on shared NAS links. Right-to-repair laws in the European Union may force modular SSD designs, reshaping notebook and small-form-factor desktops and adding incremental volume to the SSD caching market.
Geography Analysis
North America led with 38.84% of the market share in 2025, anchored by hyperscale campuses in Virginia, Oregon, and Texas that consume thousands of PCIe 5.0 drives per month. Federal incentives under the CHIPS and Science Act encourage domestic assembly, and encryption mandates such as FIPS 140-3 narrow the supplier field to drives with certified secure firmware. Replacement cycles, however, lengthen beyond five years, moderating growth relative to other regions.
Asia-Pacific will post the fastest 9.91% CAGR through 2031. China’s 14th Five-Year Plan targets 70% self-sufficiency in enterprise storage, spurring indigenous controller and NAND development. SK hynix is spending USD 3.9 billion to triple CXL module capacity by 2028, betting that cache-coherent memory will displace parts of the SSD caching market. India’s data-center build-out, propelled by the Digital Personal Data Protection Act, doubles addressable floor space and lifts regional demand for cache devices tuned to humid, high-temperature environments.
Europe, the Middle East and Africa form a smaller but strategic cluster. GDPR compels in-region caching, benefitting colocation operators that pre-install NVMe arrays. Germany and the United Kingdom lead European spend, while Saudi Arabia and the UAE bankroll sovereign-cloud clusters to cut reliance on U.S. or Chinese hyperscalers. Microsoft Azure’s expansion into Nigeria and Egypt highlights future pull, yet broad African adoption remains gated by inconsistent power grids and limited fiber, restraining the SSD caching market share there.

Competitive Landscape
Market concentration is moderatewith players including Samsung Electronics, Micron Technology, Intel (Solidigm), SK hynix, Kioxia and others. Vertical integration provides the critical moat, allowing these firms to align NAND road maps with controller firmware and to absorb margin across the stack. Fabless assemblers such as Kingston and Seagate sit downstream of NAND pricing swings, exposing them to allocation risk and stiffer commoditization.
Strategy is shifting from gigabytes to protocol sophistication. Samsung and SK hynix embed Flexible Data Placement and CXL capabilities inside new drives, while Pure Storage and NetApp rely on AI tiering algorithms inside systems software to upsell licenses. Hyperscalers complicate the arena: AWS Nitro SSD and Google Hyperdisk use proprietary controllers, relegating merchant drives to capacity rather than cache targets. Compliance adds another hurdle; the EU Cyber Resilience Act will force secure boot and attestation, benefiting incumbents that already operate certified cryptographic supply chains.
Edge caching opens a premium niche. Samsung and Western Digital deliver extended-temperature, power-loss-protected SSDs that command 30-50% premiums and suit telecom base stations. Disruptors such as Astera Labs and Montage Technology push CXL memory modules to replace segments of the SSD caching market where microsecond latency is mandatory. Flexible Data Placement, ratified by the NVM Express consortium, further differentiates vendor offerings and may lock customers into specific firmware ecosystems.
SSD Caching Industry Leaders
Samsung Electronics Co., Ltd.
Intel Corporation
Kioxia Holdings Corporation
Western Digital Corporation
Micron Technology, Inc.
- *Disclaimer: Major Players sorted in no particular order

Recent Industry Developments
- February 2026: SK hynix committed USD 3.9 billion to expand CXL memory-module output in Cheongju, targeting triple capacity by 2028.
- January 2026: Samsung Electronics released its PM9E1 PCIe 5.0 enterprise SSD at 14,500 MB/s sequential reads, promising 25% lower total cost of ownership versus Gen4 drives.
- January 2026: Microsoft Azure launched Premium SSD v2 volumes with decoupled IOPS, throughput, and capacity knobs, trimming over-provisioning costs by up to 40% for analytics workloads.
- December 2025: Lenovo introduced ThinkAgile MX3000 hyperconverged nodes with integrated NVMe caching and Nutanix software, shrinking deployment timelines from weeks to days.


Global SSD Caching Market Report Scope
SSD caching refers to the process of using a solid-state drive (SSD) as a cache to store frequently accessed data, improving system performance and reducing latency. This technology is widely adopted across various industries to enhance the efficiency of enterprise servers and personal computing systems.
The SSD Caching Market Report is Segmented by Architecture (Write-Through, Write-Back, and Write-Around), Component (Hardware, and Software), Deployment Model (On-Premise, and Cloud), Application (Enterprise Servers, and Personal Computing), and Geography (North America, South America, Europe, Asia-Pacific, and Middle East and Africa). The Market Forecasts are Provided in Terms of Value (USD).
| Write-Through |
| Write-Back |
| Write-Around |
| Hardware |
| Software |
| On-Premise |
| Cloud |
| Enterprise Servers |
| Personal Computing |
| North America | United States | |
| Canada | ||
| Mexico | ||
| South America | Brazil | |
| Argentina | ||
| Rest of South America | ||
| Europe | Germany | |
| United Kingdom | ||
| France | ||
| Italy | ||
| Spain | ||
| Rest of Europe | ||
| Asia-Pacific | China | |
| Japan | ||
| India | ||
| South Korea | ||
| Australia | ||
| Rest of Asia-Pacific | ||
| Middle East and Africa | Middle East | Saudi Arabia |
| United Arab Emirates | ||
| Turkey | ||
| Rest of Middle East | ||
| Africa | South Africa | |
| Egypt | ||
| Nigeria | ||
| Rest of Africa | ||
| By Architecture | Write-Through | ||
| Write-Back | |||
| Write-Around | |||
| By Component | Hardware | ||
| Software | |||
| By Deployment Model | On-Premise | ||
| Cloud | |||
| By Application | Enterprise Servers | ||
| Personal Computing | |||
| By Geography | North America | United States | |
| Canada | |||
| Mexico | |||
| South America | Brazil | ||
| Argentina | |||
| Rest of South America | |||
| Europe | Germany | ||
| United Kingdom | |||
| France | |||
| Italy | |||
| Spain | |||
| Rest of Europe | |||
| Asia-Pacific | China | ||
| Japan | |||
| India | |||
| South Korea | |||
| Australia | |||
| Rest of Asia-Pacific | |||
| Middle East and Africa | Middle East | Saudi Arabia | |
| United Arab Emirates | |||
| Turkey | |||
| Rest of Middle East | |||
| Africa | South Africa | ||
| Egypt | |||
| Nigeria | |||
| Rest of Africa | |||


Key Questions Answered in the Report
What is the projected global SSD caching market size by 2031?
The market is forecast to reach USD 116.06 billion in 2031.
What CAGR is projected for global SSD caching through 2031?
The segment is expected to grow at an 8.32% CAGR over 2026-2031.
Which caching architecture is expanding the fastest?
Write-around configurations are forecast to post a 9.34% CAGR through 2031, the highest among all modes.
How much revenue share did North America contribute in 2025?
North America accounted for 38.84% of the SSD caching market in 2025.
Why are software-defined caching layers gaining traction?
They let enterprises mix media types and automate data placement, supporting a 9.56% CAGR for the software segment to 2031.
Which region is poised for the highest growth rate?
Asia-Pacific is set to record the strongest expansion with a 9.91% CAGR, propelled by investments in China and India.
Page last updated on:


