
Special Interest Tourism Market Size and Share
Market Overview
| Study Period | 2022 - 2031 |
|---|---|
| Market Size (2026) | USD 1.63 Trillion |
| Market Size (2031) | USD 2.57 Trillion |
| Growth Rate (2026 - 2031) | 9.53 % |
| Fastest Growing Market | Asia-Pacific |
| Largest Market | Europe |
| Market Concentration | Medium |
Major Players *Disclaimer: Major Players sorted in no particular order Image © Mordor Intelligence. Reuse requires attribution under CC BY 4.0. | |
Special Interest Tourism Market Analysis by Mordor Intelligence
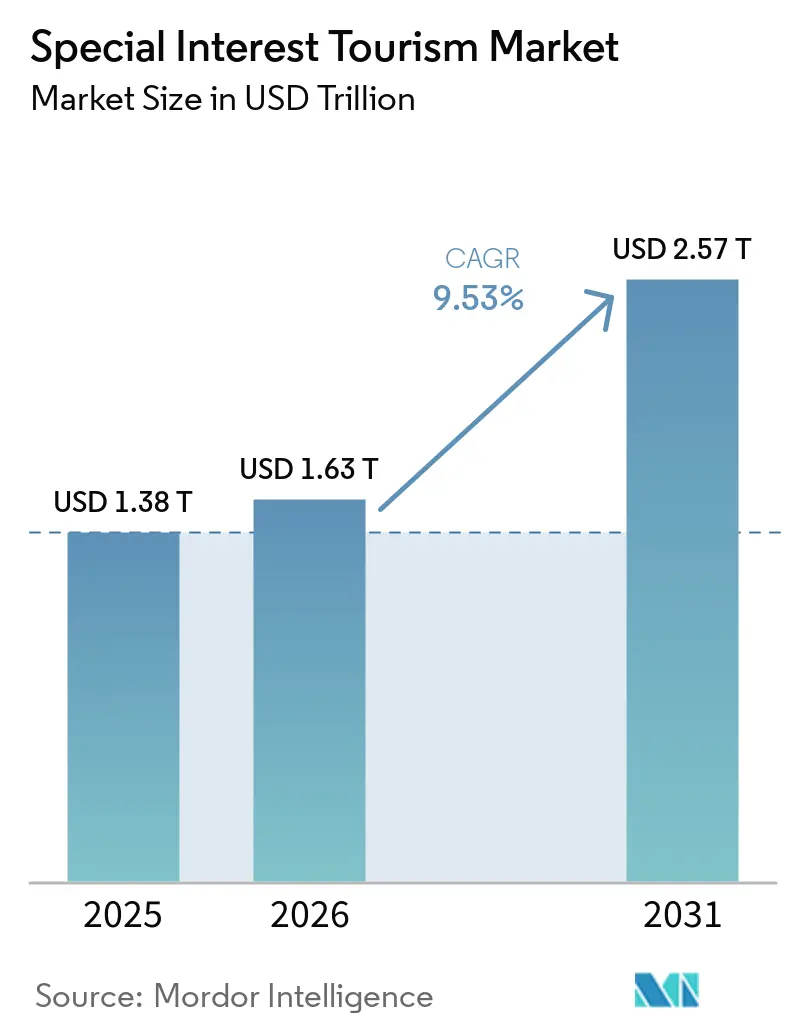
The global special interest tourism market size stood at USD 1.63 trillion in 2026, up from USD 1.38 trillion in 2025, and is projected to reach USD 2.57 trillion by 2031, with a 9.53% CAGR. The special interest tourism market is expanding faster than broader travel demand. In contrast, global travel and tourism contributed a record USD 11.6 trillion to GDP in 2025, equal to 9.8% of the world economy[1]. International tourist arrivals reached 1.52 billion in 2025, up 4% from 2024, while tourism receipts reached USD 1.9 trillion, supporting higher spending on experience-led trips. Cultural and heritage travel remains the scale anchor because protected assets and recognized heritage sites continue to raise destination visibility and arrival volumes. Wellness and medical travel are driving premium growth, as the wellness economy reached USD 6.8 trillion in 2024 and travel-linked health spending continued to strengthen[2]. Regional momentum is also widening, with Europe holding the largest base and Asia-Pacific showing the fastest advance, supported by strong regional travel GDP growth and a larger pipeline of experience-oriented travelers.
Key Report Takeaways
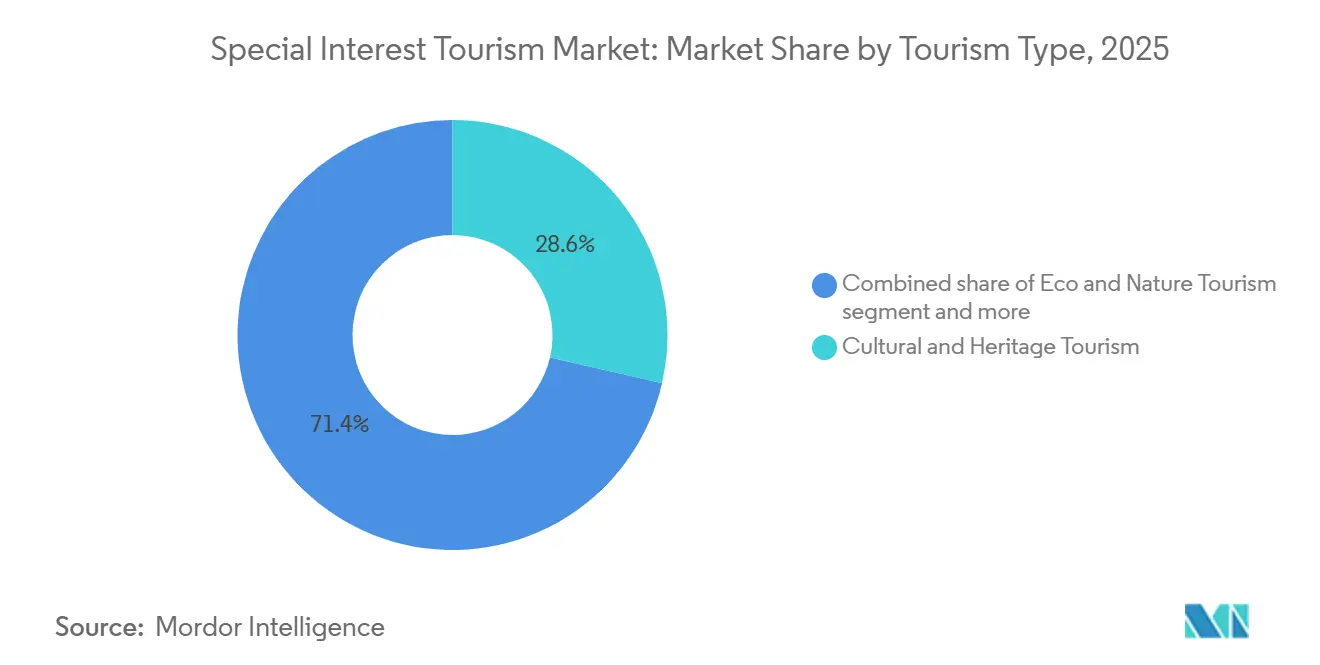
- By tourism type, cultural and heritage tourism held 28.6% of the special interest tourism market share in 2025, while wellness and medical tourism is forecast to expand at a 12.9% CAGR through 2031.
- By tourist type, domestic tourists accounted for 62.4% of the special-interest tourism market share in 2025, while international tourists are projected to grow at a 10.2% CAGR through 2031.
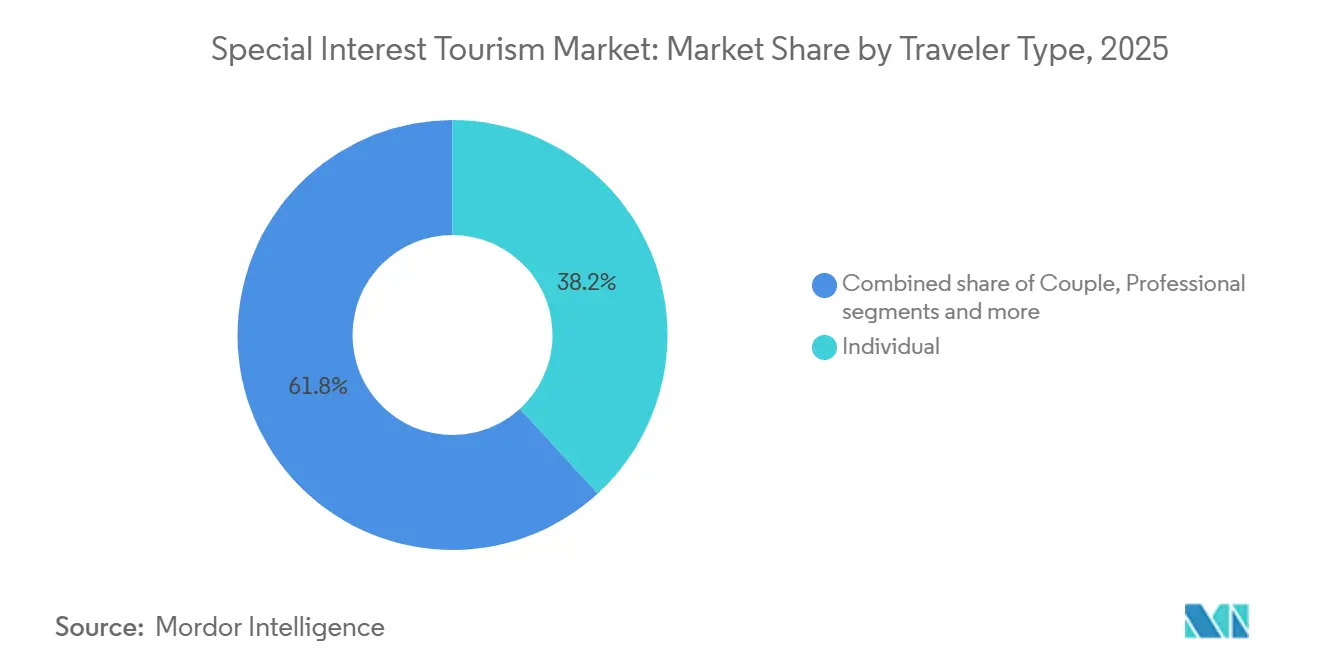
- By traveler type, individual travelers held 38.2% of the special-interest tourism market share in 2025, while professional travelers are projected to grow at an 11.7% CAGR through 2031.
- By booking channel, direct digital booking held 40.1% of the special-interest tourism market share in 2025 and is forecast to grow at a 10.3% CAGR through 2031.
- By geography, Europe held 33.1% of the special interest tourism market share in 2025, while Asia-Pacific is forecast to grow at a 12.4% CAGR through 2031.
Note: Market size and forecast figures in this report are generated using Mordor Intelligence’s proprietary estimation framework, updated with the latest available data and insights as of January 2026.
Market Trends and Insights
Drivers Impact Analysis of Special Interest Tourism Market*
| Driver | (~) % Impact on CAGR Forecast | Geographic Relevance | Impact Timeline |
|---|---|---|---|
| Experiential-Travel Preference Among Millennials and Gen Z | +2.8% | Global, with concentrated effect in North America, Europe, and Asia-Pacific urban markets | Short term (≤ 2 years) |
| Rising Disposable Income in Emerging Economies | +2.1% | Asia-Pacific core, India, Southeast Asia, the Middle East, with spillover to South America | Medium term (2-4 years) |
| Government Incentives for Niche-Tourism Corridors | +1.0% | Middle East, Southeast Asia, South America | Medium term (2-4 years) |
| Blockchain-Enabled Loyalty and ID Increases Traveler Trust | +0.5% | Global, with early adoption in the Middle East and Singapore hub | Long term (≥ 4 years) |
| Creator-Economy Micro-Communities Amplifying Niche Demand | +0.7% | Global, with the highest penetration in Gen Z-heavy North America and Asia-Pacific | Short term (≤ 2 years) |
| Regenerative-Tourism Certifications Driving Premium Pricing | +0.4% | Europe, Oceania, with emerging adoption in Central America and East Africa | Medium term (2-4 years) |
| Source: Mordor Intelligence | |||
Experiential-Travel Preference Among Millennials and Gen Z
The special-interest tourism market is being boosted by a clear shift away from passive sightseeing toward travel with a defined purpose. Mastercard reported in 2025 that nearly 90% of European consumers were seeking more travel and tourism experiences in 2025 than in 2024[3]. PATA also found that more than 90% of Asia-Pacific travelers treat experiences and activities as an intentional part of their travel budget, above the global average of 85%[4]. This behavior favors smaller and more focused products built around culture, food, wellness, and nature. In the special interest tourism market, that shift supports stronger spending on specialist itineraries and reduces dependence on broad, standardized package formats. The demand pattern also makes it easier for niche operators to defend pricing when the trip offers a clear personal outcome.
Rising Disposable Income in Emerging Economies
The special interest tourism market is also benefiting from stronger household spending power in large Asian source markets. Visa Business and Economic Insights identified India as a major force in Asia-Pacific travel, with post-pandemic household disposable income growth exceeding that of China and Indian outbound travel already above pre-pandemic levels by 2023. PATA expects Asia-Pacific inbound volumes to surpass 2019 levels by 2026, signaling a broader base for cross-border cultural, culinary, and wellness trips. Domestic travel remains the entry point for many new travelers, but rising incomes make international niche travel easier to afford over time. This supports the special-interest tourism market, as first-time outbound travelers seek trips with a more defined purpose and a stronger sense of value. The strongest benefit is likely to remain in categories where experience quality matters more than trip length alone.
Government Incentives for Niche-Tourism Corridors
The special interest tourism market is gaining support from destination policies that direct visitors toward protected heritage, wellness, and nature-based corridors. UNESCO’s World Heritage and Sustainable Tourism Program shows how public heritage management is increasingly closely linked to visitor planning, conservation, and local tourism benefits. The GSTC Hotel Standard v4.0, released in 2025, added stronger biodiversity protection and climate resilience requirements, providing destinations and operators with clearer benchmarks for premium and regenerative tourism offers. These frameworks help public bodies shape niche tourism supply with better quality control and more durable local positioning. In the special interest tourism market, policy-backed corridor development also helps newer destinations compete with mature European and North American hubs. That matters because niche demand grows faster when the destination promise is supported by visible standards and coordinated local delivery.
Creator-Economy Micro-Communities Amplifying Niche Demand
The special-interest tourism market is also being shaped by micro-communities built around food, wellness, wildlife, heritage, and adventure. These communities often shorten the path from inspiration to booking by letting travelers start with a clear theme rather than a broad destination search. Mastercard’s 2025 travel research showed unusually strong consumer interest in spending on experiences, aligning with more targeted trip-planning behavior. PATA also showed that travelers across Asia-Pacific now treat experiences as a planned part of their travel budget rather than an incidental add-on. PATA: That demand pattern favors operators with distinctive local access, clear storytelling, and repeatable thematic formats across the special-interest tourism market. It also pushes more attention toward smaller destinations that can offer a focused product without competing on scale.
Restraints Impact Analysis of Special Interest Tourism Market*
| Restraint | (~) % Impact on CAGR Forecast | Geographic Relevance | Impact Timeline |
|---|---|---|---|
| Safety And Security Concerns in Adventure Destinations | -1.2% | South Asia, India, Nepal, South America, and parts of Africa | Short term (≤ 2 years) |
| High Cost of Specialized Packages and Gear | -0.9% | Global, with stronger pressure on price-sensitive emerging markets | Medium term (2-4 years) |
| Overtourism Permits Capping Visitor Numbers at Fragile Sites | -0.6% | Europe, Asia-Pacific, South America | Short term (≤ 2 years) |
| Climate-Driven Insurance Premium Spikes for High-Risk Trips | -0.5% | Global, with the highest exposure in Oceania, South Asia, and Alpine Europe | Long term (≥ 4 years) |
| Source: Mordor Intelligence | |||
Safety and Security Concerns in Adventure Destinations
Safety concerns remain a significant limitation on the special-interest tourism market, especially in high-risk adventure corridors. The US Department of State says medical evacuations from remote destinations can cost more than USD 100,000, while many international hospitals do not accept US health insurance. Cost and uncertainty can discourage first-time adventure travelers and weaken booking conversion even when destination demand is otherwise healthy. Safety management standards, trained guides, and insurance clarity matter more in remote trips because a single incident can damage confidence across a wider destination cluster. In the special-interest tourism market, operators with stronger risk controls are better positioned to protect repeat demand. This becomes even more important where adventure travel is still building trust among new customer groups.
High Cost of Specialized Packages and Gear
High package costs and equipment requirements still limit access to the special-interest tourism market, especially for younger travelers entering premium adventure and expedition categories. Operators have already started responding to this pressure, and Intrepid Travel stated in April 2026 that it would absorb fuel and currency volatility rather than add surcharges on 2026 bookings. That move shows how visible pricing has become in traveler decision-making across experience-led trips. Cost barriers are usually lower in cultural and wellness formats than in gear-heavy adventure travel, which creates uneven growth across niche categories. In the special-interest tourism market, companies that simplify pricing and reduce up-front participation costs should attract a wider customer base. The pressure is most visible in products where transport, specialist staff, and personal gear all sit in the same booking decision.
*Our forecasts treat driver/restraint impacts as directional, not additive. The impact forecasts reflect baseline growth, mix effects, and variable interactions.
Special Interest Tourism Market Segment Analysis
By Tourism Type:
Heritage Leads the Base While Wellness Delivers the Fastest UpsideCultural and heritage tourism accounted for 28.6% of the special-interest tourism market share in 2025, making it the largest tourism type. Research presented at the 2025 CEE Conference found that each additional UNESCO World Heritage Site is associated with 2.03 million more international tourist arrivals, which helps explain the segment’s structural scale. The special interest tourism market continues to benefit from the commercial pull of monuments, historic districts, museums, and place-based storytelling. Culinary and wine tourism are also broadening demand, and the UN World Tourism Organization reported that wine tourism accounted for 25% of total winery revenue globally. Together, these categories give operators year-round thematic programming and a strong fit with shorter trip formats.
Wellness and medical tourism is the fastest-growing tourism type, with a projected 12.9% CAGR from 2026 to 2031. The Global Wellness Institute said wellness tourism reached USD 785.6 billion in 2024 and is projected to rise to USD 893.9 billion in 2025, supporting the premium growth outlook in the special-interest tourism market. That momentum reflects stronger health awareness, older affluent travelers, and the continued development of treatment and recovery hubs across Asia and other cost-competitive destinations. Eco and nature tourism is also benefiting from stronger interest in lower-impact stays and nature-led itineraries, while GSTC standards are providing operators with clearer sustainability benchmarks. Across the special-interest tourism industry, the strongest tourism types now combine a clear purpose, recognizable local assets, and sufficient quality differentiation to support premium pricing.

By Tourist Type:
Domestic Demand Holds the Volume While International Travel Reopens the Growth CurveDomestic tourists accounted for 62.4% of the special-interest tourism market in 2025, providing the category with a stable volume base. That position reflects the appeal of closer-to-home niche trips that require lower budgets, shorter planning cycles, and less travel friction. The special-interest tourism market also benefits from domestic demand, as it helps operators maintain occupancy and trip frequency during periods of international volatility. This is especially relevant for cultural circuits, wellness retreats, and culinary travel, where repeat visitation and local familiarity can still support premium spend. The domestic base also provides newer operators with a lower-risk route to build brand recognition before expanding abroad.
International tourists are forecast to grow at a 10.2% CAGR from 2026 to 2031, making them the fastest-growing segment of the special-interest tourism market. UNWTO reported 1.52 billion international tourist arrivals in 2025, up 4% from 2024, confirming continued strength in cross-border demand. Visa also identified India as a strong outbound travel driver in Asia-Pacific, with household disposable income growth remaining elevated after the pandemic and outbound travel already above pre-pandemic levels by 2023. Trip.com found strong interest in food-led travel content, immersive stays, and destination activities across major Asia-Pacific markets, which supports future international demand for focused travel themes. This leaves the special interest tourism market well placed to capture a larger share of higher-value cross-border travel over the forecast period.
By Traveler Type:
Individual Travel Holds the Lead While Professional Demand Builds FasterIndividual travelers accounted for 38.2% of the special-interest tourism market in 2025, making them the largest traveler type. Their lead reflects the close fit between niche travel and self-directed planning across culture, wellness, culinary, and soft-adventure products. Digital discovery has made it easier for solo travelers to compare specialist itineraries, local operators, and trip themes before they commit. In the special interest tourism market, this supports formats where flexibility and personal choice matter more than standardized group design. Couples and small private groups remain important because shared trip costs make higher-value itineraries more affordable.
Professional travelers are projected to grow at an 11.7% CAGR through 2031, the fastest pace among traveler types in the special-interest tourism market. This reflects the closer link between meetings, incentive travel, and curated experiences such as wellness retreats, culinary workshops, and local cultural programming. The segment also benefits when corporate buyers prefer smaller, more distinctive formats instead of generic conference extensions. Within the special-interest tourism industry, this favors operators that can package logistics, compliance, and differentiated local access into a single offer. Group travelers remain commercially important as well because high-unit-cost expedition and safari products often need pooled travel arrangements to scale effectively.
By Booking Channel:
Direct Platforms Lead While Distribution Pressure Keeps RisingDirect booking accounted for 40.1% of the special-interest tourism market in 2025, making it the largest booking channel. This position reflects how niche operators use their own websites and apps to explain specialized itineraries, set expectations, and protect margin. UNWTO’s 2025 wine tourism report noted that direct booking remains the dominant mode in winery tourism because trust, personal contact, and brand loyalty still shape purchase decisions. In the special-interest tourism market, direct channels also help smaller operators collect first-party customer data and boost repeat sales. This is particularly important in premium categories, where customer education and trip customization affect conversion rates.
OTA pressure is still rising, even though direct booking leads the special-interest tourism market. Operators are responding by investing in digital content, payments, and loyalty tools to reduce their dependence on intermediary commissions. TUI Group’s 2025 annual report shows how large travel companies are scaling curated experiences platforms, which increases competitive pressure on smaller specialists. The result is a split-booking environment in which discovery-led online platforms, relationship-led specialty providers, and corporate booking channels each serve different traveler needs. That mix is likely to remain in place because niche travel products often require both inspiration-driven discovery and high-trust final purchase behavior.
Geography Analysis
Europe Special Interest Tourism Market
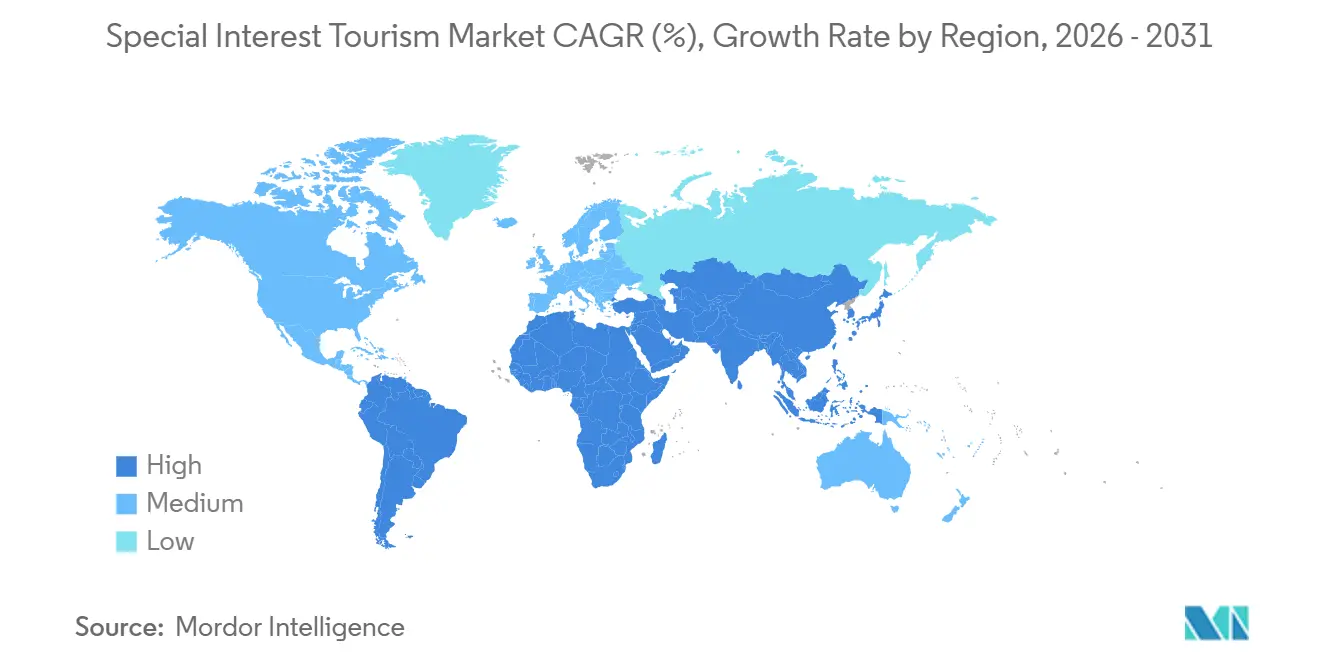
Europe held 33.1% of the special-interest tourism market share in 2025, giving it the largest regional share. UN Tourism reported 793 million international tourist arrivals in Europe in 2025, up 4% from 2024 and 6% above 2019 levels. That scale supports dense networks of heritage, culinary, and wellness operators across Italy, France, Spain, and Germany. UNWTO also reported that wine tourism accounts for 25% of winery revenue globally, and European wine regions remain central to that commercial model. Europe’s growth outlook is steadier than that of faster-rising regions because market maturity and overtourism controls limit expansion in some marquee destinations.
APAC Special Interest Tourism Market
Asia-Pacific is the fastest-growing region in the special interest tourism market, and its share of the market is projected to grow at a 12.4% CAGR through 2031. WTTC said Asia-Pacific travel and tourism GDP grew 8.1% in 2025 to USD 3.29 trillion, which was the strongest regional pace among major markets. PATA expects the region to surpass 2019 visitor volumes by 2026, reinforcing the medium-term outlook for cultural, culinary, and wellness trips. Trip.com’s 2025 survey showed strong consumer interest in food-led and festival travel across Asia-Pacific, pointing to deeper demand for thematic itineraries. The region also benefits from the growing role of India and other emerging outbound markets in driving cross-border purpose-led travel.
The Americas and MEA Special Interest Tourism Market
North America is projected to grow at a 6.2% CAGR through 2031, South America at 7.5%, and Western Asia markets at 7.9%, while Africa recorded 8% arrival growth in 2025, with North Africa leading at 11%. In the special-interest tourism market, South America benefits from continued demand for Andean culture and heritage travel, while Peru maintains Machu Picchu’s 5,600-visitor daily cap. The Middle East is expanding its niche supply through destination development, while Africa is strengthening its appeal in wildlife, culinary, and cultural travel. These regions are still smaller than Europe and Asia-Pacific, but they offer a wider runway for new operators and less mature competitive pressures in the special-interest tourism market.
Competitive Landscape
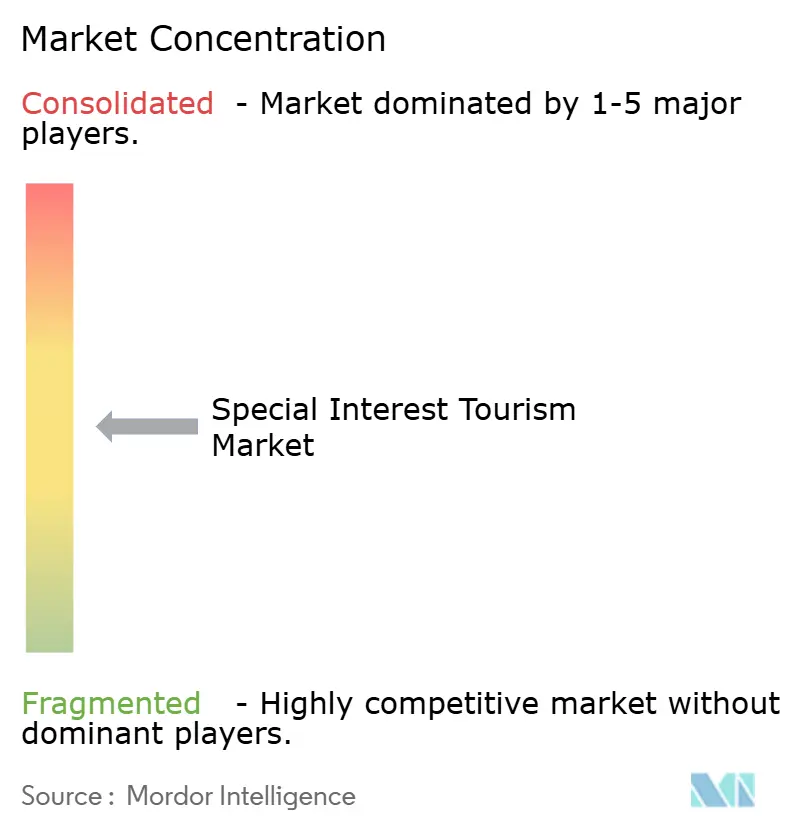
The special-interest tourism market remained moderately fragmented in 2025, with the top five operators accounting for a combined 24.9% share. TUI Group led with 7.8%, supported by its vertically integrated model and TUI Musement's scale. TUI’s 2025 annual report said TUI Musement sold 10.6 million experiences in FY2025, up 6%, demonstrating the reach that broad distribution can deliver in the special-interest tourism market. Intrepid Travel also showed that focused small-group formats can scale, reporting FY2025 revenue of USD 809.3 million, up 29% year over year, with an NPS of 83. This leaves room for both large platforms and specialist brands with strong local credibility. Brand trust, local supplier relationships, and sustainability positioning remain important differentiators for second-tier specialists.
Strategic expansion is becoming more active across the special-interest tourism market as operators buy local capability rather than build it slowly. Intrepid Travel completed the acquisition of Altaï Group in April 2026, its largest deal to date, adding more than AUD 100 million (USD 65 million) in annual revenue and expanding access to French-speaking demand. TUI Musement also signed a B2B partnership with Jet2 in April 2026 to extend its excursions and activities portfolio to a wider leisure airline customer base. These moves show that distribution scale, language reach, and product depth are now central competitive tools. They also suggest that consolidation will remain selective and focused on capability gaps rather than pure size alone.
Technology and standards are shaping the next competitive layer in the special interest tourism market. TUI is investing in stronger digital product visibility, while Intrepid used price transparency as a retention tool by committing to no additional surcharges on 2026 bookings. GSTC-linked sustainability standards are also becoming increasingly important for institutional buyers and premium travelers seeking clearer proof of operational quality. As a result, the special-interest tourism market is likely to continue rewarding operators that combine trusted branding, local partnerships, strong safety practices, and direct digital control.
Special Interest Tourism Industry Leaders
-
TUI Group
-
Intrepid Travel
-
G Adventures
-
Abercrombie & Kent
-
Exodus Travels
- *Disclaimer: Major Players sorted in no particular order
Special Interest Tourism Market Companies Covered in this Report
- TUI Group
- G Adventures
- Intrepid Travel
- Abercrombie & Kent
- Exodus Travels
- REI Adventures
- National Geographic Expeditions
- Backroads
- Butterfield & Robinson
- The Travel Corporation (TTC)
- Audley Travel
- World Expeditions
- Cox & Kings
- Quark Expeditions
- Responsible Travel
- Walk Japan
- Wilderness Travel
- Kuoni Tumlare
- Airbnb Experiences
- Viator (Tripadvisor Experiences)
Recent Industry Developments in Special Interest Tourism Market
- April 2026: Intrepid Travel completed the acquisition of French adventure travel company Altaï Group, the largest deal in its 37-year history. The transaction adds USD 65 million (AUD 100+ million) in annual revenue and 35,000 customers, making France Intrepid's fourth-largest global market and unlocking French-speaking markets, including Switzerland, Belgium, and Canada. EMEA is now Intrepid's largest outbound region, surpassing Australia and New Zealand.
- April 2026: TUI Musement signed a B2B partnership with Jet2, providing Jet2's customer base access to TUI Musement's global portfolio of excursions, activities, and attraction tickets. The partnership expands TUI's experience distribution beyond its own ecosystem into a new high-volume leisure airline customer base.
- March 2026: Intrepid Travel reported its best-ever financial performance in FY2025, with bookings of USD 873.3 million, up 26% year over year, revenue of USD 809.3 million, up 29%, underlying EBITDA of USD 53.9 million, up 26%, and a Net Promoter Score of 83.
- November 2025: TUI Group reported record FY2025 results, with revenue of EUR 24.2 billion (USD 28.44 billion) and underlying EBIT at constant exchange rates of EUR 1.5 billion (USD 1.76 billion), the highest in company history. TUI Musement sold 10.6 million experiences globally, up 6%, and sold 2.3 million experiences in Q1 FY2026, reflecting continued demand for curated travel experiences.
Global Special Interest Tourism Market Report Scope
Segmentation Overview
| Cultural & Heritage Tourism |
| Eco & Nature Tourism |
| Wellness & Medical Tourism |
| Culinary & Wine Tourism |
| Other Tourism Types |
| Domestic |
| International |
| Individual |
| Couple |
| Professional |
| Group |
| Direct Booking |
| Online Travel Agencies (OTAs) |
| Tour Operators & Travel Agencies |
| Specialty Travel Providers |
| Corporate / Institutional Booking |
| North America | United States |
| Canada | |
| Mexico | |
| South America | Brazil |
| Peru | |
| Chile | |
| Argentina | |
| Rest of South America | |
| Europe | United Kingdom |
| Germany | |
| France | |
| Spain | |
| Italy | |
| BENELUX (Belgium, Netherlands, Luxembourg) | |
| NORDICS (Denmark, Finland, Iceland, Norway, Sweden) | |
| Rest of Europe | |
| Asia-Pacific | India |
| China | |
| Japan | |
| Australia | |
| South Korea | |
| South-East Asia | |
| Rest of Asia-Pacific | |
| Middle East & Africa | United Arab Emirates |
| Saudi Arabia | |
| South Africa | |
| Nigeria | |
| Rest of Middle East & Africa |
| By Tourism Type (Value) | Cultural & Heritage Tourism | |
| Eco & Nature Tourism | ||
| Wellness & Medical Tourism | ||
| Culinary & Wine Tourism | ||
| Other Tourism Types | ||
| By Tourist Type (Value) | Domestic | |
| International | ||
| By Traveler Type (Value) | Individual | |
| Couple | ||
| Professional | ||
| Group | ||
| By Booking Channel | Direct Booking | |
| Online Travel Agencies (OTAs) | ||
| Tour Operators & Travel Agencies | ||
| Specialty Travel Providers | ||
| Corporate / Institutional Booking | ||
| By Geography (Value) | North America | United States |
| Canada | ||
| Mexico | ||
| South America | Brazil | |
| Peru | ||
| Chile | ||
| Argentina | ||
| Rest of South America | ||
| Europe | United Kingdom | |
| Germany | ||
| France | ||
| Spain | ||
| Italy | ||
| BENELUX (Belgium, Netherlands, Luxembourg) | ||
| NORDICS (Denmark, Finland, Iceland, Norway, Sweden) | ||
| Rest of Europe | ||
| Asia-Pacific | India | |
| China | ||
| Japan | ||
| Australia | ||
| South Korea | ||
| South-East Asia | ||
| Rest of Asia-Pacific | ||
| Middle East & Africa | United Arab Emirates | |
| Saudi Arabia | ||
| South Africa | ||
| Nigeria | ||
| Rest of Middle East & Africa | ||
Key Questions Answered in the Report
What is the current size of the special interest tourism space?
The special-interest tourism market size stood at USD 1.63 trillion in 2026 and is projected to reach USD 2.57 trillion by 2031, at a 9.53% CAGR.
Which tourism type leads the special interest tourism market?
Cultural and heritage tourism led with 28.6% share in 2025, supported by the commercial pull of recognized heritage assets and destination storytelling.
Which tourism type is growing the fastest through 2031?
Wellness and medical tourism are forecast to grow at a 12.9% CAGR, supported by expanding health, recovery, and self-care travel demand.
Why is the Asia-Pacific important for future growth?
Asia-Pacific is forecast to grow at a 12.4% CAGR, helped by 8.1% travel GDP growth in 2025 and a stronger outbound traveler base across major source markets.
What is the biggest constraint on premium niche travel?
Safety risk in remote adventure corridors and the high cost of specialized packages remain the most visible constraints, especially for first-time and price-sensitive travelers.
Which companies are shaping competitive activity in 2026?
TUI Group and Intrepid Travel remain the clearest examples, with TUI expanding distribution through Jet2 and Intrepid adding Altaï Group while holding pricing steady on 2026 bookings.