South America Plastic Bottles And Containers Market Size and Share
Market Overview
| Study Period | 2019 - 2030 |
|---|---|
| Forecast Data Period | 2025 - 2030 |
| Historical Data Period | 2019 - 2023 |
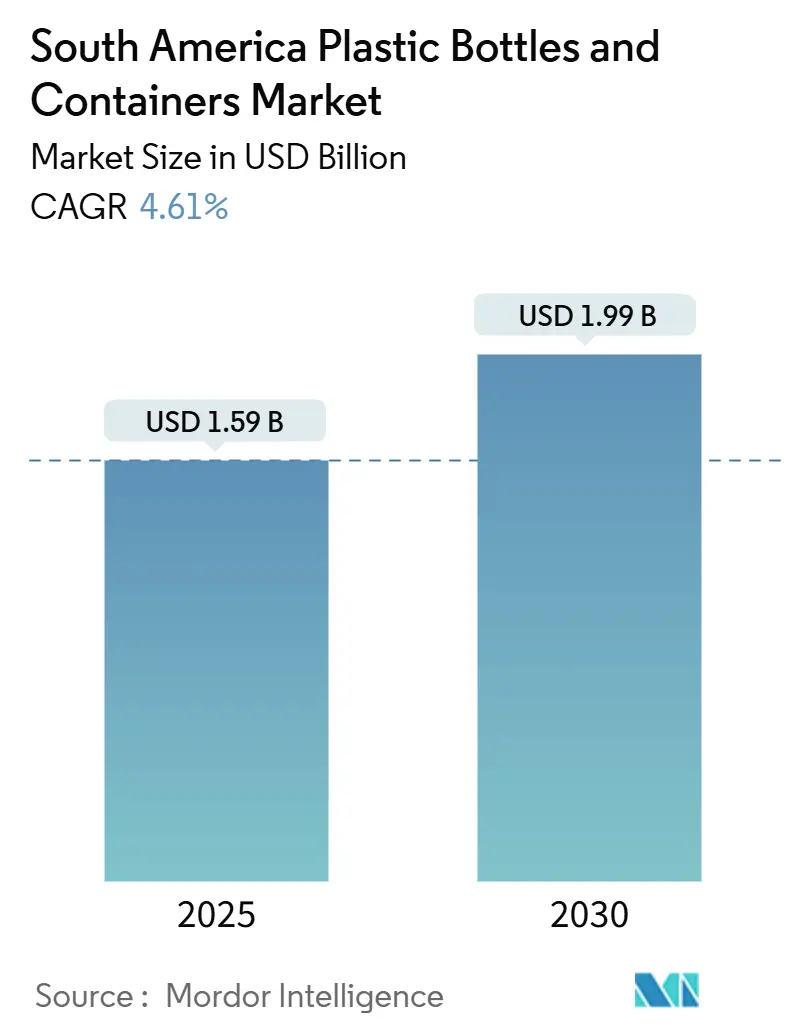
| Market Size (2025) | USD 1.59 Billion |
| Market Size (2030) | USD 1.99 Billion |
| Growth Rate (2025 - 2030) | 4.61% CAGR |
| Market Concentration | Low |
Major Players *Disclaimer: Major Players sorted in no particular order Image © Mordor Intelligence. Reuse requires attribution under CC BY 4.0. | |
South America Plastic Bottles And Containers Market Analysis by Mordor Intelligence
The South America plastic bottles and containers market size stands at USD 1.59 billion in 2025 and is projected to reach USD 1.99 billion by 2030, reflecting a 4.61% CAGR. Steady beverage consumption, expansion of cold-chain logistics, and the rapid scale-up of e-commerce create sustained volume growth, while recycled-content mandates in Chile and Colombia realign procurement strategies toward food-grade rPET. Brand owners are responding with long-term offtake contracts that secure feedstock but drive up working-capital needs, prompting converters to invest in vertically integrated recycling lines. Technology upgrades, such as compression molding, that reduce energy demand are mitigating electricity tariff volatility. Competitive positioning hinges on localized collection networks, as Brazil’s January 2025 ban on plastic-waste imports tightened bale availability and raised the strategic value of captive sourcing.
Key Report Takeaways
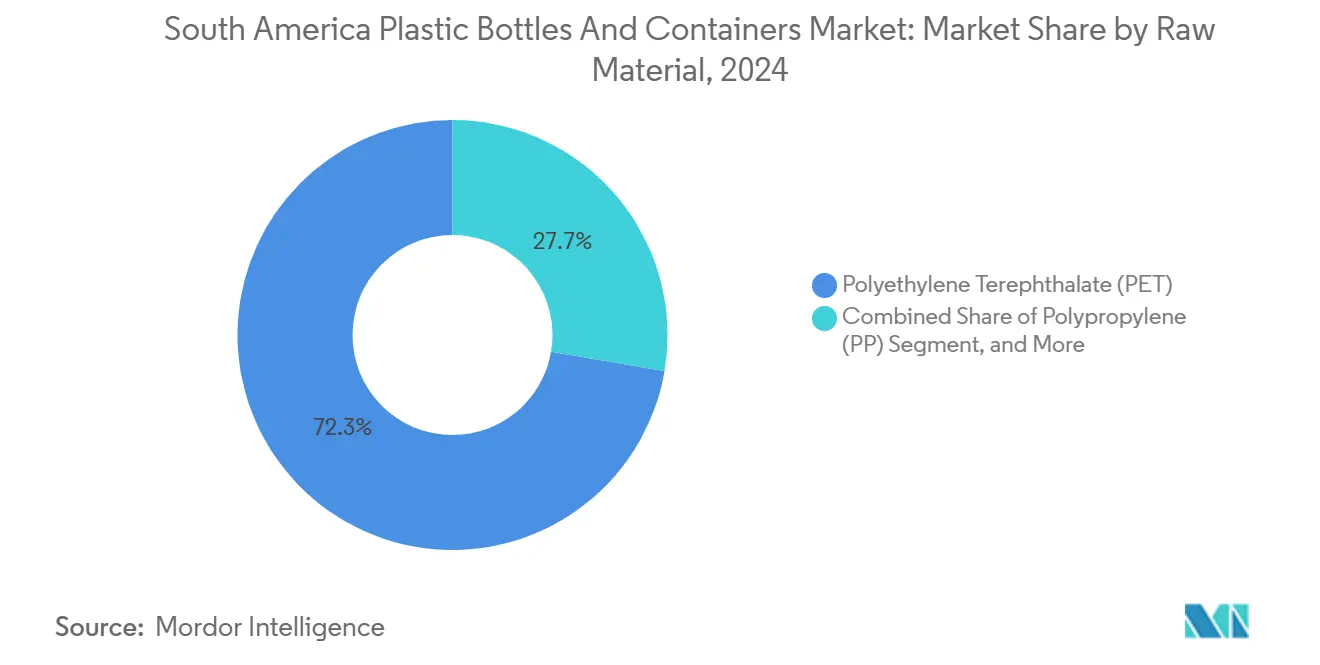
- By raw material, polyethylene terephthalate led the South America plastic bottles and containers market with 72.32% of the market share in 2024, while polypropylene recorded the highest projected CAGR of 5.53% through 2030.
- By end-use industry, beverages accounted for 42.54% revenue in 2024, whereas cosmetics and personal care are set to expand at a 6.42% CAGR to 2030.
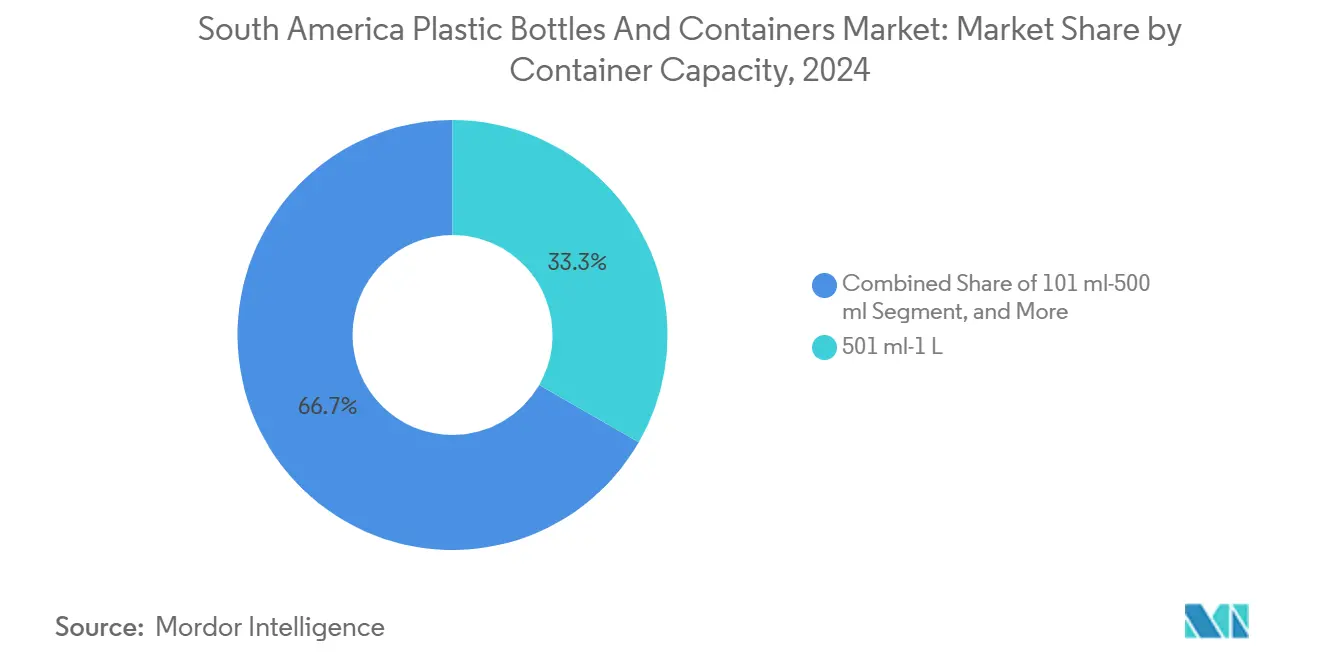
- By container capacity, the 501-milliliter-to-1-liter band held 33.32% of the South America plastic bottles and containers market size in 2024, while the 101-to-500-milliliter segment posts the fastest 5.73% CAGR through 2030.
- By 2024, injection stretch blow molding represented 58.32% of output, and compression molding is expected to advance at a 6.22% CAGR to 2030.
- By geography, Brazil commanded 58.3% of volume in 2024, but Peru is growing the quickest with an 8.21% CAGR through 2030.
South America Plastic Bottles And Containers Market Trends and Insights
Drivers Impact Analysis*
| Driver | (~) % Impact on CAGR Forecast | Geographic Relevance | Impact Timeline |
|---|---|---|---|
| Rising demand for sustainable and innovative food packaging products | +1.2% | Brazil, Chile, Colombia, Peru, Argentina | Medium term (2-4 years) |
| Increasing adoption of lightweight packaging methods | +0.9% | Global, focused in Brazil and Chile urban centers | Short term (≤ 2 years) |
| Growth of e-commerce ready primary packaging | +0.8% | Brazil, Argentina, Chile, Peru corridors | Short term (≤ 2 years) |
| Tax incentives for rPET conversion plants | +0.6% | Chile, Colombia, Peru, Ecuador | Medium term (2-4 years) |
| Expansion of cold-chain logistics for fresh produce | +0.5% | Brazil, Chile, Peru | Long term (≥ 4 years) |
| Nutraceutical start-ups using PET shot bottles | +0.4% | Peru, Chile, Brazil, Colombia | Medium term (2-4 years) |
| Source: Mordor Intelligence | |||
Rising Demand for Sustainable and Innovative Food Packaging Products
Brand owners are now embedding circularity at the design stage, as illustrated by Coca-Cola Femsa’s USD 135 million Porto Alegre line, which utilizes 30% post-consumer resin while maintaining carbonation barriers. Demand accelerates as Chile lifts its mandated recycled content from 15% in 2025 to 70% by 2030 and Colombia targets 90% by the same year. [1]Coca-Cola Company, “Investment in Porto Alegre Plant,” coca-cola.comConverters without captive recycling incur a 20–25% cost premium for merchant rPET, making vertical integration a margin safeguard. Carvajal Empaques’ regional network demonstrates that back-integration also stabilizes bale quality, reducing food-contact rejections by double digits. Cross-market policy convergence across MERCOSUR and the Andean Community points to uniform thresholds by 2027, providing visibility that underpins multi-year capex decisions.
Increasing Adoption of Lightweight Packaging Methods
Freight and resin account for nearly half of landed bottle cost in fragmented South American transport systems. Injection stretch blow molding trims wall thickness up to 20%, saving 3–5 g per 500 ml bottle and cutting distribution weight by up to 18% on long-haul routes from São Paulo to Manaus. [2]Gerresheimer AG, “Anápolis Brazil Facility,” gerresheimer.comProcurement tenders now stipulate maximum gram-per-container limits, making lightweight capability a qualification criterion. Plants embracing ISO 9001:2015 and ISO 15378 demonstrate the process control needed for thinner walls, mitigating breakage claims that once constrained light parts. As fuel prices remain volatile, sustainability and direct logistics savings reinforce each other, locking in future demand for downgauged containers.
Growth of E-Commerce Ready Primary Packaging
E-commerce reached 12% of Brazilian retail in 2024, propelling demand for 101-to-500 ml PET formats that fit parcel-weight brackets and maximize van cube utilization. Direct-to-consumer cosmetics and nutraceuticals prefer single-use bottles that remove the need for corrugated overpacks, improving fulfillment efficiency. Rapid SKU rotation, often 25 per year per brand forces molders to adopt quick-change systems that cut downtime from weeks to days. As reverse-logistics loops mature, rPET recovery improves, creating a reinforcing cycle in which e-commerce both consumes and supplies feedstock. Converters that can meet four-week lead times gain share over legacy suppliers locked into quarterly schedules.
Tax Incentives for rPET Conversion Plants
Fiscal tools are tilting project economics in favor of recycling. Chile’s Re-Ciclar plant, financed with USD 35 million, doubled local bale demand and generated hundreds of jobs. [3]Government of Chile, “Re-Ciclar Plant Announcement,” gob.cl Colombia’s plastics tax adds a 5–8% cost to virgin-only containers, making rPET competitive even during dips in virgin prices. Multilateral lenders such as the International Finance Corporation supply concessional debt, enabling integrated players to underprice merchant recyclers by up to 12%. Countries that codify clear valuation standards, as Peru did in December 2024, reduce permitting risk and compress development timelines, thereby attracting private capital for expansion projects.
Restraints Impact Analysis*
| Restraint | (~) % Impact on CAGR Forecast | Geographic Relevance | Impact Timeline |
|---|---|---|---|
| Environmental concerns regarding use of plastics | -0.7% | Chile, Colombia, Brazil | Long term (≥ 4 years) |
| Increasing awareness about alternative forms of packaging | -0.5% | Chile, Brazil, Argentina | Medium term (2-4 years) |
| Volatility in virgin resin feedstock prices | -0.6% | Brazil, Argentina | Short term (≤ 2 years) |
| Limited supply of food-grade recycled PET flakes | -0.4% | Brazil, Peru, Colombia | Medium term (2-4 years) |
| Source: Mordor Intelligence | |||
Environmental Concerns Regarding Use of Plastics
Regulatory ambition is rising faster than collection networks. Brazil’s January 2025 import ban removed the historical feedstock safety valve, leaving recyclers short by nearly one-quarter of required bales. Chile recycled only 7.8% of consumed plastics in 2022, yet must hit a 70% bottle threshold by 2030, foreshadowing supply squeezes and price spikes. Brands hedge by trialing fiber-based or aluminum packs for low-barrier beverages, eroding volumes that rigid PET once captured unchallenged. Extended producer responsibility adds traceability costs that small converters cannot absorb, increasing the likelihood of consolidation or market exit.
Volatility in Virgin Resin Feedstock Prices
Spot polyethylene in China fell almost 19% in 2024; polypropylene dropped 5%. Such swings compress recycler margins because rPET contracts lag virgin price movements, prompting buyers to postpone recycled purchases when spreads widen. Brazilian recyclers operated at 77% utilization, despite earlier capacity tripling, underscoring how price fluctuations translate into idle assets. Converters are increasingly inserting monthly resin index clauses, which transfer risk to brand owners with limited hedging tools. Without flexible pricing, suppliers risk 200-basis-point margin erosion per quarter during sharp downturns.
*Our forecasts treat driver/restraint impacts as directional, not additive. The impact forecasts reflect baseline growth, mix effects, and variable interactions.
Segment Analysis
By Raw Material: PET Dominance Reinforced by Recycling Mandates
Polyethylene terephthalate held 72.32% of regional volume in 2024, and its 5.53% forecast CAGR keeps it at the core of the South America plastic bottles and containers market. Colombia’s Resolution 803 and Chile’s escalating thresholds guarantee stable demand for food-grade rPET in beverage chains that require optical clarity and gas barriers. The South America plastic bottles and containers market size for PET applications alone is expected to breach USD 1.45 billion by 2030, underpinned by multiyear offtake deals that lock pricing at premiums to virgin resin. Polypropylene and high-density polyethylene remain essential in household care and pharmaceuticals, yet each lacks the post-consumer collection scale needed for lower-carbon claims, suppressing their growth to low-single-digit rates.
Investment dynamics favor vertically integrated players. Indorama Ventures tripled Juiz de Fora recycling capacity to 25,000 tpy under an IFC Blue Loan. ALPLA’s January 2025 HDPE-recycler acquisition signals polyethylene’s inclusion in closed-loop models. These moves sharpen cost differentials; integrated producers expect a 15–20% conversion advantage by 2027. For late movers, reliance on merchant rPET markets exposes operations to feedstock gaps when recycled-content mandates tighten, threatening fulfillment rates for multinational beverage clients that have zero-shortage clauses.


By End-Use Industry: Cosmetics Outpacing Beverages on Premiumization
Beverages held 42.54% of 2024 demand, giving the category the largest South America plastic bottles and containers market share. Growth moderates to 4.8%, however, as soy drinks and juices shift to carton packs. Cosmetics and personal care, expanding at 6.42% annually, benefit from lightweight PET jars that cut freight cost up to one-fifth compared with glass while supporting creative decorations. The South America plastic bottles and containers market size for beauty applications could approach USD 340 million by 2030, aided by e-commerce’s appetite for visually differentiated packaging.
Urban middle-class consumers in Lima and Santiago are embracing premium skincare routines, encouraging local brands to launch over 20 new SKUs per year. This SKU churn rewards converters equipped with multi-cavity molds and quick-change tools. Pharmaceutical containers are projected to post a 5.6% CAGR as serialization rules mandate tamper-evident formats, driving the adoption of PET vials that outperform glass in drop tests. Household care grows at 5.9% in part because detergent makers specify 100% rPET bottles to align with retailer scorecards. Converters unable to guarantee recycled content at scale risk delisting during annual supplier reviews.
By Container Capacity: Small Formats Gain on E-Commerce Tailwinds
Returnable 501 ml to 1 liter bottles dominated the market with a 33.32% share in 2024, reflecting traditional soda channels in Brazil and Argentina. Yet the 101-to-500 ml band posts the fastest 5.73% CAGR, propelled by single-serve nutraceutical shots and travel-size cosmetics. The South America plastic bottles and containers market size for these small formats could exceed USD 480 million by 2030, driven by warehouse automation systems that prefer standard parcel dimensions. Demand for containers exceeding 3 liters remains muted, growing at a 3.2% CAGR, as industrial chemical users shift to intermediate bulk containers.
Production economics differ sharply. High-volume refillable lines deliver thin margins but steady cash flow, while low-volume shot-bottle lines command 30% higher contribution yet require frequent tool changes. Well-capitalized converters run both, balancing utilization and margin mix. Amcor’s USD 785 million Latin America rigid packaging franchise achieves this balance through its April 2025 acquisition of Berry Global’s regional assets.
By Manufacturing Technology: Compression Molding Gains on Energy Efficiency
Injection stretch blow molding produced 58.32% of bottles in 2024, owing to its 40,000-unit-per-hour productivity. However, energy tariffs climbing 12-18% make compression molding more attractive for short-run orders. The latter technology grows at a rate of 6.22% annually, benefiting from a 25–38% lower electricity draw and the absence of hot-runner downtime. The South America plastic bottles and containers market share for compression-molded parts is forecast to reach 19% by 2030, driven by pharmaceutical and cosmetic orders that require precise neck finishes.
Extrusion blow molding remains important for HDPE jugs and handled containers, yet its 4.3% CAGR lags behind the market as lightweighting pressures intensify. Injection blow molding remains viable in sub-100 ml medical vials, experiencing 3.9% growth as compression molding alternatives mature. Converter investment cycles now prioritize hybrid plants that can toggle between technologies to match order profiles, lowering stranded-asset risk as customer mixes shift.
Geography Analysis
Brazil contributes 58.3% of shipments and acts as the price-setting hub for resin and bale markets. São Paulo and Rio de Janeiro alone consume 45% of the country’s beverages, concentrating blow-molding assets near densely populated areas. Coca-Cola’s USD 135 million Porto Alegre line and the broader USD 1.46 billion recycling commitment through 2030 demonstrate how international brand owners view Brazil as a key anchor for circular economy strategies. The January 2025 import ban on waste poses a challenge to feedstock supply, prompting converters to co-fund municipal collection systems and trial deposit-return automation in supermarkets.
Peru grows the fastest at 8.21% as Lima’s nutraceutical start-ups adopt PET shots sized under 120 ml. Law 32212 clarifies valorization rules, enabling private equity to back washing-line expansions that guarantee food-contact quality. Domestic converter Carvajal Empaques leverages its local bale network to capture volume from multinationals that demand certified rPET. Chile follows with robust policy support: its Re-Ciclar plant processes 13,000 tpy of post-consumer PET and escalates recycled-content targets to 70% by 2030, securing predictable offtake for integrated players.
Argentina experiences supply-demand imbalance, with oversupply of virgin PET pressing prices downward and depressing recycler utilization. This forces converters to renegotiate offtake contracts on six-month terms, shifting inventory risk upstream. The rest of South America, including Colombia, Ecuador and Uruguay, expands 5.4% as extended producer responsibility schemes spread, each mandating minimum recycled content and tax disincentives on virgin-only bottles. Regional harmonization of standards is set to lower compliance complexity, aiding cross-border supply contracts.
Competitive Landscape
Market concentration is moderate, with the top players including ALPLA, Amcor, Plastipak, Indorama Ventures, and Gerresheimer. Each pursues vertical integration to secure feedstock, evidenced by ALPLA’s January 2025 HDPE recycler transaction and Indorama’s IFC-backed rPET expansions. The South America plastic bottles and containers market favors players that align recycling capacity with downstream blow-molding lines, producing cost advantages of up to 20% by 2027.
Amcor reinforced scale via its April 2025 acquisition of Berry Global’s Latin America rigid-packaging assets, lifting regional revenue to USD 785 million and adding personal-care exposure. Plastipak invests in compression-molding systems targeting the pharmaceutical industry, carving out higher-margin niches. Regional independents such as Valgroup and Logoplaste compete through proximity and short lead times, often supplying mid-tier beverage fillers in secondary cities. Emerging disruptors include Peruvian nutraceutical brands that bypass traditional converters by sourcing tooling from China and contracting with flexible manufacturers, thereby compressing their time-to-market to six weeks and applying price pressure on incumbents.
Technology divergence intensifies rivalry. High-speed injection stretch blow lines maintain grip on carbonated soft drinks, but compression molding’s 25–38% energy savings erode their economic edge for short runs. Quality certifications serve as barriers, as Gerresheimer’s ISO and FDA registrations attract regulated pharmaceutical clients seeking validated processes. Suppliers unable to offer recycled-content guarantees, food-contact compliance and rapid tooling changeovers face displacement when brand contracts renew.
South America Plastic Bottles And Containers Industry Leaders
Amcor plc
Gerresheimer AG
ALPLA Werke Alwin Lehner GmbH & Co KG
Graham Packaging Company, L.P.
Alpha Packaging Holdings, Inc.
- *Disclaimer: Major Players sorted in no particular order

Recent Industry Developments
- April 2025: Amcor completed the acquisition of Berry Global, adding blow-molding assets and customer relationships in household care and personal care segments across Latin America and expanding its regional rigid-packaging sales to USD 785 million in fiscal 2025.
- January 2025: ALPLA acquired a majority stake in a Brazilian HDPE recycler, forming a joint venture with the founders to boost closed-loop capacity for household care and industrial containers.
- January 2025: Brazil amended its solid waste policy to ban plastic waste imports, eliminating access to overseas bales and tightening domestic rPET supply.
- December 2024: Peru enacted Law 32212, strengthening waste-management definitions and clarifying pelletizing standards, which reduces permitting risk for new rPET plants.


South America Plastic Bottles And Containers Market Report Scope
The South America Plastic Bottles and Containers Market refers to the industry focused on the production, distribution, and utilization of plastic bottles and containers across various applications, including beverages, food, cosmetics, pharmaceuticals, and household care. This market encompasses a range of raw materials, container capacities, manufacturing technologies, and geographic regions across South America.
The South America Plastic Bottles and Containers Market Report is Segmented by Raw Material (Polyethylene Terephthalate, Polypropylene, Low-Density Polyethylene, High-Density Polyethylene, Other Raw Materials), End-Use Industry (Beverages, Food, Cosmetics and Personal Care, Pharmaceuticals, Household Care, Other End-Use Industries), Container Capacity (≤ 100 ml, 101 ml-500 ml, 501 ml-1 L, 1 L-3 L, > 3 L), Manufacturing Technology (Injection Stretch Blow Molding, Extrusion Blow Molding, Injection Blow Molding, Compression Molding), and Geography (Brazil, Argentina, Chile, Peru, Rest of South America). The Market Forecasts are Provided in Terms of Value (USD).
| Polyethylene Terephthalate (PET) |
| Polypropylene (PP) |
| Low-Density Polyethylene (LDPE) |
| High-Density Polyethylene (HDPE) |
| Other Raw Materials |
| Beverages |
| Food |
| Cosmetics and Personal Care |
| Pharmaceuticals |
| Household Care |
| Other End-Use Industries |
| Less than equal to 100 ml |
| 101 ml-500 ml |
| 501 ml-1 L |
| 1 L-3 L |
| More than 3 L |
| Injection Stretch Blow Molding |
| Extrusion Blow Molding |
| Injection Blow Molding |
| Compression Molding |
| Brazil |
| Argentina |
| Chile |
| Peru |
| Rest of South America |
| By Raw Material | Polyethylene Terephthalate (PET) |
| Polypropylene (PP) | |
| Low-Density Polyethylene (LDPE) | |
| High-Density Polyethylene (HDPE) | |
| Other Raw Materials | |
| By End-Use Industry | Beverages |
| Food | |
| Cosmetics and Personal Care | |
| Pharmaceuticals | |
| Household Care | |
| Other End-Use Industries | |
| By Container Capacity | Less than equal to 100 ml |
| 101 ml-500 ml | |
| 501 ml-1 L | |
| 1 L-3 L | |
| More than 3 L | |
| By Manufacturing Technology | Injection Stretch Blow Molding |
| Extrusion Blow Molding | |
| Injection Blow Molding | |
| Compression Molding | |
| By Country | Brazil |
| Argentina | |
| Chile | |
| Peru | |
| Rest of South America |


Key Questions Answered in the Report
What is the current value of the South America plastic bottles and containers market?
The market is valued at USD 1.59 billion in 2025 and is on track to reach USD 1.99 billion by 2030.
What CAGR is forecast for plastic bottles and containers demand in South America?
The market is projected to grow at a 4.61% CAGR between 2025 and 2030.
Which raw material holds the largest share in South American bottle production?
Polyethylene terephthalate (PET) leads with 72.32% of 2024 volume, supported by strong recycling mandates.
Which end-use segment is growing the fastest?
Cosmetics and personal care packaging is expanding at a 6.42% CAGR through 2030, outpacing beverages.
How are recycled-content regulations influencing investment?
Rising thresholds in Chile and Colombia are driving converters to vertically integrate recycling lines, lowering long-term feedstock risk and compliance cost.
Why is compression molding gaining traction?
The technology delivers up to 38% energy savings and faster tool changes, making it ideal for short-run pharmaceutical and cosmetic orders.
Page last updated on:


