South America Office Real Estate Market Size and Share
Market Overview
| Study Period | 2020 - 2031 |
|---|---|
| Forecast Data Period | 2026 - 2031 |
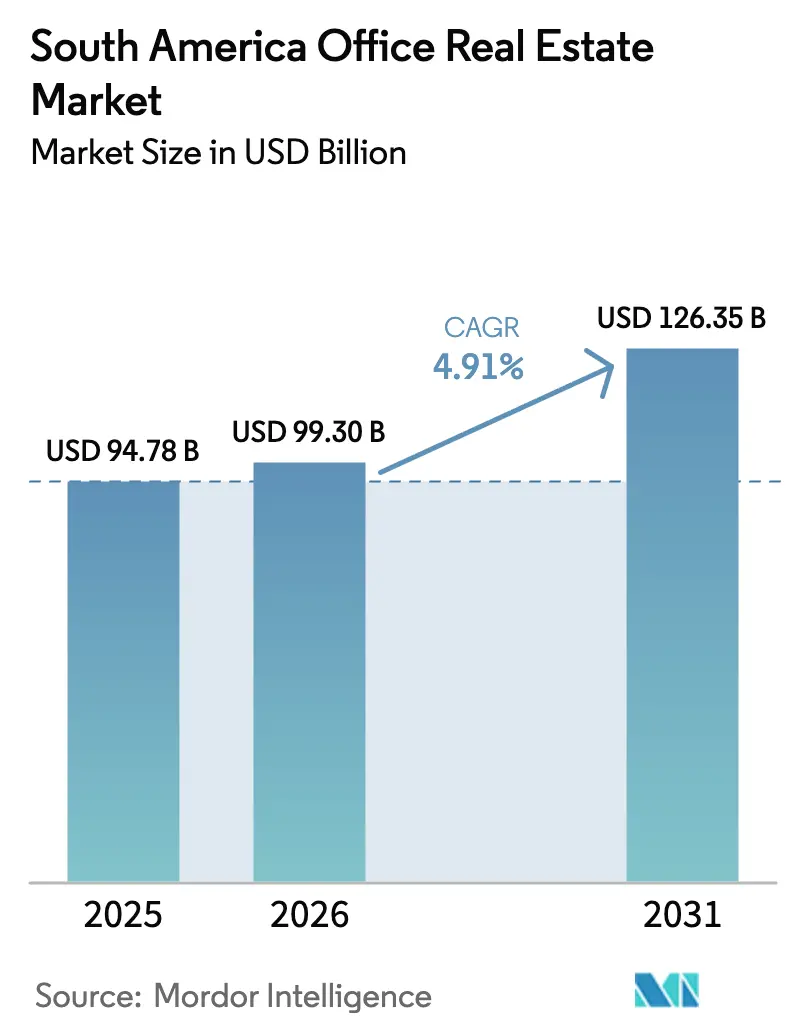
| Base Year Market Size (2025) | USD 94.78 Billion |
| Market Size (2026) | USD 99.30 Billion |
| Market Size (2031) | USD 126.35 Billion |
| Growth Rate (2026 - 2031) | 4.91% CAGR |
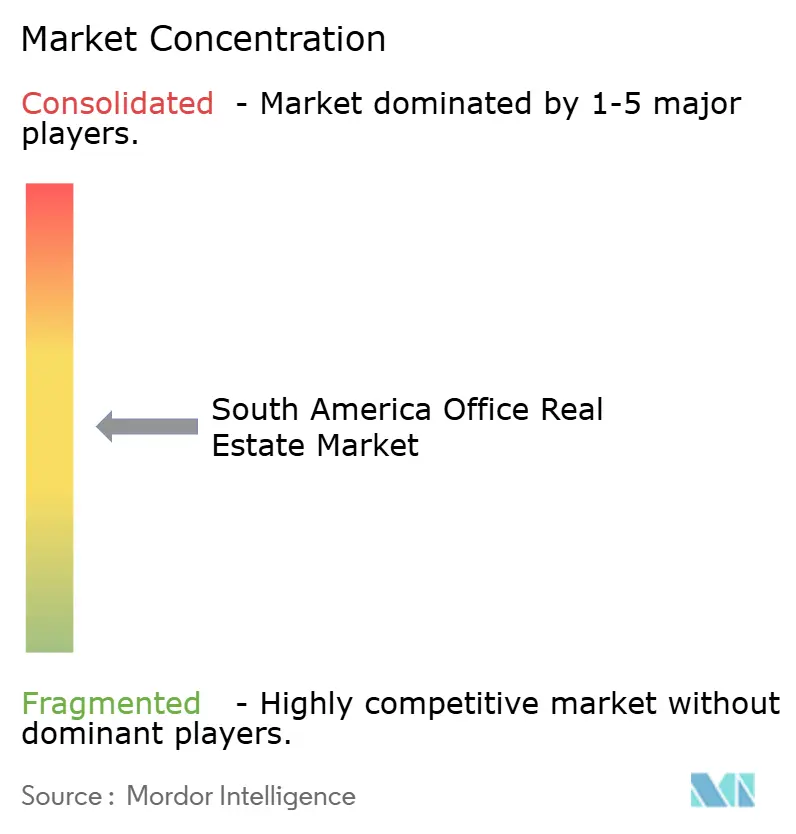
| Market Concentration | Medium |
Major Players *Disclaimer: Major Players sorted in no particular order Image © Mordor Intelligence. Reuse requires attribution under CC BY 4.0. | |
South America Office Real Estate Market Analysis by Mordor Intelligence
The South American office real estate market size was valued at USD 94.78 billion in 2025 and estimated to grow from USD 99.30 billion in 2026 to reach USD 126.35 billion by 2031, at a CAGR of 4.91% during the forecast period (2026-2031). Flight-to-quality leasing, rapid expansion of global capability centers, and record infrastructure pipelines are steering capital toward premium green offices while legacy stock struggles for relevance. Institutional investors are relying heavily on rental cash flows to hedge against inflation and currency fluctuations, reinforcing demand for income-generating assets. Prime submarkets in São Paulo, Bogotá, and Santiago continued to record single-digit vacancy in 2025, even as secondary corridors posted double-digit oversupply. Operators that embed PropTech and ESG features are already commanding 10%–15% rental premiums, a gap expected to widen as corporates chase net-zero targets.
Key Report Takeaways
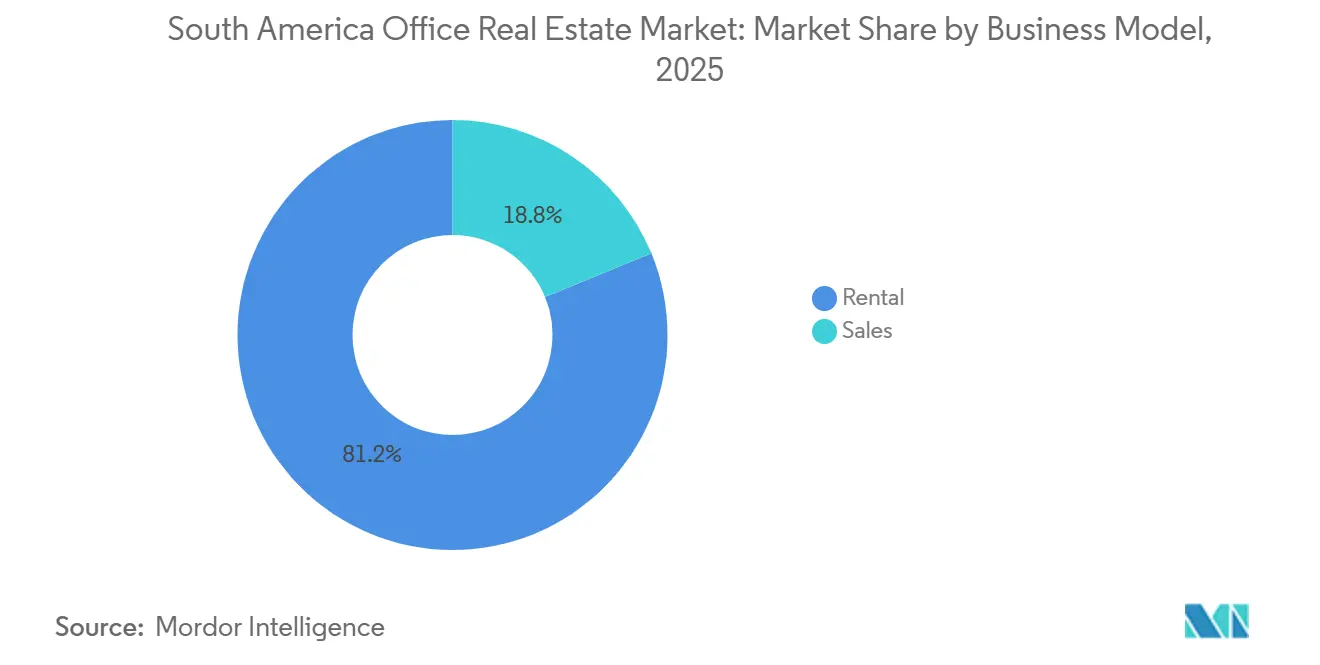
- By business model, the rental segment held 81.2% of the South America office real estate market share in 2025, while sales are projected to advance at a 4.91% CAGR through 2031.
- By building grade, Grade A stock commanded 55.2% share of the South America office real estate market size in 2025 and is forecast to grow at a 5.47% CAGR to 2031.
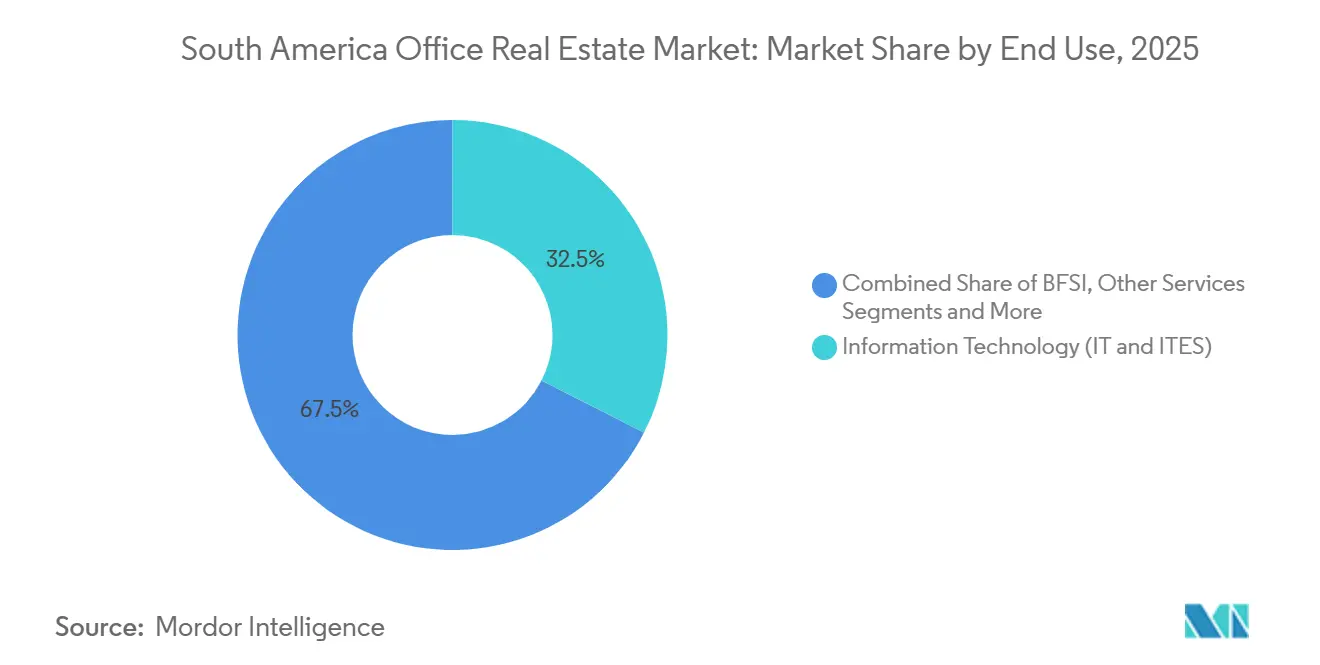
- By end use, information technology and IT-enabled services accounted for a 32.5% share of the South America office real estate market in 2025 and are expected to expand at a 5.88% CAGR through 2031.
- By geography, Brazil led with 42.8% revenue share in 2025, whereas Colombia is poised to post the fastest 6.09% CAGR through 2031.
Note: Market size and forecast figures in this report are generated using Mordor Intelligence’s proprietary estimation framework, updated with the latest available data and insights as of January 2026.
South America Office Real Estate Market Trends and Insights
Drivers Impact Analysis*
| Drivers | (~) % IMPACT ON CAGR FORECAST | Geographic Relevance | Impact Timeline |
|---|---|---|---|
| Flight-to-quality demand for ESG-certified Grade A offices | +1.2% | Brazil, Chile, Colombia, Argentina | Medium term (2–4 years) |
| Growth of global capability centers and BPO hubs | +0.9% | Colombia, Brazil, Chile | Short term (≤ 2 years) |
| Infrastructure-led CBD extensions unlocking new corridors | +0.8% | Colombia, Chile, Brazil, Peru | Long term (≥ 4 years) |
| Repositioning of outdated stock for value-add upside | +0.7% | Brazil, Argentina, Chile | Medium term (2–4 years) |
| Expansion of flex and managed office models | +0.6% | Brazil, Argentina, Chile | Short term (≤ 2 years) |
| Source: Mordor Intelligence | |||
Flight-to-quality demand for ESG-certified Grade A offices
Corporates are consolidating into fewer locations that offer green certifications, advanced HVAC systems, and wellness amenities. In 2025, vacancy stayed below 8% in São Paulo’s Faria Lima and Santiago’s Las Condes while non-certified towers in fringe CBDs exceeded 15%. BloombergNEF notes green buildings now secure 10%–15% rent premiums, but fewer than one-third of existing assets meet the benchmark, locking in an enduring supply shortfall. New issues of Latin-American green bonds surpassed USD 3.2 billion in 2024, with real estate among the top recipients. Landlords unable to retrofit quickly face income erosion as tenants link workplace quality to brand and talent retention.
Growth of global capability centers and BPO hubs
Time-zone alignment with North America and bilingual labor pools are propelling Bogotá, São Paulo, and Santiago up the global GCC league tables. Cushman & Wakefield recorded a double-digit jump in GCC lettings during 2025, led by fintech and software majors. Nubank’s USD 500 million program to add 5,700 workstations across Brazil and Colombia underscores a larger on-shoring reversal that favors collaborative space over remote models. Professional services firms are clustering in the area, reinforcing demand for prime CBD towers. This density effect attracts support vendors, turning select corridors into self-sustaining ecosystems.
Infrastructure-led CBD extensions unlocking new corridors
Mass-transit megaprojects are redrawing office maps. Bogotá’s USD 4 billion Airport City and Regiotram line will reduce travel time from 40 minutes to 18 minutes, opening northern and western nodes by 2026. Chile’s USD 1.88 billion Santiago-Melipilla rail and USD 950 million Batuco spur promise similar shifts, while São Paulo’s upcoming government-office PPP soaks up sizeable premium supply. Developers banking land near new stations can ride rental upside once ribbons are cut, but zoning delays and utility build-outs extend gestation to a decade[1]BNamericas, “Santiago Rail Infrastructure,” bnamericas.com .
Repositioning of outdated stock for value-add upside
Two-thirds of inventory predates 2010 and lacks modern energy systems, indoor-air protocols, and digital connectivity. Deep retrofits of variable refrigerant HVAC systems, IoT sensors, and façade upgrades typically shave 20%–30% off energy bills, with three-to-five-year paybacks. Brookfield’s USD 2 billion Brazil vehicle is chasing such value-add plays capable of 15%-plus rent uplifts. High policy rates, however, lift hurdle returns, so owners often secure anchor pre-leases before construction. Without capital, many B/C assets risk functional obsolescence or conversion to alternate uses.
Restraints Impact Analysis*
| Restraints | (~) % Impact on CAGR Forecast | Geographic Relevance | Impact Timeline |
|---|---|---|---|
| Hybrid work keeps vacancy elevated in secondary CBDs | -0.8% | Argentina, Brazil, Peru | Short term (≤ 2 years) |
| Macro and FX volatility lifts financing costs | -0.6% | Argentina, Brazil, Chile, Colombia | Medium term (2–4 years) |
| High capex needs for older stock to meet ESG standards | -0.5% | Brazil, Argentina, Chile | Medium term (2–4 years) |
| Source: Mordor Intelligence | |||
Hybrid work keeps vacancy elevated in secondary CBDs
Permanent hybrid policies shaved 20%–30% off headquarters footprints by 2025, leaving older towers in Buenos Aires and Lima with double-digit vacancy. A JLL poll of 500 firms shows that two-thirds now target three in-office days per week, translating into slimmer lease renewals. Landlords chasing occupancy are doling out rent-free months and fit-out allowances, diluting returns. Unless economic growth rebounds sharply, surplus space in non-prime corridors may persist to 2028.
Macro and FX volatility lifts financing costs.
Policy rates hovered at 11% in Brazil and topped 40% in Argentina during 2025, pushing levered yields below debt costs for many deals. Currency depreciation further erodes dollar returns for offshore capital, forcing players to hedge or demand wider spreads. Although large funds such as Brookfield can absorb volatility, mid-tier developers are shelving speculative projects, throttling new supply, and slowing retrofit pipelines[2]Banco Central do Brasil, “Monetary Policy Updates 2025,” bcb.gov.br .
*Our forecasts treat driver/restraint impacts as directional, not additive. The impact forecasts reflect baseline growth, mix effects, and variable interactions.
Segment Analysis
By Business Model: Rental Dominance under Persistent Currency Risk
The rental segment accounted for 81.2% of South America's office real estate market share in 2025, reflecting investor appetite for predictable cash flows amid FX swings. BR Properties booked USD 131 million in revenue for the first nine months of 2024 with 90.8% occupancy, underscoring the resilience of well-located rental portfolios. Moving forward, rental revenues are projected to grow at a 5.77% CAGR, comfortably ahead of the overall growth rate of the South American office real estate market. Institutional buyers favor triple-net leases and inflation-indexed escalations that hedge against inflation, a stance that reinforces capital rotation toward stabilized core assets.
Sales, although smaller, appeal to owner-occupiers seeking long-term cost certainty and family offices hunting inflation hedges. High interest rates have cooled transaction volumes, prompting developers to pivot toward build-to-suit deals anchored by credit tenants. The funding drought widens the liquidity premium between trophy and secondary stock, incentivizing landlords to bulk up rental pipelines rather than pursue one-off disposals.


By Building Grade: Grade A Outperforms as Tenants Pursue ESG Credentials
Grade A towers captured 55.2% of the South America office real estate market share in 2025, commanding sub-8% vacancy and 12% rental premiums over Grade B peers. Their forecast 5.47% CAGR through 2031 outruns the broader South American office real estate market size as corporates chase carbon-neutral footprints. New stock delivers LEED or EDGE plaques, touchless entry, and wellness lounges that sharpen talent branding. BloombergNEF calculates that less than 30% of existing stock meets current green thresholds, so incremental supply is likely to trail demand.
Grade B assets sit at a fork: invest USD 60 per sq m in retrofits or cede ground to shinier entrants. Some well-situated Grade B buildings in Santiago still enjoy 8% vacancy, showing price-sensitive tenants will accept moderate specs if location excels. Grade C towers, saddled with single-pane glazing and dated MEP, risk functional obsolescence unless repositioned into mixed-use or residential conversions.
By End Use: IT and ITES Cement Pole Position
Information technology and IT-enabled services accounted for 32.5% of the 2025 demand, securing the largest slice of the South American office real estate market. The segment is poised for a 5.88% CAGR driven by nearshoring mandates and digital-transformation roadmaps. Bogotá, singled out in Cushman & Wakefield’s 2025 GCC index, is luring software and fintech majors with tax perks and deep engineering pools. Nubank’s USD 500 million multicity expansion exemplifies a wider pivot back to physical hubs that foster innovation.
BFSI remains a cornerstone tenant but is rationalizing space via branch closures and cloud migration. Professional services, legal, and energy firms fill much of the balance, each influenced by economic tides. Concentration of IT tenants in prime corridors strengthens clustering effects, directing ancillary amenities and transit investments to those zones and widening the gulf between prime and peripheral markets.

Geography Analysis
Brazil owned 42.8% of the South America office real estate market share in 2025, fueled by São Paulo’s dominance in finance and technology. The state’s forthcoming USD 1.14 billion PPP to unite 22,700 civil servants into 288,000 sq m of Grade A offices will absorb a sizeable tranche of new supply while setting ESG benchmarks. Nubank’s decision to inject USD 500 million into fresh space across four Brazilian metros echoes a broader tech rebound that prioritizes collaborative offices. Yet elevated debt costs, with the Selic at 11% in 2025, temper speculative starts and nudge landlords toward phased deliveries.
Colombia is projected to register the fastest CAGR of 6.09% through 2031. Bogotá is spearheading this surge courtesy of a USD 4 billion Airport City, a 247-hectare science park, and the Regiotram line that comes online in 2026[3]Bogotá Government, “Airport City Masterplan 2026,” bogota.gov.co . Office vacancy in key northern districts slipped below 11% in late 2025 as GCCs and fintechs absorbed premium floors. Government tax credits for digital exports further sweeten the proposition for multinationals weighing nearshore hubs.
Chile, Argentina, and Peru form the region’s middle tier. Santiago sustained sub-9% vacancy in 2025, with its Las Condes precinct benefiting from the USD 2.83 billion twin-rail projects that will shrink commute times and elevate suburban land values. In Argentina, the Buenos Aires vacancy rate lingered at 16.7% as policy-rate spikes above 40% throttled leasing appetite. Peru’s Lima corridor recorded a slight tightening in vacancy on limited completions, but Scotiabank flagged a 5% dip in cement demand during early 2025, hinting at developer caution.
Competitive Landscape
Competition is moderately concentrated, with a small group of leading landlords accounting for a substantial portion of institutional-grade inventory across tier-one metropolitan markets. Their scale enables bulk green-power procurement, portfolio-wide PropTech rollouts, and preferred access to anchor tenants. Mid-sized domestic funds often partner with these giants for capital-light exposure to trophy towers.
Strategic moves center on ESG retrofits and mixed-capital deal structures. Brookfield’s global USD 15 billion fund allocates a Latin American sleeve for value-add acquisitions that can achieve LEED Gold certification within 2 years. IWG is accelerating an “asset-light” model, converting fixed-rent leases into revenue-sharing arrangements that cushion downside shifts in occupancy. BR Properties, meanwhile, channels surplus cash into smart-building sensors projected to trim operating costs by up to 15% within three years.
PropTech startups are supplementing, not supplanting, incumbents. Tenant-experience platforms, lease-administration software, and AI-driven energy dashboards are scaling through landlord partnerships rather than direct asset plays. This reinforces existing market hierarchies, suggesting incremental, not disruptive, competitive change through 2031.
South America Office Real Estate Industry Leaders
Brookfield Property Group (Brookfield Brasil)
BR Properties S.A.
Cyrela Commercial Properties (CCP)
IRSA Propiedades Comerciales
Parque Arauco S.A.
- *Disclaimer: Major Players sorted in no particular order

Recent Industry Developments
- February 2026: São Paulo confirmed a USD 1.14 billion 30-year PPP auction to house 22,700 civil servants in 288,000 sq m of Grade A offices.
- January 2026: Nubank allocated USD 500 million over five years to expand offices in São Paulo, Campinas, Rio de Janeiro, Belo Horizonte, and Bogotá.
- June 2025: Bogotá advanced the 39.6-km Regiotram light-rail, a pillar of its USD 4 billion Airport City program.
- March 2025: Chile’s Ministry of Public Works progressed the USD 1.88 billion Santiago-Melipilla and USD 950 million Batuco rail spurs.


South America Office Real Estate Market Report Scope
| Sales |
| Rental |
| By Business Model | Sales |
| Rental |


Key Questions Answered in the Report
How large is the South America office real estate market today?
It stood at USD 99.30 billion in 2026 and is projected to touch USD 126.35 billion by 2031.
What CAGR is expected for the region through 2031?
The market is forecast to expand at a 4.91% CAGR over 2026–2031.
Which business model dominates office assets in South America?
Rental assets represent 81.2% of market share and continue to outpace sales growth.
Which country will grow the fastest by 2031?
Colombia is estimated to lead with a 6.09% CAGR driven by infrastructure projects and GCC inflows.
Why are Grade A offices outperforming older stock?
Tenants value ESG certifications and advanced amenities, allowing Grade A buildings to command 10%15% rental premiums and sustain sub-8% vacancy.
How is flexible workspace evolving after WeWork’s restructuring?
Operators now prefer revenue-share partnerships with landlords, giving corporations short-term options while limiting fixed liabilities for providers.
Page last updated on:


