Market Overview
| Study Period | 2020 - 2031 |
|---|---|
| Forecast Data Period | 2026 - 2031 |
| Historical Data Period | 2020 - 2024 |
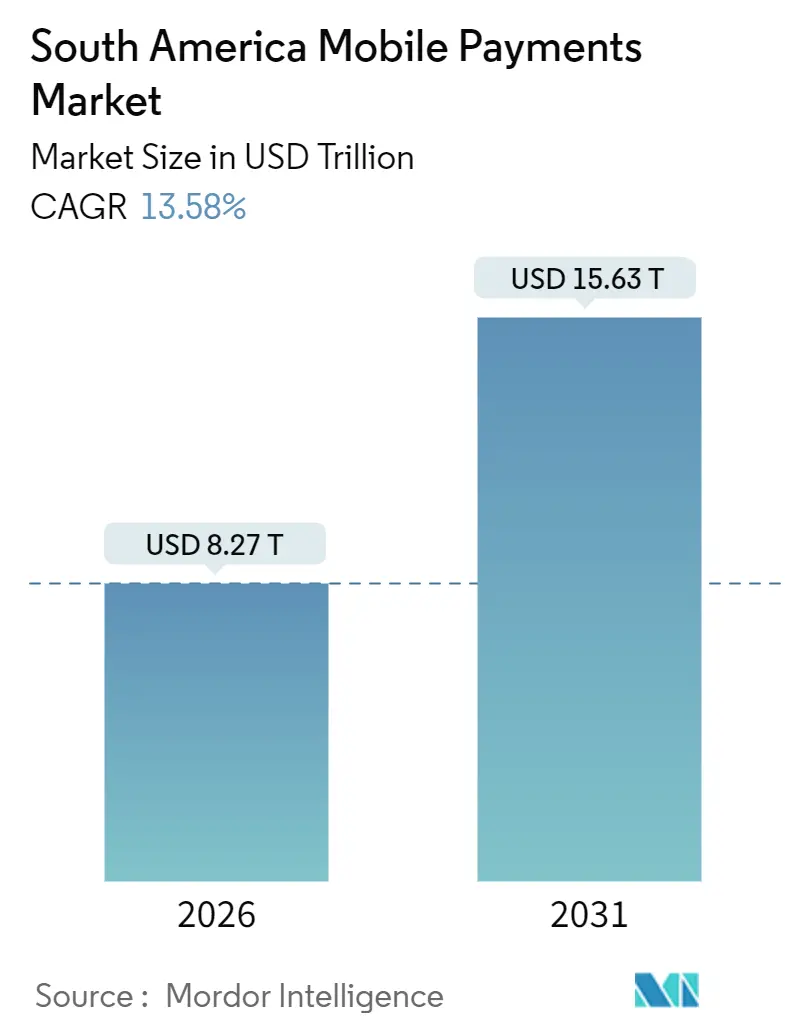
| Market Size (2026) | USD 8.27 Trillion |
| Market Size (2031) | USD 15.63 Trillion |
| Growth Rate (2026 - 2031) | 13.58% CAGR |
| Market Concentration | Medium |
Major Players *Disclaimer: Major Players sorted in no particular order Image © Mordor Intelligence. Reuse requires attribution under CC BY 4.0. | |
South America Mobile Payments Market Analysis by Mordor Intelligence
The South America mobile payments market reached a market size of USD 8.27 trillion in total transaction value in 2026, and it is projected to climb to USD 15.63 trillion by 2031, reflecting a 13.58% CAGR over the forecast period. Momentum originates from government-run real-time payment rails, a maturing fintech ecosystem, and expanding smartphone ownership that is replacing cash with instant digital transfers. Brazil’s PIX blueprint continues to spread across Colombia, Argentina, and Peru, driving a sharp rise in peer-to-peer volumes, while low-cost QR acceptance is narrowing the gap between in-store and online checkout. Merchant discount rates are falling, artificial-intelligence-based fraud tools are improving trust, and cross-border remittance corridors are starting to leverage account-to-account connectivity, opening new monetization layers across credit, loyalty, and insurance for platform operators. As central banks mandate interoperability and open-banking access, switching costs for consumers decline, shaping a regional trajectory in which the South America mobile payments market grows faster than overall retail sales and displaces legacy card rails in both physical and digital commerce.
Key Report Takeaways
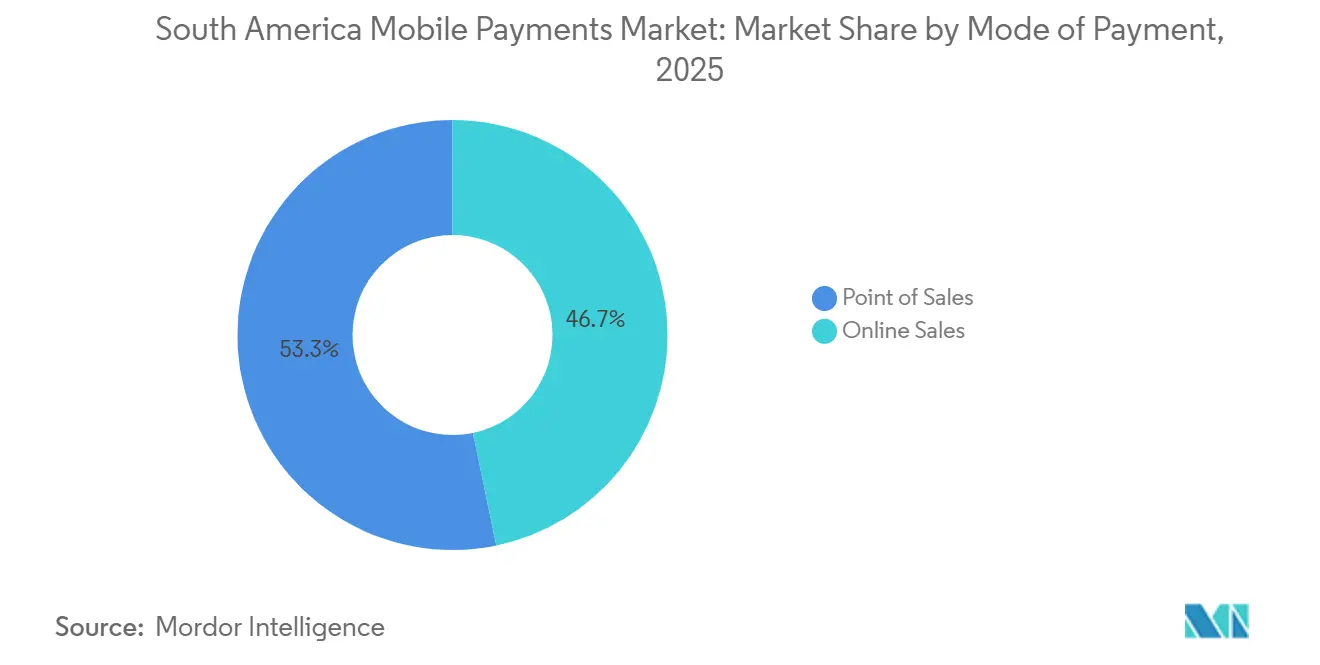
- By mode of payment, point-of-sales transactions led with 53.27% revenue share in 2025; online sales are advancing at a 15.82% CAGR through 2031.
- By payment type, other wallet-based methods held 62.91% of the South America mobile payments market size in 2025; QR-based solutions are forecast to expand at a 14.69% CAGR to 2031.
- By transaction type, peer-to-peer transfers captured 40.68% of the South America mobile payments market share in 2025 and are expanding at a 14.26% CAGR through 2031.
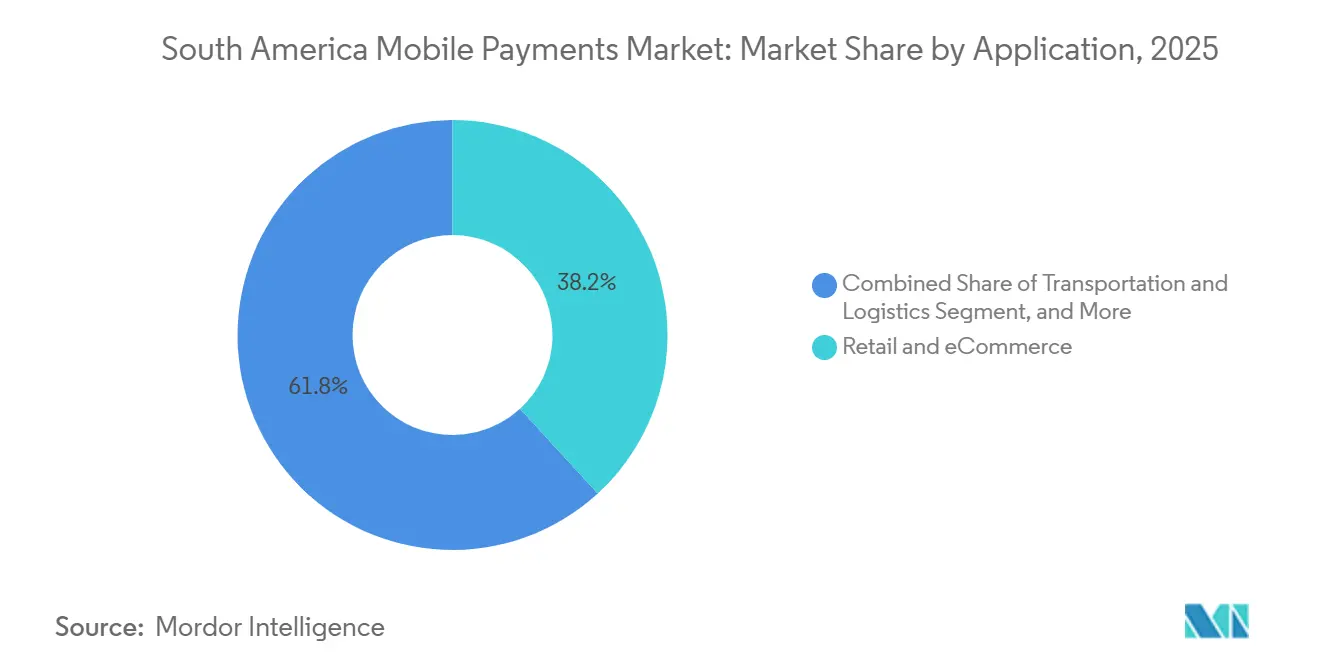
- By application, retail and e-commerce accounted for a 38.19% share of the South America mobile payments market size in 2025, while transportation and logistics is advancing at a 14.43% CAGR through 2031.
- By country, Brazil commanded 54.67% of spending in 2025; Colombia records the highest projected CAGR at 15.07% through 2031.
Note: Market size and forecast figures in this report are generated using Mordor Intelligence’s proprietary estimation framework, updated with the latest available data and insights as of January 2026.
South America Mobile Payments Market Trends and Insights
Drivers Impact Analysis*
| Driver | (~) % Impact on CAGR Forecast | Geographic Relevance | Impact Timeline |
|---|---|---|---|
| Surging Mobile Wallet Adoption Among Unbanked Population | +2.80% | Brazil, Colombia, Peru, with spillover to Argentina and Chile | Medium term (2-4 years) |
| Government-Backed Instant Payment Schemes (e.g., PIX) | +3.50% | Brazil (mature), Colombia (Bre-B launching), Argentina (Transferencias 3.0), Peru (expanding) | Short term (≤ 2 years) |
| Rising E-commerce Demand for One-Click Checkout | +2.10% | Brazil, Argentina, Chile, urban centers across region | Medium term (2-4 years) |
| Expansion of Fintech-Bank Partnerships | +1.90% | Brazil, Colombia, with early adoption in Argentina and Mexico spillover | Medium term (2-4 years) |
| Integration of Loyalty and BNPL Into Wallets | +1.60% | Brazil, Argentina, Chile, targeting middle-income segments | Long term (≥ 4 years) |
| Growing Cross-Border Remittance via Mobile Money | +1.40% | Venezuela-Colombia corridor, Bolivia-Argentina, Brazil-Paraguay | Long term (≥ 4 years) |
| Source: Mordor Intelligence | |||
Surging Mobile Wallet Adoption Among Unbanked Population
Financial-inclusion programs are converting cash-reliant households into active users of digital wallets at a pace that overtakes traditional bank-account growth. Brazilian mobile devices handled 70% of all banking transactions in 2024, with smartphone payment actions rising 251% between 2019 and 2023, while overall transaction counts doubled.[1]Sava, Estera, “Brazil: 2024 analysis of payments and ecommerce trends,” The Paypers, thepaypers.com Colombia experienced a 350% jump in instant transfers during 2024 as rural outreach initiatives closed branch-access gaps. In Peru, Yape surpassed 16 million users by mid-2024 and now serves 60% of urban smartphone owners, whereas FEPCMAC introduced a rural wallet in 2025 that targets informal workers beyond Lima. Zero-fee peer transfers replace cash and high-cost remittances, helping wallets embed credit and insurance upsells into everyday payment habits. As a result, platform operators that master user-experience design and micro-merchant onboarding stand to capture outsized share of the South America mobile payments market.[2]Worldpay, “Worldpay Global Payments Report 2025,” worldpayglobal.com
Government-Backed Instant Payment Schemes (e.g., PIX)
Central-bank rails are eliminating interchange fees and settlement delays, resetting merchant economics overnight. Brazil’s PIX moved BRL 26.4 trillion (USD 4.8 trillion) across 63 billion transactions in 2024, with 15 million merchants accepting QR codes and contactless PIX via NFC wallets going live in February 2025. Colombia’s Bre-B system debuted in May 2025 and is projected to lift account-to-account ecommerce share from 28% in 2024 to 40% by 2030. Argentina’s Transferencias 3.0 linked 67 wallets by late 2024, posting a 119% annual jump in instant transfers.[3]Banco Central de la República Argentina, “Transferencias 3.0 and Instant Payment Statistics,” bcra.gob.ar Merchant discount rates for PIX average zero compared with 3.2% on credit cards, accelerating QR substitution in physical stores. Interoperability mandates also force wallet providers to compete on value-added features instead of captive networks, broadening the addressable base of the South America mobile payments market.
Rising E-commerce Demand for One-Click Checkout
Mobile commerce represented 60% of Brazil’s USD 205 billion online gross merchandise value in 2024, and digital wallets held 30% of payment share as frictionless flows cut cart abandonment by up to 40%. Nubank embedded its NuPay option inside Amazon Brazil in 2025, providing instant credit assessments without redirecting shoppers. Mercado Pago processed USD 46.1 billion in total volume during Q3 2024, with 51% generated in Brazil and off-platform APIs bringing wallet acceptance to independent sites. Categories with higher ticket sizes, such as appliances and health, see rapid conversion when installment plans surface in one click at checkout. As cross-border marketplaces add local-currency wallets, foreign sellers gain compliant entry into neighborhood-level demand, further enlarging the South America mobile payments market.
Expansion of Fintech-Bank Partnerships
Open-banking frameworks grant fintechs API access to account data and payment initiation, blurring traditional competitive lines. Brazil’s open-finance ecosystem reached 45.8 million users by September 2024, generating 5.2 billion monthly API calls and setting a November 2025 deadline for mandatory PIX-Open Finance integration.[4]Banco Central do Brasil, “PIX Statistics and Adoption Data,” Banco Central do Brasil, bcb.gov.br Nubank leverages open-banking rails to issue credit in real time during checkout, while PagBank’s point-of-sale links feed underwriting models that extend working-capital loans to merchants. Banks retain deposits, but fintechs capture payment flows, boosting the region’s payment revenue pool by an estimated 11% annually between 2019 and 2024. These partnerships allow incumbents to share compliance burdens yet remain relevant as wallets overlay richer experiences, a dynamic that lifts both innovation velocity and transaction value across the South America mobile payments market.
Restraints Impact Analysis*
| Restraint | (~) % Impact on CAGR Forecast | Geographic Relevance | Impact Timeline |
|---|---|---|---|
| Lack of Interoperability Across Wallet Ecosystems | -1.80% | Argentina, Colombia, Chile, Peru (Brazil partially mitigated by PIX) | Medium term (2-4 years) |
| Persistent Cyber-Fraud and Phishing Attacks | -1.50% | Brazil (highest volume), Argentina, Colombia | Short term (≤ 2 years) |
| High Merchant MDR for Small Ticket Transactions | -1.20% | Argentina, Chile, Peru (Brazil mitigated by PIX zero-fee model) | Medium term (2-4 years) |
| Slower NFC POS Infrastructure Roll-out Outside Brazil | -0.90% | Argentina, Colombia, Chile, Peru, Rest of South America | Long term (≥ 4 years) |
| Source: Mordor Intelligence | |||
Lack of Interoperability Across Wallet Ecosystems
Many wallets still operate closed loops that force consumers to juggle multiple apps and oblige merchants to integrate several gateways. In Argentina, Transferencias 3.0 resolved only QR acceptance while true wallet-to-wallet transfers often require bank accounts as intermediaries. Colombia’s Nequi and Daviplata, with 31 million users combined, do not yet allow direct cross-transfers, increasing friction for small businesses. Brazil’s PIX demonstrates a viable alternative by routing any wallet or banking app through a single identifier, but replication elsewhere faces governance hurdles and vendor lobbying. Fragmentation curbs network effects, slows scale efficiencies, and ultimately caps the potential growth of the South America mobile payments market.
Persistent Cyber-Fraud and Phishing Attacks
Transaction volume growth has been shadowed by an uptick in fraud, eroding trust and inflating compliance costs. Brazil disclosed PIX losses of BRL 2.7 billion (USD 495 million) over two years, with a 43% jump in 2024 alone. Mobile-banking malware attacks in Latin America rose 220% in H1 2025, and stolen-device fraud tripled as social-engineering schemes captured one-time passwords.[5]Kaspersky, “Mobile Banking Fraud and Malware Attacks in Latin America,” kaspersky.com Nubank’s Pix Protegido and PicPay’s AI WhatsApp assistant now analyze behavioral signals in real time to flag suspicious transfers. Yet every additional security layer risks adding friction that can push users back to cash, making fraud containment a decisive factor for sustainable expansion of the South America mobile payments market.
*Our forecasts treat driver/restraint impacts as directional, not additive. The impact forecasts reflect baseline growth, mix effects, and variable interactions.
Segment Analysis
By Mode of Payment: Online Sales Outpace In-Store Transactions
Point-of-sales flows retained 53.27% of total value in 2025, confirming that in-person commerce still dominates everyday spending. Brazil alone supports 15 million PIX-accepting merchants, and contactless card transactions rose to 61.1% of card volume in H1 2024, while NFC-enabled PIX launched in early 2025, closing the usability gap with plastic cards. Even so, online sales show the strongest trajectory, expanding at a 15.82% CAGR through 2031 as mobile commerce already represents 60% of Brazil’s e-commerce receipts. The South America mobile payments market size for online channels is projected to double before the decade ends, aided by QR-embedded checkout widgets that remove redirect steps and reduce abandonment. Marketplace APIs allow merchants to accept wallet payments without extra hardware, easing rural rollout and lowering total cost of ownership.
The structural forces behind this swing include growing smartphone penetration, widespread 4G coverage, and government incentives for digital receipts that streamline tax collection. Colombia’s Bre-B system should lift account-to-account ecommerce share from 28% in 2024 to 40% by 2030, while Argentina’s e-commerce users increasingly default to Mercado Pago for its integrated buyer protection. Still, brick-and-mortar will not evaporate. It will instead hybridize, with merchants offering scan-to-pay kiosks and curbside QR codes that blur the boundary between in-store and online. As a result, the South America mobile payments market continues to treat both channels as complementary, not substitutive.


By Payment Type: QR Codes Scale Faster Than NFC Terminals
Other wallet-based formats, ranging from app-to-app transfers to USSD strings, commanded 62.91% of transaction value in 2025, underscoring the importance of software-only acceptance that sidesteps hardware costs. PicPay processed BRL 421 billion (USD 77 billion) in 2024, mostly through closed-loop wallet flows rather than dedicated QR or NFC lines. Nonetheless, QR-based payments are growing at 14.69% CAGR, outstripping NFC because merchants can print a code for pennies instead of purchasing USD 50-200 terminals. Brazil’s 15 million QR merchants and Argentina’s 67-wallet interoperability initiative highlight the region’s appetite for camera-based scanning. NFC retains strength inside Brazil, where contactless usage now exceeds 60% of card volume and Visa’s Tap to Phone turns Android devices into mini-terminals at scale.
From a strategic angle, QR codes help expand the South America mobile payments market by enabling street vendors, taxi drivers, and pop-up retailers to digitize without bank-issued hardware. Conversely, NFC will remain vital for higher-ticket transactions in formal retail, especially as contactless PIX removes card-network fees. The coexistence of both methods suggests providers must maintain dual-acceptance strategies, yet the lower marginal cost of QR ensures it captures incremental share, particularly in emerging city tiers.
By Transaction Type: Peer-to-Peer Transfers Sustain Top Position
Peer-to-peer transfers held 40.68% of value in 2025 and are growing at 14.26% CAGR, benefiting from zero-cost instant rails and cultural norms of informal money exchange. PIX processed 63 billion transactions in 2024, most of which were person-to-person, underscoring how routine social payments now anchor user engagement. Yape in Peru and PLIN in Colombia serve similar roles, spurring wallet adoption outside the formal merchant network. Person-to-merchant flows account for about 35% of volume and rise quickly as QR acceptance sweeps micro-enterprises, while bill payments, tax remittances, and government transfers make up the rest.
The economics favor peer transfers because they build daily-use frequency, letting platforms monetize via micro-credit and investment products. As wallets evolve, user experience has converged between sending money to friends and paying a store, further blurring categories. Still, regulators will watch closely to ensure anti-money-laundering compliance, which could raise operational overhead for entrants but also reinforce barriers to entry, shaping competitive contours inside the South America mobile payments market.


By Application: Retail Leads, Transportation Rises Fastest
Retail and e-commerce captured 38.19% of 2025 value, reflecting the depth of Brazil’s USD 205 billion online sector and the rapid wallet uptake in fast-moving consumer goods categories. Transportation and logistics stand out as the fastest-growing niche at 14.43% CAGR because ride-hailing, food delivery, and public transit all embed QR or wallet checkout directly inside service apps. Rappi processed 3.4 million daily orders in Q3 2024, with RappiPay used by 6 million Colombians to sidestep cash on delivery, cutting fraud while speeding driver payouts.[6]Rappi, “Rappi Order Volume and RappiPay User Metrics,” rappi.com Uber and 99 accept PIX in Brazil, turning urban mobility services into everyday payment training grounds.
Hospitality and food service maintain roughly one-fifth of spend, fueled by QR-based table ordering that curbs wait times for staff. Government payments and social benefits contribute 12%, while education and health round out the mix. The variety of use cases underscores that the South America mobile payments market is no longer confined to discretionary retail; it now permeates utilities, transit, and public finance, deepening systemic reliance on instant digital rails.
Geography Analysis
Brazil anchors the region with 54.67% of 2025 value, enabled by 170 million PIX users, 261 million smartphones, and a fintech trio, Nubank, Mercado Pago, and PicPay, collectively processing more than USD 200 billion in quarterly volume. Cash withdrawals fell 27% between 2021 and 2023, and open-finance coverage hit 45.8 million users by late 2024, giving fintechs new datasets to initiate payments and underwrite credit. Colombia follows as the fastest grower at 15.07% CAGR, mainly due to Bre-B’s 2025 launch and a combined 31 million users on Nequi and Daviplata who already handle more than half of all online purchases. The government supports wallet adoption through tax incentives for small businesses that accept digital payments.
Argentina ranks next with an 18% share, leveraging Transferencias 3.0 to knit 67 wallets into one QR network; however, inflation headwinds temper absolute growth. Chile, holding 12%, exhibits high financial inclusion but slower real-time rail rollout, limiting its CAGR to 7%. Peru’s 10% share is concentrated in Yape’s 16 million urban users, yet rural coverage improves as FEPCMAC channels digital salaries to informal workers, narrowing cash dependence. The remainder of South America together accounts for 5.33%; Bolivia illustrates early-stage wallet exportation as Yape prepares to reach 6 million users by 2028. Overall, dispersion in policy execution and macro-stability explains divergent adoption curves, but each market gravitates toward the same endpoint: ubiquitous, account-to-account digital payment rails driving the wider South America mobile payments market.
Competitive Landscape
Competition is intense but not winner-take-all, yielding a moderately concentrated field where scale players coexist with upstart specialists. Nubank, Mercado Pago, and PicPay surpassed USD 200 billion in combined quarterly volume during 2024, relying on zero-fee PIX rails to underprice traditional acquirers that still charge 3.2% for credit and 1.8% for debit in Brazil. PagBank’s BRL 38.7 billion (USD 7.1 billion) merchant volume in 2024 underscores how bundled terminals, working-capital loans, and instant settlement lure small businesses away from legacy banks. Visa scales a different vector, placing 20 million Tap-to-Phone installations across Latin America by 2025, turning any Android handset into a contactless reader.[7]Visa Inc., “Visa Tap to Phone Deployment Statistics,” visa.com
Cross-border remittance remains ripe for disruption: USD 158 billion entered Latin America in 2024, yet mobile corridors account for a minor slice of flow. Entrants that pair competitive FX with instant wallet settlement can capture fee pools now owned by cash agents. Artificial-intelligence tooling differentiates fraud prevention and credit scoring; PicPay’s WhatsApp assistant fielded 6 million interactions in 2025, and Nubank’s Pix Protegido flags anomalies in sub-second windows. Regulation also drives strategy. Brazil’s November 2025 mandate requiring PIX-Open Finance integration will let third-party apps initiate payments, eroding bank control of deposit rails and intensifying direct-to-consumer fintech campaigns. While Apple Pay enjoys 20% iPhone user adoption in Brazil, sub-15% iOS market share across the region limits its ceiling against Android-native wallets. Overall, the competitive narrative is one of rapid experimentation, with scale hinging on data-driven lending and platform stickiness rather than per-transaction fees, reinforcing the broader growth of the South America mobile payments market.
South America Mobile Payments Industry Leaders
MercadoLibre, Inc.
Nu Holdings Ltd.
Nu Holdings Ltd.
PPicpay Participações e Investimentos Ltda.
agSeguro Digital Ltd.
- *Disclaimer: Major Players sorted in no particular order

Recent Industry Developments
- January 2026: PicPay filed for a Nasdaq listing under ticker PICS, reporting USD 1.37 billion in nine-month 2025 revenue and attracting a USD 75 million anchor commitment from Bicycle Management Company.
- October 2026: Argentina’s data-protection regulator and Brazil’s ANPD signed a memorandum of understanding to promote bilateral cooperation on cross-border data governance, aiming to harmonize AI sandboxes and international transfer protocols.
- October 2025: PicPay engaged Citigroup, Royal Bank of Canada, and Bank of America to pursue a USD 500 million United States IPO.
- May 2025: Colombia’s Bre-B instant payment platform went live, providing real-time account-to-account transfers for consumers and merchants nationwide.


South America Mobile Payments Market Report Scope
The South America Mobile Payments Market Report is Segmented by Mode of Payment (Point of Sales, and Online Sales), Payment Type (NFC, QR-Based, and Other Payment Types, Transaction Type (Peer-to-Peer, In-store Point-of-Sale, Person-to-Merchant, Other Transaction Types), Application (Retail and eCommerce, Transportation and Logistics, Hospitality and Food-Service, Government and Public Sector, Other Applications), and Geography (Brazil, Argentina, Colombia, Chile, Peru, Rest of South America). The Market Forecasts are Provided in Terms of Value (USD).
By Mode of Payment
| Point of Sales |
| Online Sales |
By Payment Type
| NFC |
| QR-Based |
| Other Payment Types |
By Transaction Type
| Peer-to-Peer (P2P) |
| In-store Point-of-Sale (POS) |
| Person-to-Merchant (P2M/Checkout) |
| Other Transaction Types |
By Application
| Retail and eCommerce |
| Transportation and Logistics |
| Hospitality and Food-Service |
| Government and Public Sector |
| Other Applications (Education, Healthcare) |
By Country
| Brazil |
| Argentina |
| Colombia |
| Chile |
| Peru |
| Rest of South America |
| By Mode of Payment | Point of Sales |
| Online Sales | |
| By Payment Type | NFC |
| QR-Based | |
| Other Payment Types | |
| By Transaction Type | Peer-to-Peer (P2P) |
| In-store Point-of-Sale (POS) | |
| Person-to-Merchant (P2M/Checkout) | |
| Other Transaction Types | |
| By Application | Retail and eCommerce |
| Transportation and Logistics | |
| Hospitality and Food-Service | |
| Government and Public Sector | |
| Other Applications (Education, Healthcare) | |
| By Country | Brazil |
| Argentina | |
| Colombia | |
| Chile | |
| Peru | |
| Rest of South America |


Key Questions Answered in the Report
How large is the South America mobile payments market in 2026?
Total transaction value reached USD 8.27 trillion in 2026 and is on track to hit USD 15.63 trillion by 2031.
Why is Brazil so dominant in mobile payments across South America?
Brazil's PIX rail, extensive smartphone penetration, and leading fintechs such as Nubank, Mercado Pago, and PicPay create a powerful network effect that concentrates 54.67% of regional value.
Which payment method is growing fastest in the region?
QR-based wallet payments are expanding at a 14.69% CAGR because printed codes require almost no hardware investment for merchants.
What role do instant payment schemes play in adoption?
Government-run systems like PIX and Bre-B remove interchange fees and settlement delays, prompting both consumers and merchants to switch from cash or cards to real-time transfers.
How serious is fraud in mobile payments, and what are providers doing about it?
Brazil logged nearly USD 495 million in PIX-related losses over two years, driving platforms to adopt AI-powered monitoring such as Nubanks Pix Protegido and PicPays WhatsApp assistant to flag anomalies in real time.
Page last updated on:


