South America Global Capability Centers Market Size and Share
Market Overview
| Study Period | 2020 - 2031 |
|---|---|
| Forecast Data Period | 2026 - 2031 |
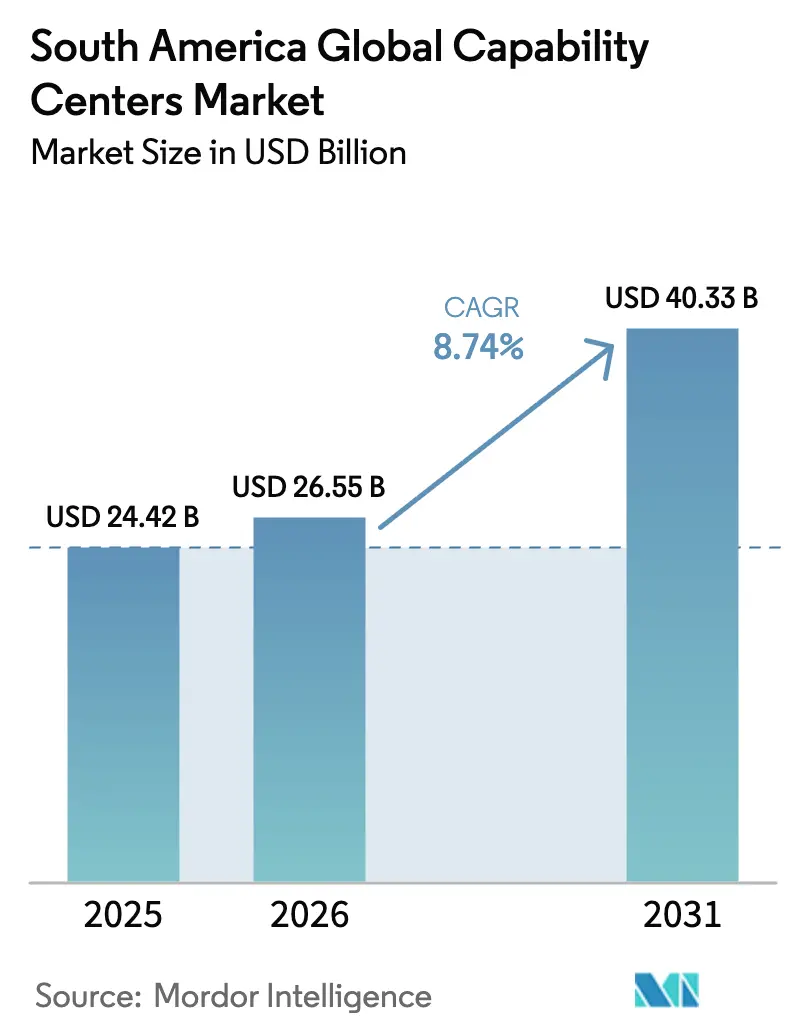
| Base Year Market Size (2025) | USD 24.42 Billion |
| Market Size (2026) | USD 26.55 Billion |
| Market Size (2031) | USD 40.33 Billion |
| Growth Rate (2026 - 2031) | 8.74% CAGR |
| Market Concentration | Medium |
Major Players *Disclaimer: Major Players sorted in no particular order Image © Mordor Intelligence. Reuse requires attribution under CC BY 4.0. | |
South America Global Capability Centers Market Analysis by Mordor Intelligence
The South America global capability centers market size was valued at USD 24.42 billion in 2025 and estimated to grow from USD 26.55 billion in 2026 to reach USD 40.33 billion by 2031, at a CAGR of 8.74% during the forecast period (2026-2031). Expanding near-shore demand from United States enterprises, combined with cost-competitive multilingual talent and growing hyperscale cloud footprints, underpins the region’s sustained double-digit pipeline. Service providers are increasingly embedding artificial intelligence workloads to boost productivity, and governments across Brazil, Uruguay, Chile, and Argentina continue to extend tax holidays, which help keep delivery costs stable in the face of currency fluctuations. Hyperscale investments by Microsoft and Amazon have reduced latency and enhanced compliance, providing the South America global capability centers market a structural advantage in terms of time-zone alignment and data localization.[1]Microsoft Corporation, “Microsoft Announces USD 2.7 Billion Cloud and AI Investment in Brazil,” microsoft.comMeanwhile, hybrid work cultures that became mainstream during the pandemic have matured into permanent operating models, accelerating consolidation of distributed engineering and customer-care teams inside the region.
Key Report Takeaways
- By function, information technology and digital services led the South America global capability centers market with a 55.12% revenue share in 2025, and are forecast to expand at a 9.02% CAGR through 2031.
- By engagement model, captive centers held 59.92% of the South America global capability centers market share in 2025; hybrid build-operate-transfer arrangements are set to record the highest growth at 9.54% CAGR to 2031.
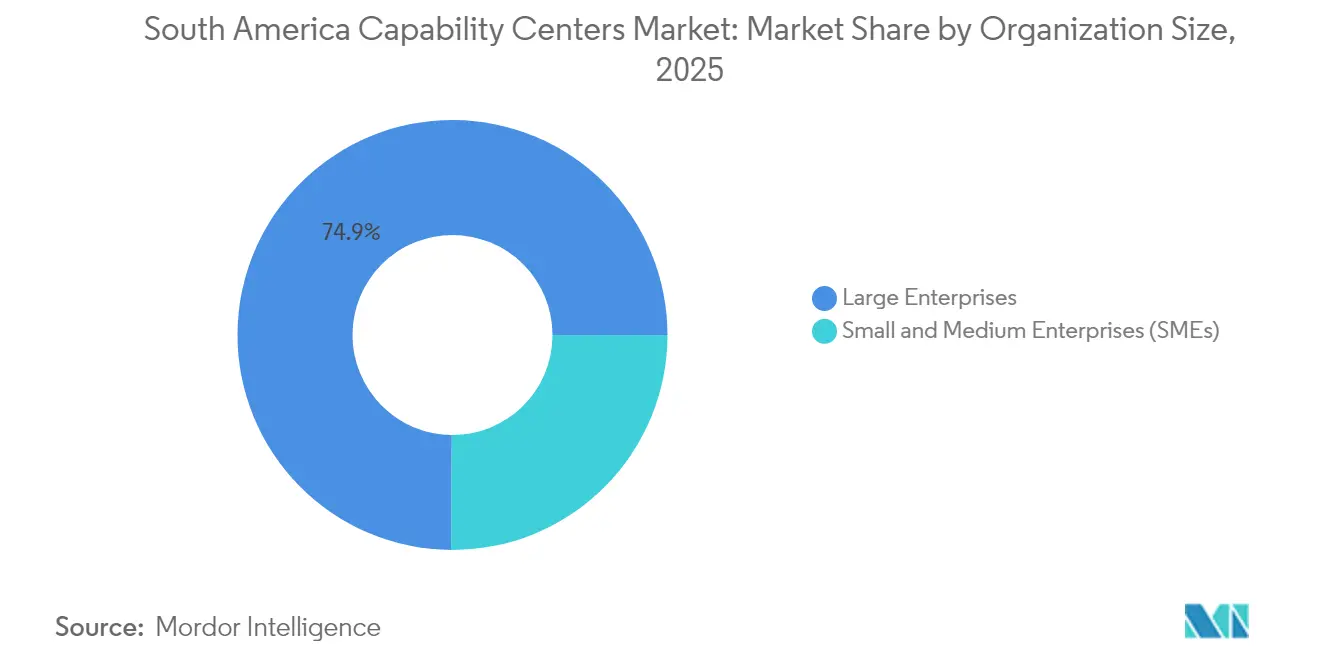
- By organization size, large enterprises controlled 74.89% of the South America global capability centers market in 2025, although small and medium enterprises are projected to post a 10.05% CAGR through 2031.
- By industry vertical, banking, financial services, and insurance captured 29.98% of the South America global capability centers market size in 2025, whereas healthcare and life sciences are projected to advance at a 9.21% CAGR by 2031.
- By country, Brazil accounted for 59.31% of the South America global capability centers market in 2025, while Argentina is expected to accelerate at a 9.17% CAGR between 2026 and 2031.
Note: Market size and forecast figures in this report are generated using Mordor Intelligence’s proprietary estimation framework, updated with the latest available data and insights as of 2026.
South America Global Capability Centers Market Trends and Insights
Drivers Impact Analysis*
| Driver | (~) % Impact on CAGR Forecast | Geographic Relevance | Impact Timeline |
|---|---|---|---|
| Digital-skills supply outpaces regional demand | +1.8% | Brazil, Argentina, Chile | Medium term (2-4 years) |
| Near-shore time-zone advantage for North American clients | +1.5% | South America | Long term (≥ 4 years) |
| Government-backed fiscal incentives for technology exports | +1.2% | Uruguay, Argentina, Brazil | Short term (≤ 2 years) |
| Rapid cloud and AI adoption among regional corporates | +2.1% | Brazil, regional spillover | Medium term (2-4 years) |
| Pandemic-accelerated remote-first operating models | +0.9% | Global | Short term (≤ 2 years) |
| Rise of Spanish and Portuguese multilingual support demand | +0.4% | Brazil, Argentina | Long term (≥ 4 years) |
| Source: Mordor Intelligence | |||
Digital-Skills Supply Outpaces Regional Demand
Brazil hosts more than 1.2 million technology professionals, while Argentina adds about 450,000, creating a talent surplus that global firms harness for cloud engineering, data analytics, and full-stack development. Salaries remain 40-60% below United States averages, even after adjusting for inflation, thereby preserving cost arbitrage without compromising quality. Companies, including Tata Consultancy Services, recently filled 1,600 roles in Londrina, Brazil, by tapping engineers from secondary cities. The abundance lowers recruitment lead times and supports quicker ramp-ups for new captive centers. Universities and coding bootcamps have synchronized curricula with hyperscalers, ensuring graduates arrive with cloud certifications that shorten onboarding cycles. This sustained oversupply is expected to shave at least 1.8 percentage points off cost escalations across 2025-2027.
Near-Shore Time-Zone Advantage for North American Clients
South America shares two to three overlapping business hours with the eastern United States, enabling real-time stand-ups, design sprints, and customer-care handoffs that improve cycle times by up to 30% versus Asian offshoring models. Financial services traders rely on synchronous risk monitoring from Buenos Aires-based centers that mirror the hours of the New York desk. Spanish and Portuguese support delivered from São Paulo covers both North American and Latin American callers in a single shift, cutting scheduling complexity. Agile development teams report fewer rework loops because product owners and developers collaborate during the same daylight window. The alignment also reduces travel fatigue for on-site workshops, encouraging more frequent client visits that deepen account stickiness. As hybrid work persists, real-time collaboration remains strategically important for value-added functions such as design thinking and user-experience testing.
Government-Backed Fiscal Incentives for Technology Exports
Uruguay grants zero corporate tax on software exports, and Argentina’s Knowledge Economy Law rebates employer social contributions by up to 70% for qualifying technology firms.[2]Economic Commission for Latin America and the Caribbean, “Transformative Potential of Digital Technologies and AI,” cepal.orgBrazil’s ReData statute lowers data-center equipment taxes, directly reducing opex for cloud-heavy capability centers. These incentives include expedited work permits that enable firms to relocate niche experts within two weeks, thereby improving project mobilization. Public agencies partner with cloud providers to fund reskilling, lowering training budgets for employers. Fiscal support collectively trims operating costs and shortens payback periods, encouraging greenfield investments in secondary cities. The crowding-in effect stimulates ancillary industries such as coworking spaces and managed-services vendors, amplifying the positive GDP impact.
Rapid Cloud and AI Adoption Among Regional Corporations
Microsoft’s USD 2.7 billion multi-year cloud build-out in Brazil increased in-region compute capacity by 42% in 2025, providing enterprises with low-latency access to AI models. Telecommunications, retail, and healthcare firms have pivoted to generative AI for predictive maintenance and patient triage, tasks that are increasingly being delegated to newly established capability centers. CEPAL estimates that artificial intelligence could unlock USD 100 billion in regional value by 2030, a projection that is accelerating the demand for specialized engineering teams. Cloud-native architectures simplify multi-tenant deployments, letting small and medium enterprises consume advanced analytics without large capex. The virtuous cycle between hyperscale infrastructure and enterprise workloads continues to push service-line mix toward data engineering and machine-learning operations.
Restraints Impact Analysis*
| Restraint | (~) % Impact on CAGR Forecast | Geographic Relevance | Impact Timeline |
|---|---|---|---|
| Currency volatility is impacting cost predictability | -1.1% | Argentina, Brazil | Short term (≤ 2 years) |
| Infrastructure bottlenecks outside tier-1 cities | -0.8% | Secondary cities | Medium term (2-4 years) |
| Intensifying talent poaching by global tech firms | -0.6% | Brazil, Argentina, Chile | Long term (≥ 4 years) |
| Perceived political instability is deterring long-term bets | -0.4% | Argentina and the region | Medium term (2-4 years) |
| Source: Mordor Intelligence | |||
Currency Volatility Impacting Cost Predictability
The Argentine peso lost more than 100% of its value against the USD in 2024, forcing central banks to build complex hedging layers that inflate treasury costs. Brazilian real swings of 15-20% add budgeting noise that complicates three-year payback models for captive builds. Multinationals with smaller finance teams prefer fixed-price managed services agreements over direct payroll exposure, thereby curbing captive center expansion. Volatility also erodes employee purchasing power, increasing the frequency of wage adjustments and raising the risk of attrition. Vendors with diversified Latin American footprints offset risk by denominating contracts in USD, but smaller local firms struggle to access low-cost hedging instruments.
Infrastructure Bottlenecks Outside Tier-1 Cities
OECD data indicate that 28% of Brazilian municipalities lack fiber backhaul, raising concerns about the reliability of high-availability workloads.[3]Organisation for Economic Co-operation and Development, “Going Digital in Brazil,” oecd.org Power-grid brownouts in secondary locations, such as Recife, interrupt latency-sensitive processes, prompting firms to colocate in expensive data centers in São Paulo. Limited carrier-neutral data center presence outside capital cities restricts edge compute deployments, resulting in latency exceeding 50 milliseconds for some applications. Although satellite and 5G options are improving, redundancy remains suboptimal for mission-critical services, such as real-time trading and telemedicine imaging. Infrastructure gaps cap the addressable labor pool by discouraging employers from tapping lower-cost inland talent, thereby diluting potential savings.
*Our forecasts treat driver/restraint impacts as directional, not additive. The impact forecasts reflect baseline growth, mix effects, and variable interactions.
Segment Analysis
By Function / Capability: IT Services Anchor Long-Term Growth
The information technology and digital services segment accounted for 55.12% of the South America global capability centers market in 2025 and is projected to surge at a 9.02% CAGR, reflecting its role as the principal engine of near-shore transformation. This dominance reflects the migration of enterprises to cloud-native stacks, cybersecurity upgrades, and increased experimentation with AI. Capability centers now incorporate DevSecOps, low-code platforms, and machine-learning operations as baseline offerings. Parallel demand for engineering and research and development remains robust, driven by automotive electrification projects and aerospace composites research.
Digitally focused centers benefit from hyperscale grants that subsidize employee certification paths in Azure, AWS, and Google Cloud, reducing onboarding time to production. Companies allocate up to 60% of new-hire hours to AI safety training to mitigate the risks of hallucination in generative applications. Process automation further blurs the boundary between business-process outsourcing and knowledge-process outsourcing, creating hybrid roles such as data-labeling analysts who also design reusable APIs. Continuous integration pipelines now span Argentina and Colombia, exploiting English-proficient graduates who can take design requirements live within the same day.


By Engagement Model: Hybrid Build-Operate-Transfer Scales Flexibly
Captive centers still held 59.92% of the South America global capability centers market share during 2025, thanks to heightened data-sovereignty and intellectual-property concerns in sectors such as banking. Nevertheless, hybrid build-operate-transfer structures are projected to grow at a 9.54% CAGR and command greater mindshare among firms piloting AI prototypes. Multinationals partner with regional integrators for year-one setup and compliance gating, then assume managerial control once internal competency matures. The model shortens launch timelines by up to six months compared with greenfield captives.
Hybrid frameworks are popular for analytics centers where data-governance baselines must be codified before knowledge transfer. Service providers under revenue-share contracts incentivize rapid productivity gains via automation, then relinquish assets on mutually agreed equity or fee buyouts. Cloud-native infrastructure further supports elasticity by allowing centers to scale containers across multiple regions without requiring physical buildouts. Legal teams draft dual-jurisdiction clauses that pre-clear export‐control audits, reducing handover friction.
By Organization Size: SME Uptake Gains Momentum
Large enterprises contributed 74.89% of 2025 revenue, but small and medium enterprises are expected to post the fastest growth rate of 10.05% through 2031, reflecting the maturation of cloud-enabled solutions and remote team tooling. Fintechs, health-tech start-ups, and SaaS vendors drive the global market size for South America's capability centers, serving SMEs. Cloud vendor accelerator programs bundle consulting credits and sandbox environments, trimming initial spend thresholds.
SMEs deploy micro-teams of 25-100 engineers in Buenos Aires or Montevideo to maintain core product roadmaps, while headquarters focus on go-to-market strategies. Lower management overhead enables faster decision cycles, and equity incentives align distributed teams toward rapid feature releases. Remote-first governance models standardize sprint rituals, ensuring parity between onshore and near-shore product squads. The SME trend broadens the client mix for regional service providers, who package plug-and-play compliance and DevOps toolchains for rapid onboarding.
By Industry Vertical: Financial Services Lead, Healthcare Accelerates
Banking, financial services, and insurance captured 29.98% of the revenue in 2025, driven by stringent data-residency mandates and constant trading desk support needs that match the region’s overlapping time zones with those of New York. Centers deliver anti-money laundering analytics, API banking integration, and 24/7 cyber fusion operations. In contrast, the healthcare and life sciences sectors are expected to grow at a 9.21% CAGR, driven by the roll-out of telehealth services and the decentralization of clinical trials. HIPAA-aligned protocols have been localized through Brazil’s LGPD and Chile’s patient-data statutes, de-risking cross-border sharing.
Medical-device manufacturers maintain regulatory affairs offices in São Paulo that liaise with U.S. Food and Drug Administration reviewers during daylight overlap. Pharmaceutical research centers in Córdoba now run AI-driven compound-screening simulations, leveraging regional high-performance computing clusters. Manufacturing, automotive, and industrial majors utilize engineering services centers to develop digital twins and predictive maintenance algorithms for electric vehicle lines. Retailers adopt omnichannel dashboards that integrate e-commerce logistics with last-mile drone pilots around Bogotá.
Geography Analysis
Brazil sustained a 59.31% revenue share during 2025, supported by the region’s deepest fiber footprint and the roll-out of Tier IV data centers around São Paulo and Rio de Janeiro. Continuous public-private skill programs certify more than 200,000 cloud architects annually, ensuring steady pipeline flow. However, 28% of municipalities still lack fiber backhaul, restricting diversification into lower-cost inland areas.
Argentina posted the region’s highest 9.17% CAGR and has begun to attract higher-value engineering projects that leverage its English-proficient labor force. Time-zone alignment with the United States enables product owners in Austin to co-create with data scientists in Córdoba in real-time. Fiscal incentives under the Knowledge Economy Law continue through 2034, making long-term planning more predictable despite currency headwinds.
The Rest-of-South America grouping, which includes Uruguay, Chile, Colombia, and Paraguay, offers specialized niches. Uruguay acts as a data-sovereignty hub, bolstered by Google’s USD 850 million facility, which became operational in 2025. [4]Google, “Google Latin America Data Center Investments,” google.com . Chile capitalizes on its investment-grade rating and stable political climate to lure banking and insurance analytics centers. Colombia leverages bilingual graduates and Pacific-to-Atlantic connectivity to bridge North and South American traffic. Paraguay’s low-cost renewable power presents future opportunities for carbon-neutral high-performance compute clusters.
Competitive Landscape
The competitive field remains moderately concentrated, with the top five vendors accounting for a significant share of total revenue. Tata Consultancy Services added a 1,600-seat center in Londrina in 2024, expanding its South America footprint to eight cities and integrating AI accelerators that increase developer throughput by 25%. IBM anchors hybrid-cloud solutions from São Paulo, integrating Red Hat OpenShift stacks for clients in financial services and telecom sectors.
Regional pure-plays, such as Globant and CI&T, increasingly win design-thinking and agile pods, leveraging cultural proximity and Spanish-language fluency to unseat larger offshore rivals. Hyperscalers like Microsoft, Amazon, and Google shift the value stack by bundling infrastructure credits with managed AI toolkits, enabling centers to scale without large capex outlays. Mid-tier integrators focus on sector-specific templates, for example, reg-tech solutions for insurers under Chile’s updated solvency norms.
Mergers and acquisitions are expected to intensify through 2025, with at least eight tuck-in deals around data engineering boutiques that reinforce vertical depth. Wage inflation in urban Brazil spurred secondary-city expansion, such as Recife’s FinTech Valley initiative that convinced two multinational banks to pilot 300-seat risk-modeling pods. The pivot to hybrid engagement models also creates white-space for community colleges and coding bootcamps that deliver ready-to-deploy micro-certified cohorts, shortening talent lead times.
South America Global Capability Centers Industry Leaders
Accenture plc
Tata Consultancy Services Limited
Cognizant Technology Solutions Corporation
IBM Corporation
Capgemini SE
- *Disclaimer: Major Players sorted in no particular order


Recent Industry Developments
- January 2025: Microsoft completed phase one of its São Paulo AI SuperCluster, adding 12 petaflops of regional compute capacity.
- December 2024: Google broke ground on a second data-center campus in Uruguay to bolster low-latency delivery across Mercosur markets.
- September 2024: Tata Consultancy Services inaugurated a 1,600-employee delivery hub in Londrina, Brazil, dedicated to digital services and AI engineering.


South America Global Capability Centers Market Report Scope
The scope of the global capability center study for the market segmentation by the Function/Capability for (i) Information Technology (IT) and Digital Services segment is limited to Software Development, Cloud and Infrastructure Management, Cybersecurity, Data Analytics and AI/ML; (ii) Engineering / ER&D segment is limited to Product Design and Testing, Embedded Systems, Digital Twin / Simulation; (iii) Business Process Management (BPM) segment is limited to Finance and Accounting, HR, Payroll and Talent Management, Procurement, Customer Service; and (iv)Knowledge Process Outsourcing (KPO) segment is limited to Market Research and Insights, Risk and Compliance, Legal and Regulatory Support, Strategy and Consulting Support. Similarly, for segmentation by the Engagement Model, scope for (i) Hybrid Build-Operate-Transfer (BOT) is limited to Joint Venture / Strategic Partnership and Virtual Captive Model. The rest of the segment scope is as specified for the listed segment.
| Information Technology (IT) and Digital Services |
| Engineering / ER&D |
| Business Process Management (BPM) |
| Knowledge Process Outsourcing (KPO) |
| Captive (Self-Build) / In-house |
| Build-Operate-Transfer (BOT) |
| Hybrid Build-Operate-Transfer (BOT) |
| Large Enterprises |
| Small and Medium Enterprises (SMEs) |
| Banking, Financial Services, and Insurance (BFSI) |
| Telecom and IT |
| Healthcare and Life Sciences |
| Manufacturing, Automotive and Industrial |
| Retail and Consumer Goods |
| Other Industry Verticals |
| Brazil |
| Argentina |
| Rest of South America |
| By Function / Capability | Information Technology (IT) and Digital Services |
| Engineering / ER&D | |
| Business Process Management (BPM) | |
| Knowledge Process Outsourcing (KPO) | |
| By Engagement Model | Captive (Self-Build) / In-house |
| Build-Operate-Transfer (BOT) | |
| Hybrid Build-Operate-Transfer (BOT) | |
| By Organization Size | Large Enterprises |
| Small and Medium Enterprises (SMEs) | |
| By Industry Vertical | Banking, Financial Services, and Insurance (BFSI) |
| Telecom and IT | |
| Healthcare and Life Sciences | |
| Manufacturing, Automotive and Industrial | |
| Retail and Consumer Goods | |
| Other Industry Verticals | |
| By Country | Brazil |
| Argentina | |
| Rest of South America |


Key Questions Answered in the Report
What is the size of the South America global capability centers market in 2026?
The market size is projected to reach USD 40.33 billion by 2031, up from USD 26.55 billion in 2026.
What CAGR is projected for capability centers across South America through 2031?
The market is expected to expand at an 8.74% CAGR from 2026 to 2031.
Which functional segment is the largest within South America's capability centers?
Information technology and digital services account for a 55.12% revenue share and exhibit the fastest 9.02% CAGR.
Why are global firms selecting Brazil for capability centers?
Brazil offers the region’s largest skilled workforce, extensive cloud infrastructure, and supportive data-center tax incentives.
How does Argentina compare in growth momentum?
Argentina is projected to post a 9.17% CAGR due to competitive labor costs and the Knowledge Economy Law’s tax benefits.
Which engagement model is gaining traction among new entrants?
Hybrid build-operate-transfer models are growing at 9.54% CAGR as firms seek risk-balanced flexibility.
Page last updated on:


