South America Fixed Broadband Market Size and Share
Market Overview
| Study Period | 2019 - 2030 |
|---|---|
| Forecast Data Period | 2025 - 2030 |
| Historical Data Period | 2019 - 2023 |
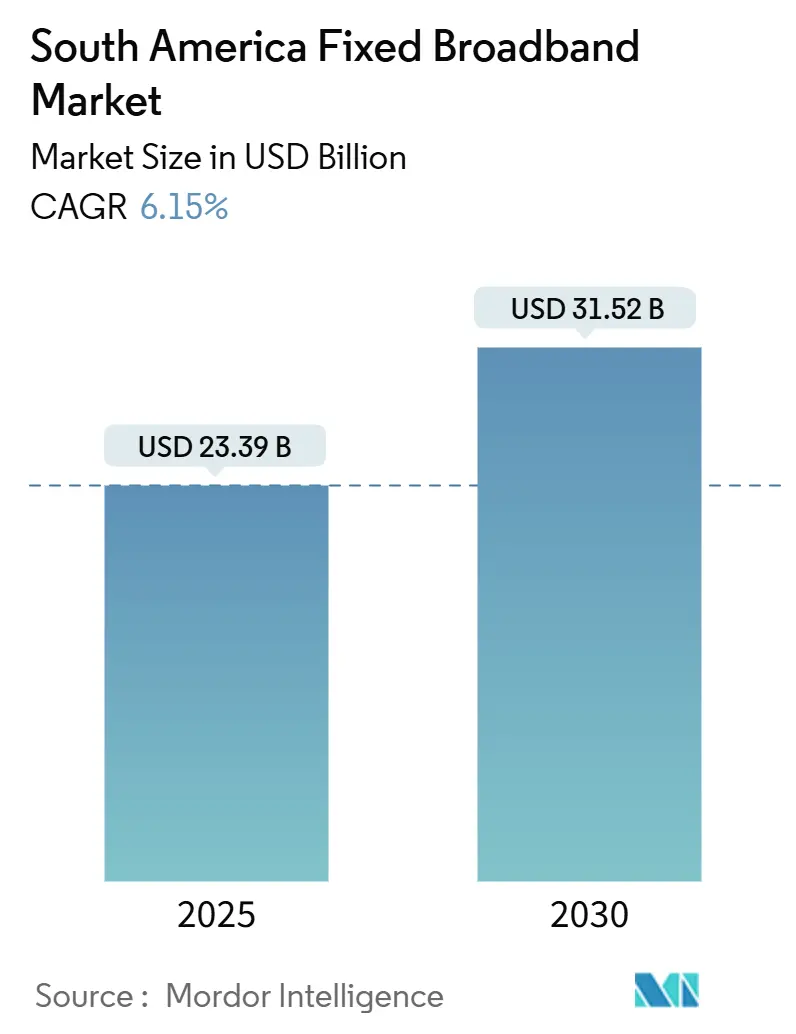
| Market Size (2025) | USD 23.39 Billion |
| Market Size (2030) | USD 31.52 Billion |
| Growth Rate (2025 - 2030) | 6.15% CAGR |
| Market Concentration | Medium |
Major Players *Disclaimer: Major Players sorted in no particular order Image © Mordor Intelligence. Reuse requires attribution under CC BY 4.0. | |
South America Fixed Broadband Market Analysis by Mordor Intelligence
The South America Fixed Broadband Market size is estimated at USD 23.39 billion in 2025, and is expected to reach USD 31.52 billion by 2030, at a CAGR of 6.15% during the forecast period (2025-2030).
Fiber-to-the-home roll-outs, 5G backhaul mandates, and rising multi-gigabit demand anchor this expansion, while neutral-host wholesale models and satellite competition broaden addressable segments. Incumbent telcos remain influential but face mounting pressure from aggressive fiber over-builders that are leveraging open-access regulations to win share in tier-1 metros. Regulatory backing for infrastructure sharing and declining equipment prices are trimming capital intensity, yet tariffs on imported fiber gear in Brazil temper near-term margins. Affordability gaps persist in lower-income countries, although falling satellite entry prices and government subsidies are beginning to shrink the digital divide.
Key Report Takeaways
- By geography, Brazil led with 54.89% of the South America fixed broadband market share in 2024, while the Rest of South America cluster is projected to expand at a 12.17% CAGR through 2030.
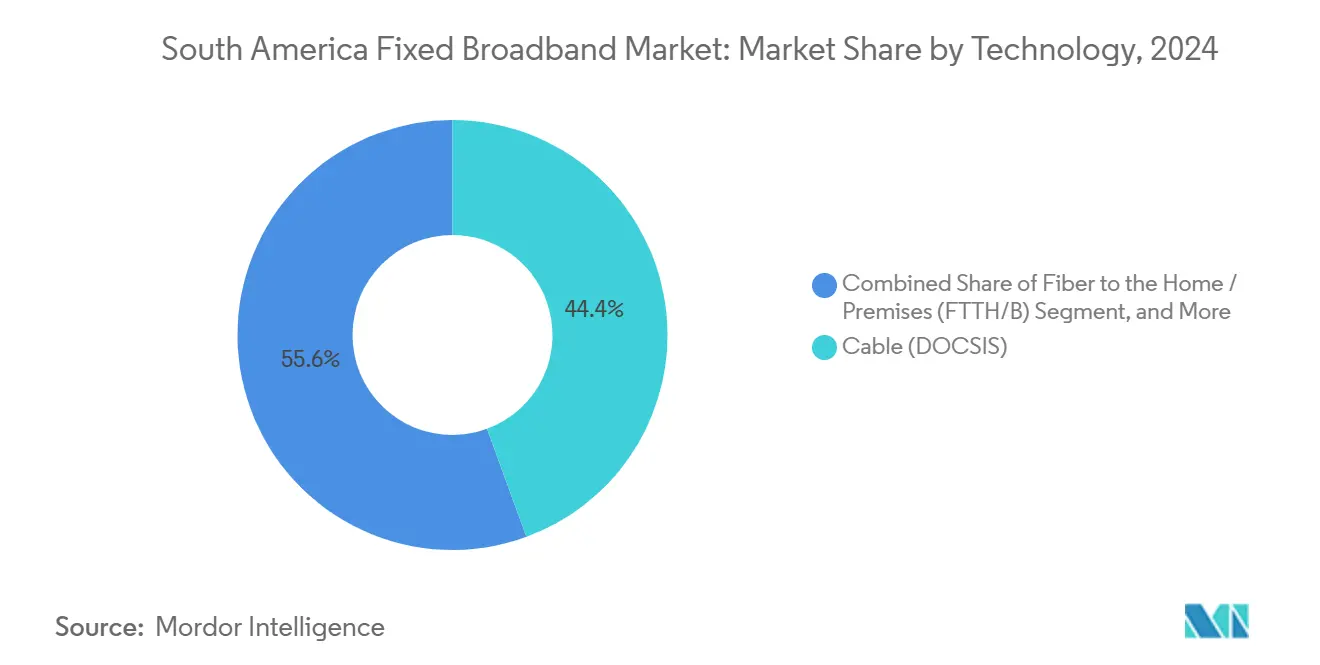
- By technology, Cable DOCSIS captured 44.40% share of the South America fixed broadband market size in 2024; fiber-to-the-home/premises is advancing at a 21.78% CAGR to 2030.
- By speed tier, the 100 Mbps–1 Gbps bracket held 65.93% revenue share in 2024, whereas services above 1 Gbps record the fastest CAGR at 28.46% through 2030.
- By end user, residential connections accounted for 87.93% of the South America fixed broadband market size in 2024, while commercial lines are growing at 13.14% CAGR.
- By application, video streaming led with 32.80% of usage in 2024; industrial and enterprise automation is growing fastest at 19.62% CAGR.
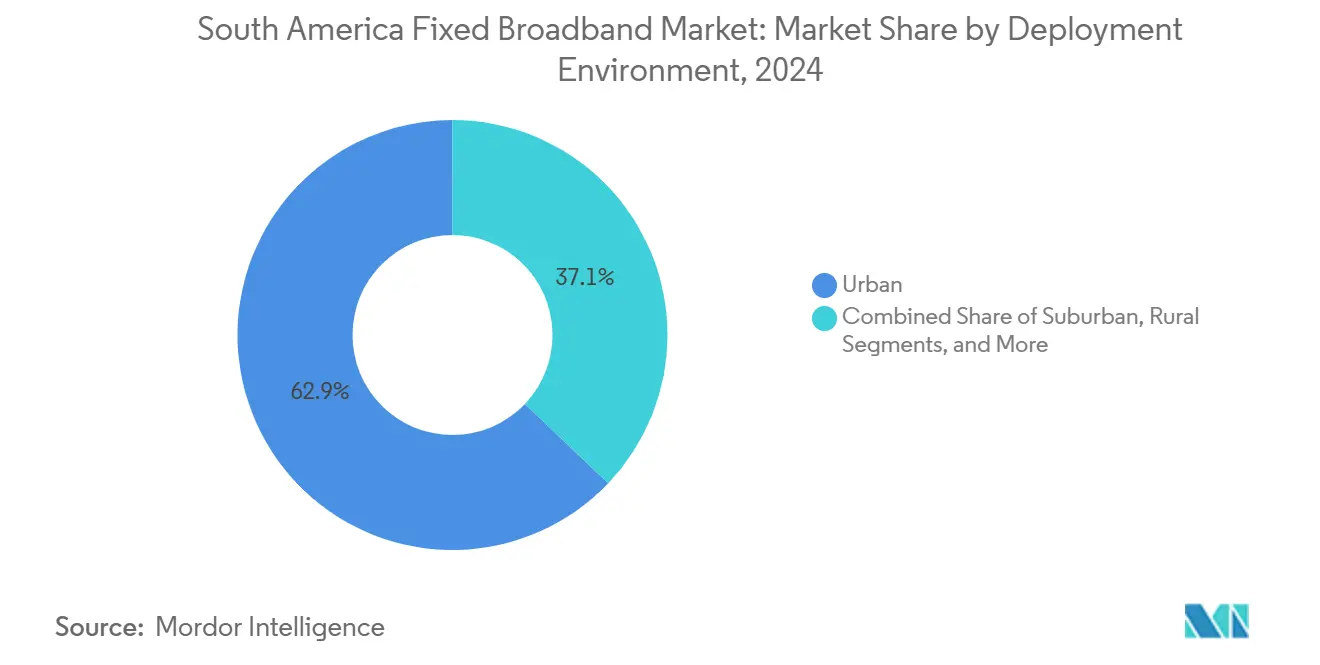
- By deployment environment, urban areas commanded 62.90% share of the South America fixed broadband market in 2024, yet suburban roll-outs exhibit a 10.28% CAGR through 2030.
- By ownership, incumbent telcos controlled 40.66% share in 2024, even as competitive fiber over-builders register 14.51% CAGR growth.
Note: Market size and forecast figures in this report are generated using Mordor Intelligence’s proprietary estimation framework, updated with the latest available data and insights as of January 2026.
South america contributes to a system defined not by any single geography but by the interaction of many. The global fixed broadband market data by Mordor Intelligence represents that combined structure.
South America Fixed Broadband Market Trends and Insights
Drivers Impact Analysis*
| Driver | (~) % Impact on CAGR Forecast | Geographic Relevance | Impact Timeline |
|---|---|---|---|
| Rapid FTTH/B over-build in tier-1 cities | +1.8% | Brazil, Chile, Colombia core markets | Medium term (2-4 years) |
| Fibre-backhaul obligations in 5 G licences | +1.2% | Regional, strongest in Brazil and Chile | Short term (≤ 2 years) |
| Neutral-host wholesale fibre platforms | +0.9% | Urban centers across South America | Medium term (2-4 years) |
| Surge in video-streaming and cloud-gaming | +1.1% | Global, concentrated in urban markets | Short term (≤ 2 years) |
| Exploding home-office and SMB digitalization | +0.8% | Region-wide, accelerated post-pandemic | Medium term (2-4 years) |
| Satellite-LEO price war for rural access | +0.7% | Rural and remote, pan-regional | Long term (≥ 4 years) |
| Source: Mordor Intelligence | |||
Rapid FTTH/B Over-build in Tier-1 Cities
Brazil passed 54.5 million homes with fiber by 2024, while Chile reached 85% urban coverage, illustrating an intense race among telcos and over-builders to secure premium urban subscribers. [1]TIM Brasil, “Relatório de Cobertura de Fibra 2024,” tim.com.br Incumbents defend share by matching multi-gigabit offers and bundling content, but new entrants narrow prices and shorten contract terms. [2]América Móvil, “Inversiones Infraestructura 2024,” americamovil.comRedundant parallel builds inflate capital spending, yet consumer prices fall and take-rates rise, accelerating churn away from copper and cable plants. América Móvil earmarked USD 7.7 billion for Brazilian fiber to sustain relevance amid this wave. Chile’s regulators now push open-access rules to tame duplication and spur cost-efficient densification.
Fibre-backhaul Obligations in 5G Spectrum Licenses
Regulators embed fiber backhaul clauses in 5G awards, compelling operators to lay fiber that simultaneously serves mobile and fixed markets.[3]Subsecretaría de Telecomunicaciones, “Bases de Licitación 5 G 2024,” subtel.gob.clBrazil’s ANATEL requires fiber to every 5 G macro-site in major cities, while Chile ties rural spectrum blocks to specific fiber milestones. These mandates eradicate legacy microwave bottlenecks, boost symmetrical bandwidth, and catalyze wholesale demand from smaller wireless players. Telefónica exploits the rule by pooling mobile and broadband capex, lifting network-wide returns as shared fiber strands monetize across multiple revenue lines.
Neutral-host Wholesale Fibre Platforms
Companies such as V.tal operate open networks that connect more than 100 ISPs across Brazil, lowering entry hurdles for niche brands and regional players. Shared ducts raise utilization toward 80% of strand capacity, contrasting with 40% in single-tenant builds. Enterprises gain diversity and SLA flexibility by sourcing multi-carrier services over a single drop. Policymakers in Colombia and Peru view these models as templates for bridging small-provider gaps without heavy public subsidies.
Surge in Video-streaming and Cloud-gaming Traffic
4K streams consume 25–35 Mbps while emergent 8K formats demand 80–300 Mbps, driving households toward higher tiers. Cloud gaming layers ultra-low-latency requirements that only fiber routinely meets. Carriers respond by deploying edge caches, upgrading passive optical networks to XGS-PON, and marketing premium 2–5 Gbps packages. Content-heavy metros see peak-time traffic spikes above 12 Tbps per city, forcing operators to add backhaul strands and reinforce exchange points.
Restraints Impact Analysis*
| Restraint | (~) % Impact on CAGR Forecast | Geographic Relevance | Impact Timeline |
|---|---|---|---|
| Pole-access and rights-of-way fees for ISPs | -0.8% | Region-wide, most severe in dense metros | Medium term (2-4 years) |
| Import tariffs on fibre-optic gear | -1.2% | Brazil primary, spillover to MERCOSUR | Short term (≤ 2 years) |
| Urban over-build squeezing ROI | -0.9% | Major metros across South America | Medium term (2-4 years) |
| High broadband basket ≥ 8% GNI/pc | -0.6% | Bolivia, Ecuador, rural pockets | Long term (≥ 4 years) |
| Source: Mordor Intelligence | |||
Import Tariffs on Fibre-optic Gear
Brazil levies a 35% duty on imported optical cables and active components, adding 20–30% to build costs versus peers with lighter regimes. Small ISPs lacking bulk-buy leverage delay projects, and capital scarcity raises reliance on vendor financing. Although Brazil’s ex-tarifário waiver relieves select items, frequent renewal cycles create planning uncertainty, slowing deployment schedules and capping competitive coverage.
High Fixed-broadband Costs Relative to Income
In Bolivia and Ecuador, a basic 25 Mbps plan can exceed 8% of gross national income per capita, quadruple the UN Broadband Commission’s 2% affordability target. Penetration stalls despite network presence, reinforcing urban-rural divides. Universal-service funds subsidize remote roll-outs, yet disbursement lags and bureaucratic hurdles limit immediate effect. Satellite LEO discounts may compress prices, but spectrum-regulatory fees could offset part of the savings if not harmonized.
*Our forecasts treat driver/restraint impacts as directional, not additive. The impact forecasts reflect baseline growth, mix effects, and variable interactions.
Segment Analysis
By Technology: Cable Dominance Erodes as Fiber Surges
Cable DOCSIS held 44.40% South America fixed broadband market share in 2024. Fiber-to-the-home, however, is compounding at 21.78% to 2030, expanding the South America fixed broadband market size for optical access even faster than overall demand. Hybrid fiber-coax upgrades to DOCSIS 4.0 yield gigabit peaks, but asymmetrical upload limitations push gamers and home-office users toward fiber. Rural areas still lean on fixed-wireless and emerging satellite options where trenching lacks scale economies.
Accelerated fiber adds create future-proof capacity, enabling symmetric 2–5 Gbps tiers and reducing maintenance relative to coaxial plants. Regulators encourage migration by capping copper wholesale rates and mandating open ducts. Cable operators respond by extending FTTx deeper and partnering with mobile affiliates for converged offers, preserving customer lifetime value amid bandwidth arms races.


By Speed Tier: Mainstream 100 Mbps–1 Gbps Holds, Multi-Gigabit Blooms
The 100 Mbps–1 Gbps band captured 65.93% of revenue in 2024, underpinning the bulk of South America fixed broadband market demand. Above 1 Gbps services soar at 28.46% CAGR, reshaping perceptions of premium connectivity. Entry-level ≤ 25 Mbps tiers continue to shrink as households upgrade for 4 K streaming, home schooling, and simultaneous video calls.
Cheaper optics and XGS-PON split ratios now support 10 Gbps residential offers at price points below USD 60 in Brazil. ISPs bundle cloud-gaming vouchers and Wi-Fi 6 mesh kits to monetize higher average revenue per user, offsetting volume-driven margin compression. Overall, the South America fixed broadband market size in the ≥ 1 Gbps bracket is forecast to triple by 2030.
By End User: Commercial Bandwidth Accelerates
Residential lines dominated with 87.93% share in 2024, yet commercial circuits post a 13.14% CAGR, outpacing the South America fixed broadband market average. Small and medium businesses pivot to cloud ERPs, video collaboration, and cybersecurity bundles that demand SLA-backed, low-latency fiber.
Neutral-host backbones let regional ISPs layer managed services on wholesale strands, capturing incremental margin without large capex. Telcos craft tiered enterprise portfolios that include SD-WAN and secure access service edge, locking in multi-year contracts. Consequently, the South America fixed broadband market size tied to commercial accounts is expected to double over the next five years.
By Application: Entertainment Rules, Automation Rises
Video streaming held 32.80% usage in 2024, reinforcing the role of on-demand content in shaping peak traffic. Industrial automation, though smaller, logs a 19.62% CAGR as factories adopt IoT sensors and real-time analytics.
Cloud-gaming, immersive AR/VR, and telemedicine further stretch latency bars, propelling fiber’s low-jitter advantage. Government smart-city pilots allocate municipal budgets to link traffic lights, CCTV, and environmental monitors, deepening machine-type bandwidth. This diversification secures longer-term demand beyond consumer video.
By Deployment Environment: Urban Leads, Suburban Closes Gap
Urban zones retained 62.90% share in 2024, capitalizing on density economics, yet suburban builds now clock 10.28% CAGR. Remote-work-driven migration to peri-urban areas spurs trenching into new housing tracts.
Shared trench policies and one-touch make-ready rules simplify suburban pole attachment, shaving rollout months. Satellite LEOs backfill fringe pockets until fiber reaches breakeven density, preserving brand presence and bundling upsell paths.
By Ownership: Incumbents Confront Over-builder Momentum
Incumbent telcos still own 40.66% of lines, leveraging legacy copper migrations and converged mobile bundles. Competitive over-builders grow at 14.51% CAGR, siphoning churners via symmetric gigabit offers and customer-centric support.
Open-access fiber amplifies this shift as smaller retailers ride wholesale strands, fragmenting customer share. Cable MSOs push DOCSIS 4.0 and content aggregation to defend against pure-play fiber. Overall ownership diversification should temper pricing power and nurture service innovation.
Geography Analysis
Brazil anchors the South America fixed broadband market with 54.89% share in 2024, fueled by scale, multi-technology competition, and regulatory clarity around spectrum and rights-of-way. América Móvil invested USD 7.7 billion to densify fiber, while Brisanet’s northeast surge shows over-builder resilience with 35% revenue growth. Submarine cable additions such as Monet and EllaLink enhance international capacity, cutting transit costs and bolstering streaming QoS.
Chile and Colombia form the second tier of maturity. Chile’s 95% urban fiber coverage and spectrum auctions tied to rural backhaul commitments uplift rural penetration beyond 70%. Colombia blends terrestrial and satellite, leveraging varied topography to justify hybrid architectures that balance capex and coverage.
The Rest of South America cluster (Peru, Argentina, Uruguay, Paraguay, and Andean nations) records the fastest 12.17% CAGR. Uruguay’s state-run Antel demonstrates how public leadership can attain 80% household fiber reach, whereas Argentina pursues satellite complements via ARSAT to bridge Patagonia and Andean gaps. Ongoing regulatory alignment within MERCOSUR on import duties could further spur fiber affordability region-wide.
The fixed broadband market is analyzed by Mordor Intelligence across multiple other geographies, with in-depth regional assessments available for Africa, North America, and Europe.
Competitive Landscape
Top four providers command roughly 65% combined share, placing the market in a moderately concentrated bracket. Incumbents Telefónica, América Móvil, Oi/V.tal, and TIM wield extensive ducts and brand equity, yet fiber over-builders such as Brisanet, Win Perú, and Desktop pursue high-speed niches in growth corridors. Neutral wholesale operators monetize strand abundance and catalyze fragmentation by hosting over 100 retail ISPs on shared infrastructure.
Strategy centers on converged bundles, content partnerships, and spectrum-linked fiber densification. TIM’s simultaneous 5 G and backhaul expansion across 100 Brazilian cities illustrates integrated capex plays that hedge against mobile substitution threats. Cable MSOs pivot to DOCSIS 4.0 and FTTx extensions while touting live-sports streaming deals to curb churn.
M&A continues as a consolidation lever; Claro’s USD 150 million acquisition of Desktop Sigmanet broadens São Paulo's fiber reach, while Telefónica divests its tower assets to recycle capital into urban PON upgrades. Low Earth orbit entrants such as Project Kuiper inject fresh rivalry in sparsely populated tracts, ensuring price tension across all footprint types.
South America Fixed Broadband Industry Leaders
América Móvil, S.A.B. de C.V.
Telefónica, S.A.
TIM S.A.
Administración Nacional de Telecomunicaciones (Antel)
Corporación Nacional de Telecomunicaciones CNT EP
- *Disclaimer: Major Players sorted in no particular order

Recent Industry Developments
- March 2025: V.tal expanded its neutral fiber network to 200 more Brazilian municipalities with a USD 800 million outlay.
- February 2025: Telefónica Chile finalized a USD 300 million urban fiber upgrade, launching symmetric multi-gigabit tiers.
- January 2025: Claro Brasil acquired Desktop Sigmanet for USD 150 million to boost São Paulo fiber coverage.
- December 2024: TIM Brasil finished 5 G deployment in 100 cities backed by USD 500 million fiber backhaul.


South America Fixed Broadband Market Report Scope
| Fiber to the Home / Premises (FTTH/B) |
| Cable (DOCSIS) |
| Digital Subscriber Line (DSL) and Copper |
| Fixed Wireless Access (5G/LTE) |
| Satellite Broadband |
| Up to 25 Mbps |
| 100 Mbps - 1 Gbps |
| Above 1 Gbps (Multi-Gig) |
| Residential |
| Commercial |
| Video Streaming and Entertainment |
| Online Gaming and Immersive Media |
| Remote Work and Cloud Collaboration |
| Smart Home and IoT Connectivity |
| Telehealth and Distance Learning |
| Industrial and Enterprise Automation |
| Urban |
| Suburban |
| Rural |
| Remote and Hard-to-Reach |
| Incumbent Telcos |
| Competitive Fibre Over-builders |
| Cable Multiple System Operators (MSOs) |
| Fixed Wireless ISPs |
| Satellite Network Operators |
| Brazil |
| Chile |
| Colombia |
| Peru |
| Argentina |
| Rest of South America (Panama, Costa Rica, Uruguay, Guatemala, and Others) |
| By Technology | Fiber to the Home / Premises (FTTH/B) |
| Cable (DOCSIS) | |
| Digital Subscriber Line (DSL) and Copper | |
| Fixed Wireless Access (5G/LTE) | |
| Satellite Broadband | |
| By Speed Tier | Up to 25 Mbps |
| 100 Mbps - 1 Gbps | |
| Above 1 Gbps (Multi-Gig) | |
| By End User | Residential |
| Commercial | |
| By Application | Video Streaming and Entertainment |
| Online Gaming and Immersive Media | |
| Remote Work and Cloud Collaboration | |
| Smart Home and IoT Connectivity | |
| Telehealth and Distance Learning | |
| Industrial and Enterprise Automation | |
| By Deployment Environment | Urban |
| Suburban | |
| Rural | |
| Remote and Hard-to-Reach | |
| By Ownership | Incumbent Telcos |
| Competitive Fibre Over-builders | |
| Cable Multiple System Operators (MSOs) | |
| Fixed Wireless ISPs | |
| Satellite Network Operators | |
| By Country | Brazil |
| Chile | |
| Colombia | |
| Peru | |
| Argentina | |
| Rest of South America (Panama, Costa Rica, Uruguay, Guatemala, and Others) |


Key Questions Answered in the Report
What is the projected value of the South America fixed broadband market by 2030?
It is forecast to reach USD 31.52 billion, growing at a 6.15% CAGR.
Which technology is growing fastest across the region?
Fiber-to-the-home/premises is rising at 21.78% CAGR as operators migrate customers off copper and coaxial lines.
How large is Brazil’s share of regional fixed broadband revenue?
Brazil accounted for 54.89% of total revenue in 2024.
Why are neutral-host fiber platforms important?
They let smaller ISPs offer gigabit services without building their own networks, enhancing competition and infrastructure utilization.
What factor most limits adoption in lower-income countries?
Affordability: monthly plans can exceed 8% of GNI per capita in markets such as Bolivia, well above the 2% affordability benchmark.
Which application segment shows the highest growth rate?
Industrial and enterprise automation leads with a 19.62% CAGR through 2030.
Page last updated on:


